Non-invasive in vivo characterization of breast tumors using photon migration spectroscopy
- PMID: 10933066
- PMCID: PMC1531865
- DOI: 10.1038/sj.neo.7900082
Non-invasive in vivo characterization of breast tumors using photon migration spectroscopy
Abstract
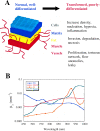
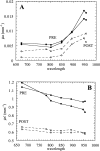
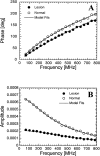
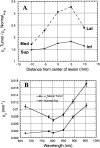
Frequency-domain photon migration (FDPM) is a non-invasive optical technique that utilizes intensity-modulated, near-infrared (NIR) light to quantitatively measure optical properties in thick tissues. Optical properties (absorption, mu(a), and scattering, mu(s)', parameters) derived from FDPM measurements can be used to construct low-resolution (0.5 to 1 cm) functional images of tissue hemoglobin (total, oxy-, and deoxy-forms), oxygen saturation, blood volume fraction, water content, fat content and cellular structure. Unlike conventional NIR transillumination, FDPM enables quantitative analysis of tissue absorption and scattering parameters in a single non-invasive measurement. The unique functional information provided by FDPM makes it well-suited to characterizing tumors in thick tissues. In order to test the sensitivity of FDPM for cancer diagnosis, we have initiated clinical studies to quantitatively determine normal and malignant breast tissue optical and physiological properties in human subjects. Measurements are performed using a non-invasive, multi-wavelength, diode-laser FDPM device optimized for clinical studies. Results show that ductal carcinomas (invasive and in situ) and benign fibroadenomas exhibit 1.25 to 3-fold higher absorption than normal breast tissue. Within this group, absorption is greatest for measurements obtained from sites of invasive cancer. Optical scattering is approximately 20% greater in pre-menopausal versus post-menopausal subjects due to differences in gland/cell proliferation and collagen/fat content. Spatial variations in tissue scattering reveal the loss of differentiation associated with breast disease progression. Overall, the metabolic demands of hormonal stimulation and tumor growth are detectable using photon migration techniques. Measurements provide quantitative optical property values that reflect changes in tissue perfusion, oxygen consumption, and cell/matrix development.
Figures


Similar articles
-
Non-invasive measurements of breast tissue optical properties using frequency-domain photon migration.Philos Trans R Soc Lond B Biol Sci. 1997 Jun 29;352(1354):661-8. doi: 10.1098/rstb.1997.0047. Philos Trans R Soc Lond B Biol Sci. 1997. PMID: 9232853 Free PMC article.
-
Noninvasive monitoring of hemodynamic stress using quantitative near-infrared frequency-domain photon migration spectroscopy.J Biomed Opt. 2002 Jan;7(1):34-44. doi: 10.1117/1.1427046. J Biomed Opt. 2002. PMID: 11818010
-
Spatial variations in optical and physiological properties of healthy breast tissue.J Biomed Opt. 2004 May-Jun;9(3):534-40. doi: 10.1117/1.1695560. J Biomed Opt. 2004. PMID: 15189091 Clinical Trial.
-
Quantitative In Vivo Imaging of Tissue Absorption, Scattering, and Hemoglobin Concentration in Rat Cortex Using Spatially Modulated Structured Light.In: Frostig RD, editor. In Vivo Optical Imaging of Brain Function. 2nd edition. Boca Raton (FL): CRC Press/Taylor & Francis; 2009. Chapter 12. In: Frostig RD, editor. In Vivo Optical Imaging of Brain Function. 2nd edition. Boca Raton (FL): CRC Press/Taylor & Francis; 2009. Chapter 12. PMID: 26844326 Free Books & Documents. Review.
-
Imaging in breast cancer: diffuse optics in breast cancer: detecting tumors in pre-menopausal women and monitoring neoadjuvant chemotherapy.Breast Cancer Res. 2005;7(6):279-85. doi: 10.1186/bcr1358. Epub 2005 Nov 28. Breast Cancer Res. 2005. PMID: 16457705 Free PMC article. Review.
Cited by
-
A Review of Recent Advances in Computer-Aided Detection Methods Using Hyperspectral Imaging Engineering to Detect Skin Cancer.Cancers (Basel). 2023 Nov 29;15(23):5634. doi: 10.3390/cancers15235634. Cancers (Basel). 2023. PMID: 38067338 Free PMC article. Review.
-
Optimizing sensitivity and dynamic range of silicon photomultipliers for frequency-domain near infrared spectroscopy.Biomed Opt Express. 2020 Sep 1;11(9):5373-5387. doi: 10.1364/BOE.401439. eCollection 2020 Sep 1. Biomed Opt Express. 2020. PMID: 33014621 Free PMC article.
-
Utilizing optical tomography with ultrasound localization to image heterogeneous hemoglobin distribution in large breast cancers.Neoplasia. 2005 Mar;7(3):263-70. doi: 10.1593/neo.04526. Neoplasia. 2005. PMID: 15799826 Free PMC article.
-
Evaluation of an Integrated Spectroscopy and Classification Platform for Point-of-Care Core Needle Biopsy Assessment: Performance Characteristics from Ex Vivo Renal Mass Biopsies.J Vasc Interv Radiol. 2022 Nov;33(11):1408-1415.e3. doi: 10.1016/j.jvir.2022.07.027. Epub 2022 Aug 5. J Vasc Interv Radiol. 2022. PMID: 35940363 Free PMC article.
-
Evaluation of breast tumor response to neoadjuvant chemotherapy with tomographic diffuse optical spectroscopy: case studies of tumor region-of-interest changes.Radiology. 2009 Aug;252(2):551-60. doi: 10.1148/radiol.2522081202. Epub 2009 Jun 9. Radiology. 2009. PMID: 19508985 Free PMC article. Clinical Trial.
References
-
- Cutler M. Transilluminating as an aid in the diagnosis of breast lesions. Surg Gynecol Obstet. 1929;48:721–728.
-
- Vastag B. Shining light on breast tumors. J Nat Cancer Inst. 1999;91(24):2072–2073. - PubMed
-
- Bonner RF, Nossal R, Havlin S, Weiss GH. Model for photon migration in turbid biological media. J Opt Soc Am A. 1987;4:423–432. - PubMed
-
- Boulnois JL. Photophysical processes in recent medical laser developments: a review. Lasers Med Sci. 1986;1:47–66.
-
- Svaasand L. On the Physical Rationale of Photodynamic Therapy. In: Gomer CJ, editor. Future Directions and Application in Photodynamic Therapy. SPIE Institute Series for Advanced Optical Technologies; 1990. pp. 233–248. IS6.
Publication types
MeSH terms
Substances
Grants and funding
LinkOut - more resources
Full Text Sources
Other Literature Sources
Medical
Research Materials
Miscellaneous
