. 2000 Aug 7;150(3):567-80.
doi: 10.1083/jcb.150.3.567.

p120 catenin regulates the actin cytoskeleton via Rho family GTPases

Affiliations

p120 catenin regulates the actin cytoskeleton via Rho family GTPases

N K Noren et al. J Cell Biol. .

Abstract

Cadherins are calcium-dependent adhesion molecules responsible for the establishment of tight cell-cell contacts. p120 catenin (p120ctn) binds to the cytoplasmic domain of cadherins in the juxtamembrane region, which has been implicated in regulating cell motility. It has previously been shown that overexpression of p120ctn induces a dendritic morphology in fibroblasts (Reynolds, A.B. , J. Daniel, Y. Mo, J. Wu, and Z. Zhang. 1996. Exp. Cell Res. 225:328-337.). We show here that this phenotype is suppressed by coexpression of cadherin constructs that contain the juxtamembrane region, but not by constructs lacking this domain. Overexpression of p120ctn disrupts stress fibers and focal adhesions and results in a decrease in RhoA activity. The p120ctn-induced phenotype is blocked by dominant negative Cdc42 and Rac1 and by constitutively active Rho-kinase, but is enhanced by dominant negative RhoA. p120ctn overexpression increased the activity of endogenous Cdc42 and Rac1. Exploring how p120ctn may regulate Rho family GTPases, we find that p120ctn binds the Rho family exchange factor Vav2. The behavior of p120ctn suggests that it is a vehicle for cross-talk between cell-cell junctions and the motile machinery of cells. We propose a model in which p120ctn can shuttle between a cadherin-bound state and a cytoplasmic pool in which it can interact with regulators of Rho family GTPases. Factors that perturb cell-cell junctions, such that the cytoplasmic pool of p120ctn is increased, are predicted to decrease RhoA activity but to elevate active Rac1 and Cdc42, thereby promoting cell migration.


Figures

Figure 1
Figure 1
Overexpression of p120ctn induces a dendritic morphology that is accompanied by loss of stress fibers and focal adhesions. NIH3T3 cells transfected with GFP, p120-GFP or p120ctn, or MDCK cells transfected with p120ctn were plated onto coverslips, fixed, stained, and processed for fluorescence microscopy 20–24 h post transfection. (A) Left panel shows GFP fluorescence and right panels are stained with antibodies against p120ctn. (B and C) Left panels show GFP fluorescence and right panels are stained with rhodamine-conjugated phalloidin (B) or with an antibody against vinculin (C). Note the loss of stress fibers and focal adhesions in cells expressing p120-GFP compared with untransfected cells or those expressing GFP alone. Bars, 20 μm.
Figure 1
Figure 1
Overexpression of p120ctn induces a dendritic morphology that is accompanied by loss of stress fibers and focal adhesions. NIH3T3 cells transfected with GFP, p120-GFP or p120ctn, or MDCK cells transfected with p120ctn were plated onto coverslips, fixed, stained, and processed for fluorescence microscopy 20–24 h post transfection. (A) Left panel shows GFP fluorescence and right panels are stained with antibodies against p120ctn. (B and C) Left panels show GFP fluorescence and right panels are stained with rhodamine-conjugated phalloidin (B) or with an antibody against vinculin (C). Note the loss of stress fibers and focal adhesions in cells expressing p120-GFP compared with untransfected cells or those expressing GFP alone. Bars, 20 μm.
Figure 2
Figure 2
Cadherin expression blocks the p120ctn-induced dendritic phenotype. (A) A schematic diagram of the C-cadherin constructs consisting of the extracellular domain (filled circles), the transmembrane region (open rectangles), the juxtamembrane domain (filled rectangles), and the catenin-binding region (shaded rectangles). Asterisks depict deleted regions that are replaced with one or two copies of a c-myc epitope. The constructs correspond to full-length C-cadherin (C-cad), C-cadherin lacking the complete cytoplasmic domain (CT), C-cadherin with a deletion of the β-catenin–binding domain (CT669), and C-cadherin lacking the juxtamembrane region (CT-CAT; Yap et al. 1998; see Materials and Methods). (B) C-cadherin constructs were coexpressed with p120-GFP in NIH3T3 cells and examined for GFP expression (left panels) or stained with antibodies against C-cadherin (right panels). Note that coexpression of C-cadherin constructs with an intact juxtamembrane region (p120ctn-binding site) decreased the number of cells expressing a dendritic phenotype, whereas coexpression of mutants lacking the juxtamembrane region had no effect. Bar, 20 μm. (C) Transfected cells were scored for the ability to generate dendritic extensions. A cell was scored as having a dendritic phenotype if it had three or more extensions longer than the cell body. At least 100 cells coexpressing C-cadherin constructs and p120-GFP were counted for each experiment. Data are the means ± SD of four independent experiments.
Figure 2
Figure 2
Cadherin expression blocks the p120ctn-induced dendritic phenotype. (A) A schematic diagram of the C-cadherin constructs consisting of the extracellular domain (filled circles), the transmembrane region (open rectangles), the juxtamembrane domain (filled rectangles), and the catenin-binding region (shaded rectangles). Asterisks depict deleted regions that are replaced with one or two copies of a c-myc epitope. The constructs correspond to full-length C-cadherin (C-cad), C-cadherin lacking the complete cytoplasmic domain (CT), C-cadherin with a deletion of the β-catenin–binding domain (CT669), and C-cadherin lacking the juxtamembrane region (CT-CAT; Yap et al. 1998; see Materials and Methods). (B) C-cadherin constructs were coexpressed with p120-GFP in NIH3T3 cells and examined for GFP expression (left panels) or stained with antibodies against C-cadherin (right panels). Note that coexpression of C-cadherin constructs with an intact juxtamembrane region (p120ctn-binding site) decreased the number of cells expressing a dendritic phenotype, whereas coexpression of mutants lacking the juxtamembrane region had no effect. Bar, 20 μm. (C) Transfected cells were scored for the ability to generate dendritic extensions. A cell was scored as having a dendritic phenotype if it had three or more extensions longer than the cell body. At least 100 cells coexpressing C-cadherin constructs and p120-GFP were counted for each experiment. Data are the means ± SD of four independent experiments.
Figure 3
Figure 3
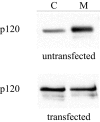
p120ctn overexpression increases the cytosolic pool of p120ctn. The relative distribution of p120ctn in cytosolic (C) and membrane (M) fractions was compared in both untransfected and p120-GFP-transfected NIH3T3 cells. Fractions were analyzed by SDS-PAGE and blotted with antibodies against p120ctn.
Figure 4
Figure 4
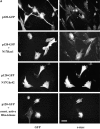
The p120ctn-induced dendritic phenotype is suppressed by coexpressed N17Rac1, N17Cdc42 and constitutively active Rho kinase. NIH3T3 cells were plated on coverslips and transfected with p120-GFP alone, p120-GFP and N17Rac1, p120-GFP and N17Cdc42, or p120-GFP and Rho-kinase. 20–24 h post transfection, cells were processed for fluorescence microscopy as described in Materials and Methods. Left panels show GFP expression and right panels are stained for c-myc to reveal the cells expressing N17Rac1, N17 Cdc42 and Rho-kinase. Bar, 20 μm. (B) Transfected cells were scored and compared for their ability to generate dendritic extensions (see Fig. 2 C). Data are the means ± SD of four separate experiments.
Figure 4
Figure 4
The p120ctn-induced dendritic phenotype is suppressed by coexpressed N17Rac1, N17Cdc42 and constitutively active Rho kinase. NIH3T3 cells were plated on coverslips and transfected with p120-GFP alone, p120-GFP and N17Rac1, p120-GFP and N17Cdc42, or p120-GFP and Rho-kinase. 20–24 h post transfection, cells were processed for fluorescence microscopy as described in Materials and Methods. Left panels show GFP expression and right panels are stained for c-myc to reveal the cells expressing N17Rac1, N17 Cdc42 and Rho-kinase. Bar, 20 μm. (B) Transfected cells were scored and compared for their ability to generate dendritic extensions (see Fig. 2 C). Data are the means ± SD of four separate experiments.
Figure 5
Figure 5
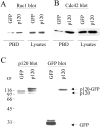
p120ctn induces Rac1 and Cdc42 activation. The level of active GTP-bound Rac1 (A) or GTP-bound Cdc42 (B) was measured in CHO cells transfected with either GFP or p120-GFP. Rac1 and Cdc42 activity assays were performed as described in Materials and Methods using a GST fusion protein derived from PAK (PBD) that selectively binds GTP-bound Rac1 and Cdc42. GST-PBD precipitations were immunoblotted with monoclonal antibodies recognizing Rac1 or Cdc42. Cell lysates were blotted with these antibodies to compare total levels of endogenous Rac1 and Cdc42 in transfected cells. In this representative experiment, p120-GFP induces a 2.4-fold activation of Rac1, the mean of four separate experiments being 1.9 ± 0.5. p120-GFP stimulates a 3.0-fold activation of Cdc42 in the representative experiment shown, the mean of three separate experiments being 3.1 ± 0.7. (C) The level of expression of p120-GFP and GFP in transfected cells was compared by blotting whole cell lysates with antibodies against p120ctn (left) or GFP (right). Endogenous p120ctn was detected as two bands, and p120-GFP was detected migrating above these. p120-GFP expression is usually two- to threefold higher than that of endogenous p120ctn.
Figure 6
Figure 6
p120ctn decreases RhoA activity. The amount of GTP-bound RhoA was measured using a GST fusion protein containing the RhoA-binding domain of Rhotekin (RBD) that selectively binds only GTP-bound RhoA. GST-RBD precipitations were probed with a monoclonal antibody against RhoA. The amount of active RhoA was measured in CHO cells expressing either GFP or p120-GFP. Relative RhoA activity was determined using a phosphorimager as described in Materials and Methods. Data are the means ± SEM of three independent experiments.
Figure 7
Figure 7
Overexpression of p120ctn stimulates cell migration. Migration assays were performed on CHO cells transfected with GFP or p120-GFP. Cells were plated in serum-free medium on a transwell membrane, coated on the underside with fibronectin (10 μg/ml). Cells migrating through the membrane were identified using fluorescence microscopy and counted. The graph represents the means of three separate experiments ± SEM (P < 0.001).
Figure 8
Figure 8
p120ctn associates with the guanine nucleotide exchange factor Vav2. (A) Endogenous p120ctn was immunoprecipitated from confluent HEK293 cells and electrophoresed adjacent to a HEK293 lysate. After transfer to nitrocellulose, it was probed with antibodies against the GEFs Vav2, Sos1, and C3G. p120ctn immunoprecipitates were also probed with antibodies against p190RhoGAP. Blots were reprobed for total amount of p120ctn in lysates and in immunoprecipitations. (Lower panel) p120ctn immunoprecipitations and control immunoprecipitations using rabbit anti–mouse IgG were blotted for associated Vav2 and reprobed for the amount of p120ctn in lysates and immunoprecipitates. (B) Endogenous Vav2 was immunoprecipitated from HEK293 cells and probed with antibodies against p120ctn and E-cadherin. Vav2 was immunoprecipitated from HEK293 cell lysates and the immunoprecipitates probed with anti-p120ctn antibody or anti-Vav2 antibody (bottom). Lane 1 is a control immunoprecipitation in which protein A–Sepharose beads were used alone. (C) Detergent-free subcellular fractionation was performed to reveal the subcellular distribution of endogenous p120ctn, E-cadherin, and Vav2 in HEK293 cells (see Materials and Methods). Cytosolic (C) and membrane (M) fractions were analyzed by SDS-PAGE and blotted with antibodies against p120ctn, E-cadherin, and Vav2.
Figure 8
Figure 8
p120ctn associates with the guanine nucleotide exchange factor Vav2. (A) Endogenous p120ctn was immunoprecipitated from confluent HEK293 cells and electrophoresed adjacent to a HEK293 lysate. After transfer to nitrocellulose, it was probed with antibodies against the GEFs Vav2, Sos1, and C3G. p120ctn immunoprecipitates were also probed with antibodies against p190RhoGAP. Blots were reprobed for total amount of p120ctn in lysates and in immunoprecipitations. (Lower panel) p120ctn immunoprecipitations and control immunoprecipitations using rabbit anti–mouse IgG were blotted for associated Vav2 and reprobed for the amount of p120ctn in lysates and immunoprecipitates. (B) Endogenous Vav2 was immunoprecipitated from HEK293 cells and probed with antibodies against p120ctn and E-cadherin. Vav2 was immunoprecipitated from HEK293 cell lysates and the immunoprecipitates probed with anti-p120ctn antibody or anti-Vav2 antibody (bottom). Lane 1 is a control immunoprecipitation in which protein A–Sepharose beads were used alone. (C) Detergent-free subcellular fractionation was performed to reveal the subcellular distribution of endogenous p120ctn, E-cadherin, and Vav2 in HEK293 cells (see Materials and Methods). Cytosolic (C) and membrane (M) fractions were analyzed by SDS-PAGE and blotted with antibodies against p120ctn, E-cadherin, and Vav2.
Figure 9
Figure 9
The p120ctn-induced dendritic phenotype is suppressed by coexpression of the COOH terminus of Vav2. NIH3T3 cells were plated on coverslips and transfected with p120ctn + GFP (top panel) or p120ctn + COOH terminus of Vav2 fused to GFP (C-term Vav2) (bottom). Left panels show GFP fluorescence of cells transfected with GFP or C-term Vav2-GFP and right panels are stained with anti-p120ctn antibodies. (B) Transfected cells were scored for the dendritic phenotype (see Fig. 2 C) and compared. Data are the means ± SD of four separate experiments.
Figure 9
Figure 9
The p120ctn-induced dendritic phenotype is suppressed by coexpression of the COOH terminus of Vav2. NIH3T3 cells were plated on coverslips and transfected with p120ctn + GFP (top panel) or p120ctn + COOH terminus of Vav2 fused to GFP (C-term Vav2) (bottom). Left panels show GFP fluorescence of cells transfected with GFP or C-term Vav2-GFP and right panels are stained with anti-p120ctn antibodies. (B) Transfected cells were scored for the dendritic phenotype (see Fig. 2 C) and compared. Data are the means ± SD of four separate experiments.
Figure 10
Figure 10
Scheme for how p120ctn may regulate the activity of RhoA, Rac1, and Cdc42. p120ctn exists in an equilibrium between two states, bound to the juxtamembrane region of cadherins or free in the cytoplasm. When it is not associated with cadherins, p120ctn deceases RhoA activity and increases the activity of Cdc42 and Rac1. One possible means by which p120ctn may activate Cdc42 and Rac1 is via association with the exchange factor Vav2.

Similar articles

Cited by

References

    1. Abe K., Rossman K., Liu B., Riola K., Chiang D., Campbell S., Burridge K., Der C. Vav2 is an activator of Cdc42, Rac1 and RhoA. J. Biol. Chem. 2000;275:10141–10149. - PubMed
    1. Abercrombie M. Contact inhibition and malignancy. Nature. 1979;281:259–262. - PubMed
    1. Aberle H., Butz S., Stappert J., Weissig H., Kemler R., Hoschuetzky H. Assembly of the cadherin-catenin complex in vitro with recombinant proteins. J. Cell Sci. 1994;107:3655–3663. - PubMed
    1. Adams C.L., Nelson W.J. Cytomechanics of cadherin-mediated cell-cell adhesion. Curr. Opin. Cell Biol. 1998;10:572–577. - PubMed
    1. Anastasiadis P.Z., Reynolds A.B. The p120 catenin familycomplex roles in adhesion, signaling and cancer. J. Cell Sci. 2000;113:1319–1334. - PubMed

Publication types

MeSH terms