Murine model of interstitial cytomegalovirus pneumonia in syngeneic bone marrow transplantation: persistence of protective pulmonary CD8-T-cell infiltrates after clearance of acute infection
- PMID: 10906203
- PMCID: PMC112270
- DOI: 10.1128/jvi.74.16.7496-7507.2000
Murine model of interstitial cytomegalovirus pneumonia in syngeneic bone marrow transplantation: persistence of protective pulmonary CD8-T-cell infiltrates after clearance of acute infection
Abstract
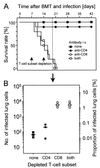
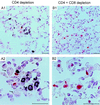
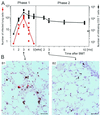
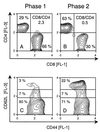
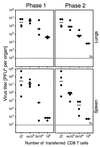
Interstitial pneumonia (IP) is a severe organ manifestation of cytomegalovirus (CMV) disease in the immunocompromised host, in particular in recipients of bone marrow transplantation (BMT). Diagnostic criteria for the definition of CMV-IP include clinical evidence of pneumonia together with CMV detected in bronchoalveolar lavage or lung biopsy. We have used the model of syngeneic BMT and simultaneous infection of BALB/c mice with murine CMV for studying the pathogenesis of CMV-IP by controlled longitudinal analysis. A disseminated cytopathic infection of the lungs with fatal outcome was observed only when reconstituting CD8 T cells were depleted. Neither CD8 nor CD4 T cells mediated an immunopathogenesis of acute CMV-IP. By contrast, after efficient hematolymphopoietic reconstitution, viral replication in the lungs was moderate and focal. The histopathological picture was dominated by preferential infiltration of CD8 T cells confining viral replication to inflammatory foci. Notably, after clearance of acute infection, CD62L(lo) and CD62L(hi) subsets of CD44(+) memory CD8 T cells were found to persist in lung tissue. One can thus operationally distinguish an early CMV-positive IP (phase 1) and a late CMV-negative IP (phase 2). According to the definition, phase 2 histopathology would not be diagnosed as a CMV-IP and could instead be misinterpreted as a CMV-induced immunopathology. We document here that phase 1 as well as phase 2 pulmonary CD8 T cells are capable of exerting effector functions and are effectual in protecting against productive infection. We propose that antiviral "stand-by" memory-effector T cells persist in the lungs to prevent virus recurrence from latency.
Figures


Similar articles
-
Enrichment of immediate-early 1 (m123/pp89) peptide-specific CD8 T cells in a pulmonary CD62L(lo) memory-effector cell pool during latent murine cytomegalovirus infection of the lungs.J Virol. 2000 Dec;74(24):11495-503. doi: 10.1128/jvi.74.24.11495-11503.2000. J Virol. 2000. PMID: 11090146 Free PMC article.
-
Cytopathology or immunopathology? The puzzle of cytomegalovirus pneumonitis revisited.Bone Marrow Transplant. 2000 Sep;26(6):591-7. doi: 10.1038/sj.bmt.1702562. Bone Marrow Transplant. 2000. PMID: 11035367 Free PMC article. Review.
-
Preemptive CD8 T-cell immunotherapy of acute cytomegalovirus infection prevents lethal disease, limits the burden of latent viral genomes, and reduces the risk of virus recurrence.J Virol. 1998 Mar;72(3):1797-804. doi: 10.1128/JVI.72.3.1797-1804.1998. J Virol. 1998. PMID: 9499030 Free PMC article.
-
Pathogenesis of cytomegalovirus pneumonia in immunocompromised hosts.Semin Respir Infect. 1995 Dec;10(4):199-208. Semin Respir Infect. 1995. PMID: 8668847 Review.
-
The establishment of cytomegalovirus latency in organs is not linked to local virus production during primary infection.J Gen Virol. 1994 Sep;75 ( Pt 9):2329-36. doi: 10.1099/0022-1317-75-9-2329. J Gen Virol. 1994. PMID: 8077931
Cited by
-
Refining human T-cell immunotherapy of cytomegalovirus disease: a mouse model with 'humanized' antigen presentation as a new preclinical study tool.Med Microbiol Immunol. 2016 Dec;205(6):549-561. doi: 10.1007/s00430-016-0471-0. Epub 2016 Aug 18. Med Microbiol Immunol. 2016. PMID: 27539576 Review.
-
Parameters determining the efficacy of adoptive CD8 T-cell therapy of cytomegalovirus infection.Med Microbiol Immunol. 2012 Nov;201(4):527-39. doi: 10.1007/s00430-012-0258-x. Epub 2012 Sep 13. Med Microbiol Immunol. 2012. PMID: 22972232 Review.
-
Random, asynchronous, and asymmetric transcriptional activity of enhancer-flanking major immediate-early genes ie1/3 and ie2 during murine cytomegalovirus latency in the lungs.J Virol. 2001 Mar;75(6):2692-705. doi: 10.1128/JVI.75.6.2692-2705.2001. J Virol. 2001. PMID: 11222693 Free PMC article.
-
Control of primary mouse cytomegalovirus infection in lung nodular inflammatory foci by cooperation of interferon-gamma expressing CD4 and CD8 T cells.PLoS Pathog. 2018 Aug 28;14(8):e1007252. doi: 10.1371/journal.ppat.1007252. eCollection 2018 Aug. PLoS Pathog. 2018. PMID: 30153311 Free PMC article.
-
Mast Cells Meet Cytomegalovirus: A New Example of Protective Mast Cell Involvement in an Infectious Disease.Cells. 2022 Apr 21;11(9):1402. doi: 10.3390/cells11091402. Cells. 2022. PMID: 35563708 Free PMC article. Review.
References
-
- Alterio de Goss M, Holtappels R, Steffens H-P, Podlech J, Angele P, Dreher L, Thomas D, Reddehase M J. Control of cytomegalovirus in bone marrow transplantation chimeras lacking the prevailing antigen-presenting molecule in recipient tissues rests primarily on recipient-derived CD8 T cells. J Virol. 1998;72:7733–7744. - PMC - PubMed
-
- Chien S M, Chan C K, Kasupski G, Chamberlain D, Fyles G, Messner H. Long-term sequelae after recovery from cytomegalovirus pneumonia in allogeneic bone marrow transplant recipients. Chest. 1992;101:1000–1004. - PubMed
Publication types
MeSH terms
LinkOut - more resources
Full Text Sources
Medical
Research Materials
Miscellaneous

