. 2000 Jul 15;20(14):5208-16.
doi: 10.1523/JNEUROSCI.20-14-05208.2000.

Long-term potentiation of intrinsic excitability at the mossy fiber-granule cell synapse of rat cerebellum

Affiliations

Long-term potentiation of intrinsic excitability at the mossy fiber-granule cell synapse of rat cerebellum

S Armano et al. J Neurosci. .

Abstract

Synaptic activity can induce persistent modifications in the way a neuron reacts to subsequent inputs by changing either synaptic efficacy or intrinsic excitability. After high-frequency synaptic stimulation, long-term potentiation (LTP) of synaptic efficacy is commonly observed at hippocampal synapses (Bliss and Collingridge, 1993), and potentiation of intrinsic excitability has recently been reported in cerebellar deep nuclear neurons (Aizenmann and Linden, 2000). However, the potential coexistence of these two aspects of plasticity remained unclear. In this paper we have investigated the effect of high-frequency stimulation on synaptic transmission and intrinsic excitability at the mossy fiber-granule cell relay of the cerebellum. High-frequency stimulation, in addition to increasing synaptic conductance (D'Angelo et al., 1999), increased granule cell input resistance and decreased spike threshold. These changes depended on postsynaptic depolarization and NMDA receptor activation and were prevented by inhibitory synaptic activity. Potentiation of intrinsic excitability was induced by relatively weaker inputs than potentiation of synaptic efficacy, whereas with stronger inputs the two aspect of potentiation combined to enhance EPSPs and spike generation. Potentiation of intrinsic excitability may extend the computational capability of the cerebellar mossy fiber-granule cell relay.


Figures

Fig. 1.
Fig. 1.
Synaptic excitation and inhibition of cerebellar granule cells. A, Schematic drawing of the cerebellar network. GrC, Granule cell;GoC, Golgi cell; PC, Purkinje cell;mf, mossy fiber; pf, parallel fiber.B, Granule cell synaptic responses elicited from two different membrane potentials before and after 10 μmbicuculline application. Bicuculline enhanced EPSPs and spike generation. C, Granule cell synaptic responses elicited from different membrane potentials in bicuculline-free solution. The hyperpolarizing component of the response was present only above the Cl equilibrium potential (−66 mV). Amplitudes of the depolarizing (○) and hyperpolarizing (●) components of the response are plotted to the right(symbols over tracings indicate where measurements were taken).
Fig. 2.
Fig. 2.
LTP of excitatory transmission.A1, A2, Effect of TBS delivered from −70 mV in a solution containing 10 μm bicuculline. Control EPSPs activated from −80 mV measured 9.1 ± 3.2 mV in A1 and 21.2 ± 4.3 mV in A2. LTP was manifest as an EPSP increase, which was larger in A2 thanA1. In A2, EPSP growth led to spike generation 7 min after TBS. B1 andB2, Membrane depolarization during TBS corresponding to recordings in A1,A2. Note stronger depolarization and spike generation in B2 thanB1. C, Average EPSP potentiation in five cells as in A1 (●) and in five cells as in A2 (○; the point series is interrupted because of spike generation). Results are compared with control EPSP recordings in which no TBS was applied (Δ;n = 5). D, Potentiation of the probability of firing during LTP in cells showing spikes during the control period (n = 8). In this and the following figures, an arrowhead (➤) and avertical dotted line indicate TBS. Data points are reported as mean ± SD, and time is relative to beginning of recordings.
Fig. 3.
Fig. 3.
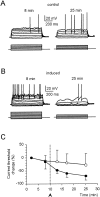
Enhanced action potential generation during LTP. Granule cell responses to current injection (bottom tracings, 2 pA/step) from −80 mV are compared in (A) control recordings and in (B) recordings in which LTP was induced (this cell was one of those included in Fig.2A1). Tracings were taken 8 and 25 min after the beginning of recordings. C, Time course of the current needed to fire action potentials (current threshold) in control recordings (○; n = 5) and in recordings in which LTP was induced (●; n = 10). Note the marked decrease in current threshold during LTP.
Fig. 4.
Fig. 4.
Increased input resistance during LTP.A, B, Voltage–current plots have been constructed by measuring steady-state depolarization in the tracings of Figure 3, A and B, respectively (○ 8 min and ● 25 min after beginning of recordings). C, Time course of Rin in control recordings (dotted line, n = 5; SD was between 0.5 and 0.7 GΩ) and in recordings in which LTP was induced (solid line; n = 7). Note that after LTP induction, Rin increased at potentials higher (54) but not lower (55) than −80 mV. In control recordingsRin remained stable in both potential ranges.
Fig. 5.
Fig. 5.
Decreased spike threshold during LTP. The inset shows where the thresholds of spike prepotential (Th1) and spike upstroke (Th2) were measured. A, B, Spikes in control recordings (A) and in recordings in which LTP was induced (B). Tracings were taken 8 and 25 min after beginning recordings from the same cells shown in Figure 3. C, Time course of threshold changes in control recordings (n = 5;dotted line; the SD was between 4 and 6 mV) and in recordings in which LTP was induced (n = 10).D, Greater decrease in Th1than Th2 caused an enlargement of spike prepotential during LTP (●; n = 10; control recordings 35; n = 5).
Fig. 6.
Fig. 6.
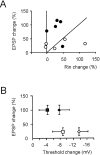
Relationship between EPSP and intrinsic excitability potentiation. A, Plot of EPSP versusRin changes at potentials higher than −80 mV. The diagonal is the place where EPSP equalsRin changes, ○ corresponds to weak TBS (same experiments as in Fig.2A1,B1), and ● corresponds to strong TBS (same experiments as in Fig.2A2,B2). B, Plot of EPSP versus Th1 (▩, strong TBS,n = 5; ■, weak TBS, n = 5) and Th2 (⧫, strong TBS,n = 5; ◊, weak TBS, n = 5) changes. Th1 andTh2, which were measured in the same cells included in Figure 2C and Table 2, were corrected for time-dependent changes in control recordings. Note that changes inRin,Th1, andTh2 were already appreciable, with relatively small EPSP changes. All data in this figure were recorded 15 min after TBS.
Fig. 7.
Fig. 7.
Synaptic inhibition prevents LTP. Effect of TBS during perfusion of a bicuculline-free solution. A, B, Tracings in A [EPSPs (top row) and responses to 4 and 8 pA current steps (bottom row); ➤ indicates application of TBS] and B (membrane depolarization during TBS) illustrate one of two experiments in which recordings lasted long enough to allow a second TBS to be applied during subsequent 10 μm bicuculline perfusion. LTP, comprising EPSP and intrinsic excitability potentiation, could be elicited in the presence but not in the absence of bicuculline.C, Average EPSP changes in six cells after TBS in bicuculline-free solution. D, Rinchanges (both above and below −80 mV) and changes inTh1 and Th2corrected for time-dependent changes in control recordings. All data were recorded 15 min after TBS (same cells as inC).
Fig. 8.
Fig. 8.
Membrane hyperpolarization prevents LTP. Effect of TBS delivered from −90 mV (10 μm bicuculline in the bath). A, EPSPs recorded before and after TBS.B, Membrane depolarization during TBS. Note that TBS does not reach spike threshold. C, Average EPSP changes in five cells after TBS. The control dotted lines are replotted from Figure 2C. D,Rin changes (both above and below −80 mV) and changes in Th1 andTh2 corrected for time-dependent changes in control recordings. All data were recorded 15 min after TBS (same cells as in C).
Fig. 9.
Fig. 9.
LTP dependence on voltage and spike frequency. A1, Magnitude of EPSP amplitude changes as a function of depolarization (A1) or spike frequency (A2) during TBS. ▵, Strong TBS in 10 μm bicuculline (as in Fig.2A2); ○, weak TBS in 10 μmbicuculline (as in Fig. 2A1); ◊, TBS in bicuculline-free solution (as in Fig. 7); ■, TBS from −90 mV in 10 μm bicuculline (as in Fig. 8). InA1, synaptic current changes in voltage-clamp recordings with pairing at −60 or −40 mV are shown for comparison (▴) (data from D'Angelo et al., 1999). B1,B2, Normalized changes in EPSP (solid line), Rin (dashed line), and spike threshold (Th1; dotted line) as a function of depolarization (B1) or spike frequency (B2) during TBS. EPSP andTh1 data have been adjusted for time-dependent changes in control recordings. Note that changes inRin and Th1 occur earlier than those in EPSPs. All data in this figure were recorded 15 min after TBS.
Fig. 10.
Fig. 10.
NMDA receptor block prevents LTP. Effect of TBS delivered from −70 mV in the presence of 100 μm APV and 50 μm 7-Cl-ky to block NMDA receptors (10 μm bicuculline in the bath). A1,A2, EPSPs recorded before and after TBS shown inB1 and B2. Although a normal TBS was applied inB1, TBS was reinforced inB2 by a 10 pA pulse during synaptic activation. C, Average EPSP changes after TBS in six cells as in A1 andB1 and in four cells as inA2 andB2. D,Rin changes (both above and below −80 mV) and changes in Th1 andTh2 adjusted for time-dependent changes in control recordings. All data were recorded 15 min after TBS (same cells as in C).

Similar articles

Cited by

References

    1. Abraham WC, Gustafsson B, Wigström H. Long-term potentiation involves enhanced synaptic excitation relative to synaptic inhibition in guinea-pig hippocampus. J Physiol (Lond) 1987;394:367–380. - PMC - PubMed
    1. Aizenmann C, Linden DJ. Rapid, synaptically driven increases in the intrinsic excitability of cerebellar nuclear neurons. Nat Neurosci. 2000;3:109–111. - PubMed
    1. Aizenmann C, Manis PB, Linden DJ. Polarity of long-term synaptic changes is related to postsynaptic spike firing at a cerebellar inhibitory synapse. Neuron. 1998;21:827–835. - PubMed
    1. Andersen P, Sundberg SH, Sveen O, Swann JW, Wigström H. Possible mechanisms for long-lasting potentiation of synaptic transmission in hippocampal slices from guinea-pigs. J Physiol (Lond) 1980;301:463–482. - PMC - PubMed
    1. Arbib MA, Erdi P, Szentagothai J. Neural organization: structure, function, and dynamics. MIT; London: 1998. Cerebellum. pp. 261–302.

Publication types

Substances

LinkOut - more resources