

HMG I/Y regulates long-range enhancer-dependent transcription on DNA and chromatin by changes in DNA topology
- PMID: 10871404
- PMCID: PMC102711
- DOI: 10.1093/nar/28.13.2541
HMG I/Y regulates long-range enhancer-dependent transcription on DNA and chromatin by changes in DNA topology
Abstract
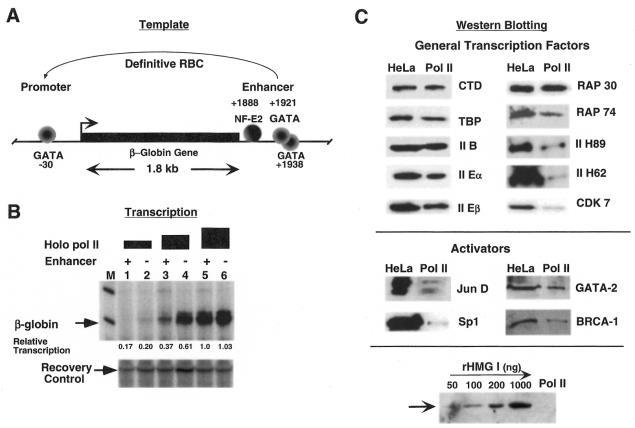
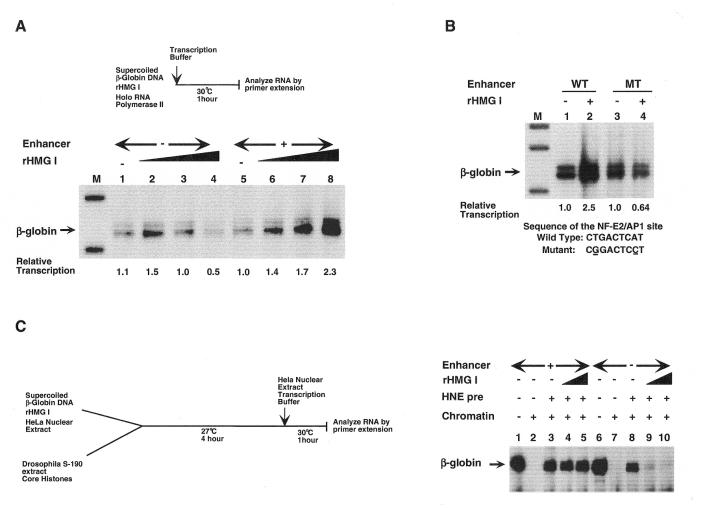
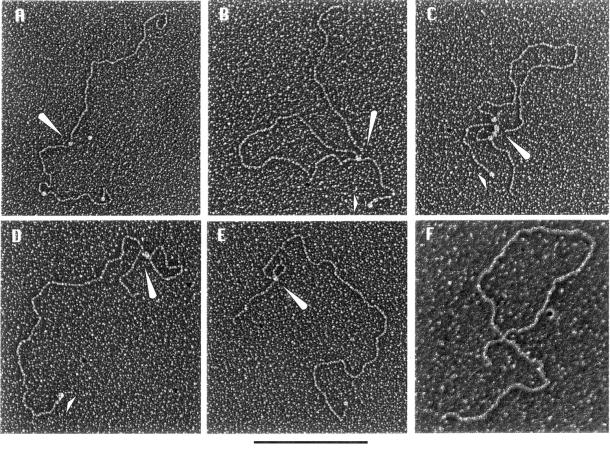
The nature of nuclear structures that are required to confer transcriptional regulation by distal enhancers is unknown. We show that long-range enhancer-dependent beta-globin transcription is achieved in vitro upon addition of the DNA architectural protein HMG I/Y to affinity-enriched holo RNA polymerase II complexes. In this system, HMG I/Y represses promoter activity in the absence of an associated enhancer and strongly activates transcription in the presence of a distal enhancer. Importantly, nucleosome formation is neither necessary for long-range enhancer regulation in vitro nor sufficient without the addition of HMG I/Y. Thus, the modulation of DNA structure by HMG I/Y is a critical regulator of long-range enhancer function on both DNA and chromatin-assembled genes. Electron microscopic analysis reveals that HMG I/Y binds cooperatively to preferred DNA sites to generate distinct looped structures in the presence or absence of the beta-globin enhancer. The formation of DNA topologies that enable distal enhancers to strongly regulate gene expression is an intrinsic property of HMG I/Y and naked DNA.
Figures


Similar articles
-
The role of HMG I(Y) in the assembly and function of the IFN-beta enhanceosome.EMBO J. 1999 Jun 1;18(11):3074-89. doi: 10.1093/emboj/18.11.3074. EMBO J. 1999. PMID: 10357819 Free PMC article.
-
An HMG I/Y-containing repressor complex and supercoiled DNA topology are critical for long-range enhancer-dependent transcription in vitro.Genes Dev. 1997 Mar 1;11(5):629-39. doi: 10.1101/gad.11.5.629. Genes Dev. 1997. PMID: 9119227
-
PU.1-mediated transcription is enhanced by HMG-I(Y)-dependent structural mechanisms.J Biol Chem. 2001 Mar 23;276(12):9550-7. doi: 10.1074/jbc.M008726200. Epub 2000 Dec 20. J Biol Chem. 2001. PMID: 11124259
-
Minor groove-binding architectural proteins: structure, function, and DNA recognition.Annu Rev Biophys Biomol Struct. 1998;27:105-31. doi: 10.1146/annurev.biophys.27.1.105. Annu Rev Biophys Biomol Struct. 1998. PMID: 9646864 Free PMC article. Review.
-
HMGI/Y proteins: flexible regulators of transcription and chromatin structure.Biochim Biophys Acta. 2001 May 28;1519(1-2):13-29. doi: 10.1016/s0167-4781(01)00215-9. Biochim Biophys Acta. 2001. PMID: 11406267 Review.
Cited by
-
Optimal transactivation by Epstein-Barr nuclear antigen 1 requires the UR1 and ATH1 domains.J Virol. 2009 May;83(9):4227-35. doi: 10.1128/JVI.02578-08. Epub 2009 Feb 25. J Virol. 2009. PMID: 19244333 Free PMC article.
-
Core promoter-selective function of HMGA1 and Mediator in Initiator-dependent transcription.Genes Dev. 2011 Dec 1;25(23):2513-24. doi: 10.1101/gad.177360.111. Genes Dev. 2011. PMID: 22156211 Free PMC article.
-
HMGA2 directly mediates chromatin condensation in association with neuronal fate regulation.Nat Commun. 2023 Oct 12;14(1):6420. doi: 10.1038/s41467-023-42094-9. Nat Commun. 2023. PMID: 37828010 Free PMC article.
-
Distant activation of transcription: mechanisms of enhancer action.Mol Cell Biol. 2012 Dec;32(24):4892-7. doi: 10.1128/MCB.01127-12. Epub 2012 Oct 8. Mol Cell Biol. 2012. PMID: 23045397 Free PMC article. Review.
-
Sox6 directly silences epsilon globin expression in definitive erythropoiesis.PLoS Genet. 2006 Feb;2(2):e14. doi: 10.1371/journal.pgen.0020014. Epub 2006 Feb 3. PLoS Genet. 2006. PMID: 16462943 Free PMC article.
References
-
- Blackwood E.M. and Kadonaga,J.T. (1998) Science, 281, 61–63. - PubMed
-
- Ptashne M. (1986) Nature, 322, 697–701. - PubMed
-
- Wang J.C. and Giaever,G.N. (1988) Science, 240, 300–304. - PubMed
-
- Rippe K., von Hippel,P.H. and Langowski,J. (1995) Trends Biochem. Sci., 20, 500–506. - PubMed
-
- Barton M.C. and Emerson,B.M. (1994) Genes Dev., 8, 2453–2465. - PubMed
Publication types
MeSH terms
Substances
Grants and funding
LinkOut - more resources
Full Text Sources
Other Literature Sources
Molecular Biology Databases
