Expression profiling reveals distinct sets of genes altered during induction and regression of cardiac hypertrophy
- PMID: 10829065
- PMCID: PMC18725
- DOI: 10.1073/pnas.100127897
Expression profiling reveals distinct sets of genes altered during induction and regression of cardiac hypertrophy
Abstract
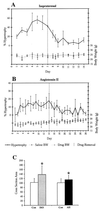
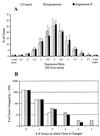
Although cardiac hypertrophy has been the subject of intensive investigation, regression of hypertrophy has been significantly less studied, precluding large-scale analysis of the relationship between these processes. In the present study, using pharmacological models of cardiac hypertrophy in mice, expression profiling was performed with fragments of more than 4,000 genes to characterize and contrast expression changes during induction and regression of hypertrophy. Administration of angiotensin II and isoproterenol by osmotic minipump produced increases in heart weight (15 and 45%, respectively) that returned to preinduction size after drug withdrawal. From multiple expression analyses of left ventricular RNA isolated at daily time-points during cardiac hypertrophy and regression, we identified sets of genes whose expression was altered at specific stages of this process. While confirming the participation of 25 genes or pathways previously shown to be altered by hypertrophy, a larger set of 30 genes was identified whose expression had not previously been associated with cardiac hypertrophy or regression. Of the 55 genes that showed reproducible changes during the time course of induction and regression, 32 genes were altered only during induction, and 8 were altered only during regression. This study identified both known and novel genes whose expression is affected at different stages of cardiac hypertrophy and regression and demonstrates that cardiac remodeling during regression utilizes a set of genes that are distinct from those used during induction of hypertrophy.
Figures


Similar articles
-
Transcriptional profile of isoproterenol-induced cardiomyopathy and comparison to exercise-induced cardiac hypertrophy and human cardiac failure.BMC Physiol. 2009 Dec 9;9:23. doi: 10.1186/1472-6793-9-23. BMC Physiol. 2009. PMID: 20003209 Free PMC article.
-
Angiotensin II maintains, but does not mediate, isoproterenol-induced cardiac hypertrophy in rats.Am J Physiol. 1994 Oct;267(4 Pt 2):H1496-506. doi: 10.1152/ajpheart.1994.267.4.H1496. Am J Physiol. 1994. PMID: 7524366
-
Microarray analysis of Akt1 activation in transgenic mouse hearts reveals transcript expression profiles associated with compensatory hypertrophy and failure.Physiol Genomics. 2006 Oct 11;27(2):156-70. doi: 10.1152/physiolgenomics.00234.2005. Epub 2006 Aug 1. Physiol Genomics. 2006. PMID: 16882883
-
Myoglobin-deficient mice activate a distinct cardiac gene expression program in response to isoproterenol-induced hypertrophy.Physiol Genomics. 2010 Apr 1;41(2):137-45. doi: 10.1152/physiolgenomics.90297.2008. Epub 2010 Feb 9. Physiol Genomics. 2010. PMID: 20145201
-
Isoproterenol-induced cardiac hypertrophy: role of circulatory versus cardiac renin-angiotensin system.Am J Physiol Heart Circ Physiol. 2001 Dec;281(6):H2410-6. doi: 10.1152/ajpheart.2001.281.6.H2410. Am J Physiol Heart Circ Physiol. 2001. PMID: 11709406
Cited by
-
Pressure-independent enhancement of cardiac hypertrophy in natriuretic peptide receptor A-deficient mice.J Clin Invest. 2001 Apr;107(8):975-84. doi: 10.1172/JCI11273. J Clin Invest. 2001. PMID: 11306601 Free PMC article.
-
Calcific Aortic Valve Disease: Part 2-Morphomechanical Abnormalities, Gene Reexpression, and Gender Effects on Ventricular Hypertrophy and Its Reversibility.J Cardiovasc Transl Res. 2016 Aug;9(4):374-99. doi: 10.1007/s12265-016-9695-z. Epub 2016 May 16. J Cardiovasc Transl Res. 2016. PMID: 27184804 Free PMC article. Review.
-
Microarray analysis of changes in gene expression in a murine model of chronic chagasic cardiomyopathy.Parasitol Res. 2003 Oct;91(3):187-96. doi: 10.1007/s00436-003-0937-z. Epub 2003 Aug 9. Parasitol Res. 2003. PMID: 12910413
-
Functional annotation of mouse mutations in embryonic stem cells by use of expression profiling.Mamm Genome. 2004 Jan;15(1):1-13. doi: 10.1007/s00335-002-2228-x. Mamm Genome. 2004. PMID: 14727137
-
GTI: a novel algorithm for identifying outlier gene expression profiles from integrated microarray datasets.PLoS One. 2011 Feb 18;6(2):e17259. doi: 10.1371/journal.pone.0017259. PLoS One. 2011. PMID: 21365010 Free PMC article.
References
-
- Agabiti-Rosei E, Muiesan M L. Adv Exp Med Biol. 1997;432:199–205. - PubMed
-
- Schmieder A. J Am Med Assoc. 1996;275:1507–1513. - PubMed
-
- Chien K R, Knowlton K U, Zhu H, Chien S. FASEB J. 1991;5:3037–3046. - PubMed
-
- Zimmer H G. J Mol Med. 1997;75:849–859. - PubMed
-
- Lijnen P, Petrov V. Methods Find Exp Clin Pharmacol. 1999;21:363–374. - PubMed
Publication types
MeSH terms
Substances
Grants and funding
LinkOut - more resources
Full Text Sources
Other Literature Sources

