

Activation of group II metabotropic glutamate receptors inhibits synaptic excitation of the substantia Nigra pars reticulata
- PMID: 10777772
- PMCID: PMC6773118
- DOI: 10.1523/JNEUROSCI.20-09-03085.2000
Activation of group II metabotropic glutamate receptors inhibits synaptic excitation of the substantia Nigra pars reticulata
Abstract
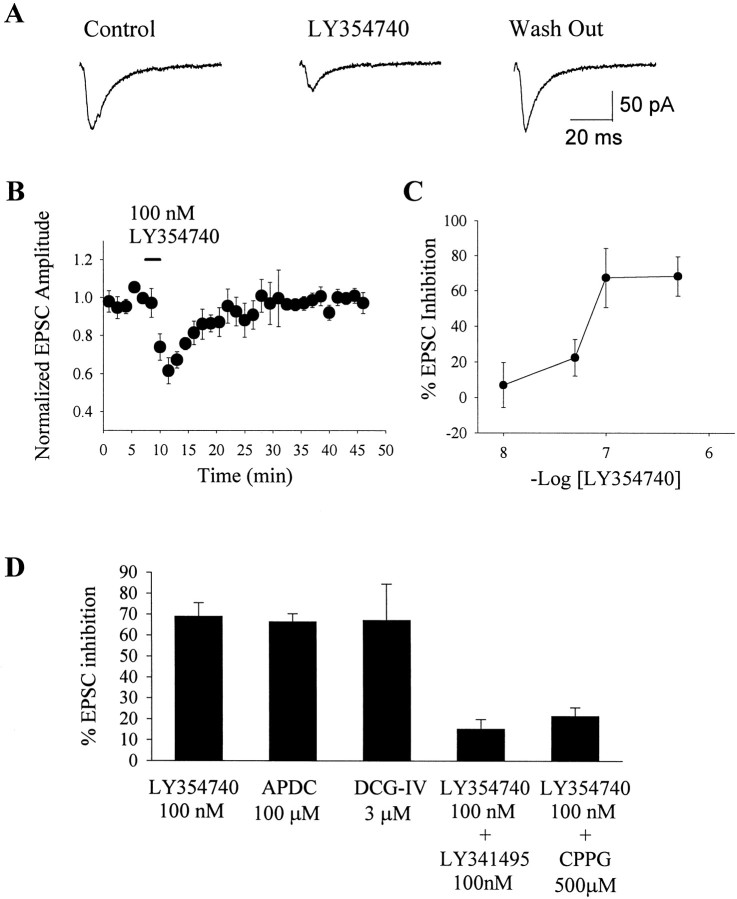
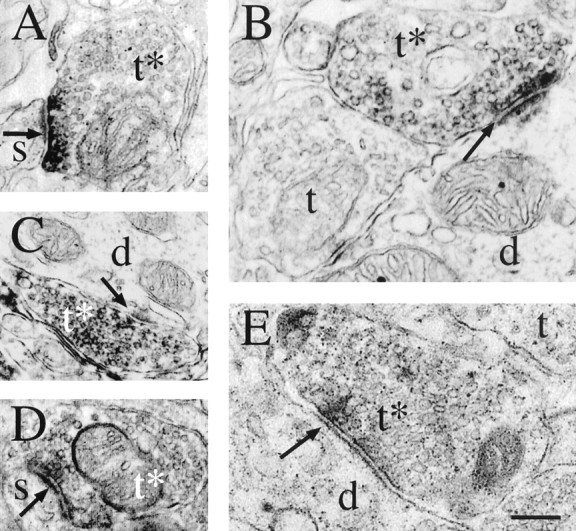
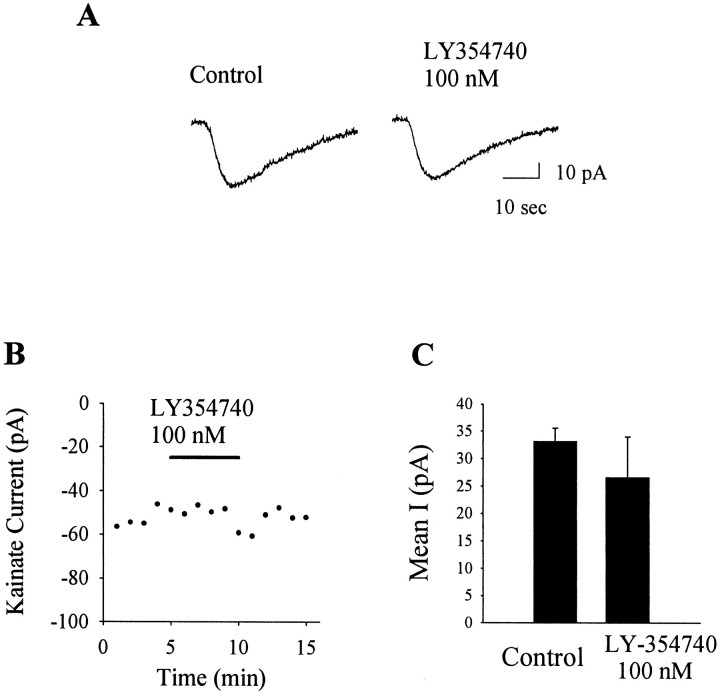
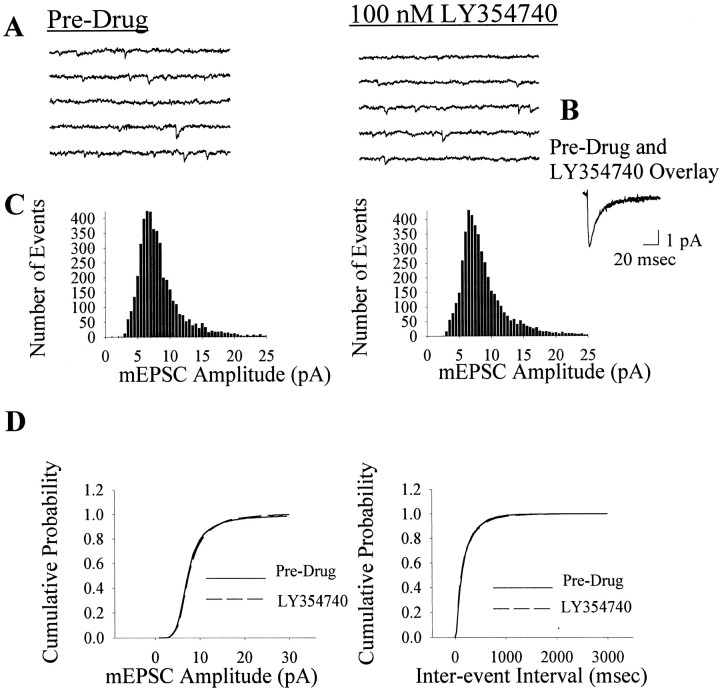
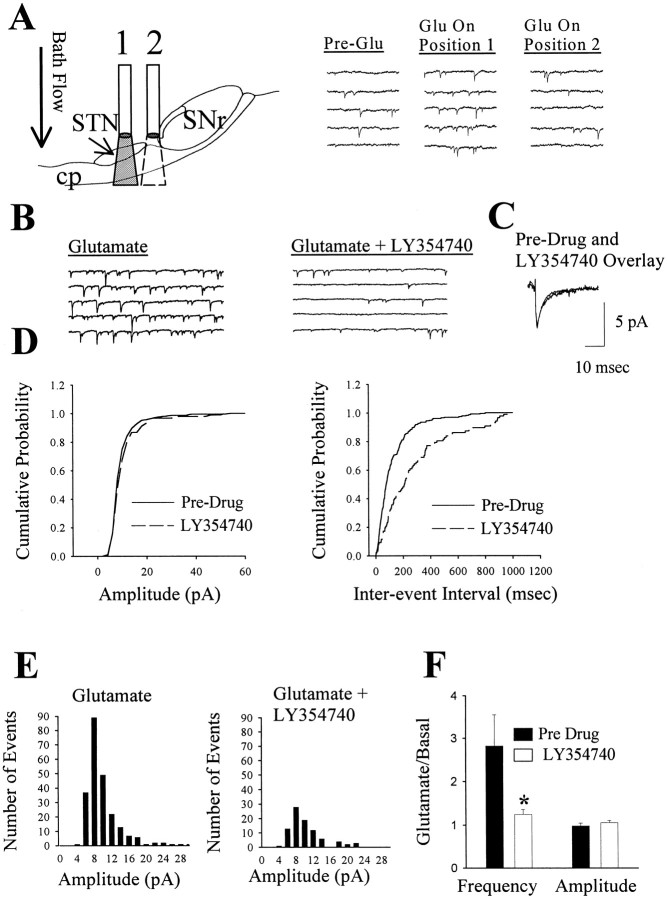
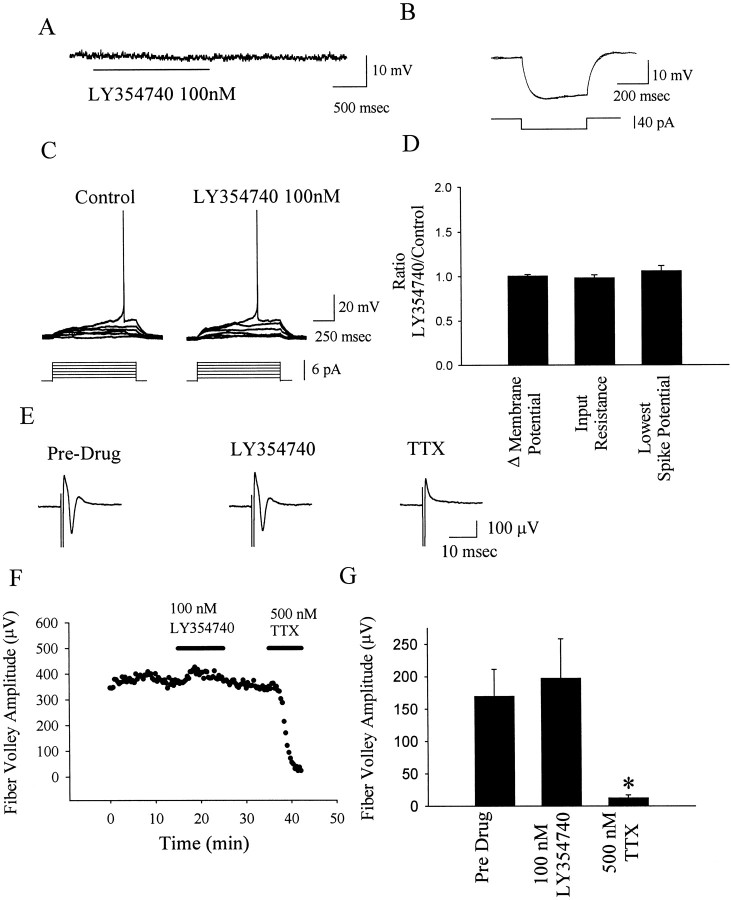
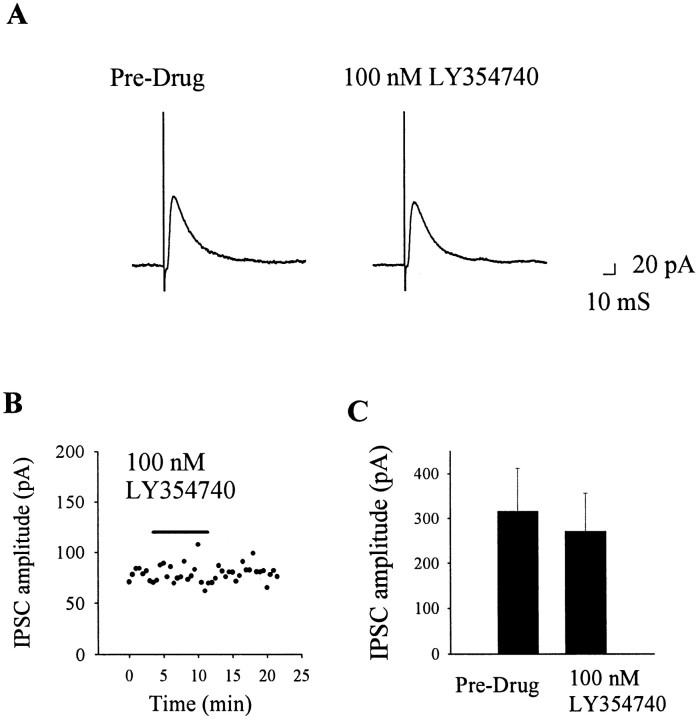
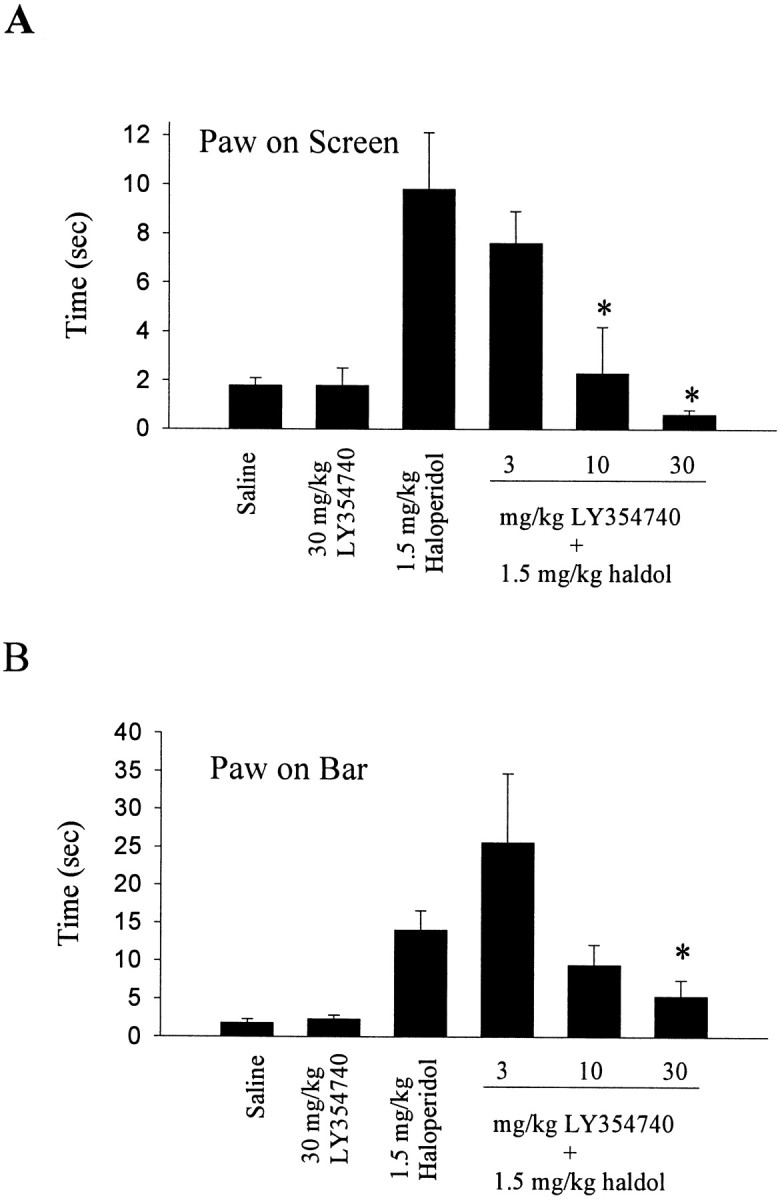
Loss of nigrostriatal dopaminergic neurons in Parkinson's disease (PD) leads to increased activity of glutamatergic neurons in the subthalamic nucleus (STN). Recent studies reveal that the resultant increase in STN-induced excitation of basal ganglia output nuclei is responsible for the disabling motor impairment characteristic of PD. On the basis of this, it is possible that any manipulation that reduces activity at excitatory STN synapses onto basal ganglia output nuclei could be useful in the treatment of PD. We now report that group II metabotropic glutamate receptors (mGluRs) are presynaptically localized on STN terminals and that activation of these receptors inhibits excitatory transmission at STN synapses. In agreement with the hypothesis that this could provide a therapeutic benefit in PD, a selective agonist of group II mGluRs induces a dramatic reversal of catalepsy in a rat model of PD. These results raise the exciting possibility that selective agonists of group II mGluRs could provide an entirely new approach to the treatment of PD. These novel therapeutic agents would provide a noninvasive pharmacological treatment that does not involve the manipulation of dopaminergic systems, thus avoiding the problems associated with current therapies.
Figures
Similar articles
-
Activation of group III mGluRs inhibits GABAergic and glutamatergic transmission in the substantia nigra pars reticulata.J Neurophysiol. 2001 May;85(5):1960-8. doi: 10.1152/jn.2001.85.5.1960. J Neurophysiol. 2001. PMID: 11353013
-
Activation of metabotropic glutamate receptor 1 inhibits glutamatergic transmission in the substantia nigra pars reticulata.Neuroscience. 2001;105(4):881-9. doi: 10.1016/s0306-4522(01)00254-8. Neuroscience. 2001. PMID: 11530226
-
Dopamine modulates the function of group II and group III metabotropic glutamate receptors in the substantia nigra pars reticulata.J Pharmacol Exp Ther. 2002 Aug;302(2):433-41. doi: 10.1124/jpet.102.033266. J Pharmacol Exp Ther. 2002. PMID: 12130700
-
The role of striatal metabotropic glutamate receptors in degeneration of dopamine neurons: review article.Amino Acids. 2002;23(1-3):199-205. doi: 10.1007/s00726-001-0129-z. Amino Acids. 2002. PMID: 12373538 Review.
-
Group III and subtype 4 metabotropic glutamate receptor agonists: discovery and pathophysiological applications in Parkinson's disease.Neuropharmacology. 2013 Mar;66:53-64. doi: 10.1016/j.neuropharm.2012.05.026. Epub 2012 Jun 1. Neuropharmacology. 2013. PMID: 22664304 Review.
Cited by
-
Subthalamic stimulation evokes complex EPSCs in the rat substantia nigra pars reticulata in vitro.J Physiol. 2006 Jun 15;573(Pt 3):697-709. doi: 10.1113/jphysiol.2006.110031. Epub 2006 Apr 13. J Physiol. 2006. PMID: 16613871 Free PMC article.
-
LY354740 Reduces Extracellular Glutamate Concentration, Inhibits Phosphorylation of Fyn/NMDARs, and Expression of PLK2/pS129 α-Synuclein in Mice Treated With Acute or Sub-Acute MPTP.Front Pharmacol. 2020 Feb 28;11:183. doi: 10.3389/fphar.2020.00183. eCollection 2020. Front Pharmacol. 2020. PMID: 32180729 Free PMC article.
-
Metabotropic glutamate receptors as targets for multipotential treatment of neurological disorders.Neurotherapeutics. 2009 Jan;6(1):94-107. doi: 10.1016/j.nurt.2008.10.038. Neurotherapeutics. 2009. PMID: 19110202 Free PMC article. Review.
-
The Role of Group II Metabotropic Glutamate Receptors in the Striatum in Electroacupuncture Treatment of Parkinsonian Rats.CNS Neurosci Ther. 2017 Jan;23(1):23-32. doi: 10.1111/cns.12587. Epub 2016 Jul 14. CNS Neurosci Ther. 2017. PMID: 27412260 Free PMC article.
-
Glutamate Receptor Dysregulation and Platelet Glutamate Dynamics in Alzheimer's and Parkinson's Diseases: Insights into Current Medications.Biomolecules. 2023 Nov 3;13(11):1609. doi: 10.3390/biom13111609. Biomolecules. 2023. PMID: 38002291 Free PMC article. Review.
References
-
- Albin RL, Greenamyre JT. Alternative excitotoxic hypotheses. Neurology. 1992;42:733–738. - PubMed
-
- Baron MS, Vitek JL, Bakay RA, Green J, Kaneoke Y, Hashimoto T, Turner RS, Woodard JL, Cole SA, McDonald WM, DeLong MR. Treatment of advanced Parkinson's disease by posterior GPi pallidotomy: 1-year results of a pilot study. Ann Neurol. 1996;40:355–366. - PubMed
-
- Bevan MD, Bolam JP, Crossman AR. Convergent synaptic input from the neostriatum and the subthalamus onto identified nigrothalamic neurons in the rat. Eur J Neurosci. 1994;6:320–334. - PubMed
-
- Charara A, Smith Y, Parent A. Glutamatergic inputs from the pedunculopontine nucleus to midbrain dopaminergic neurons in primates: Phaseolus vulgaris-leucoagglutinin anterograde labeling combined with postembedding glutamate and GABA immunohistochemistry. J Comp Neurol. 1996;364:254–266. - PubMed
Publication types
MeSH terms
Substances
LinkOut - more resources
Full Text Sources
Other Literature Sources
Miscellaneous