. 2000 Apr;11(4):1433-43.
doi: 10.1091/mbc.11.4.1433.

Calreticulin couples calcium release and calcium influx in integrin-mediated calcium signaling

Affiliations
Free PMC article

Calreticulin couples calcium release and calcium influx in integrin-mediated calcium signaling

M S Kwon et al. Mol Biol Cell. 2000 Apr.
Free PMC article

Abstract

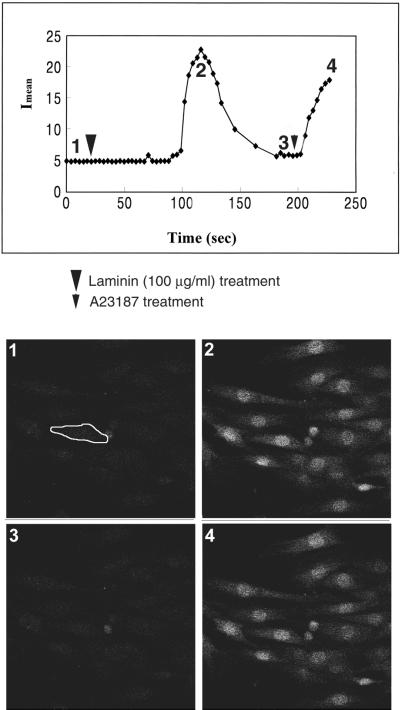
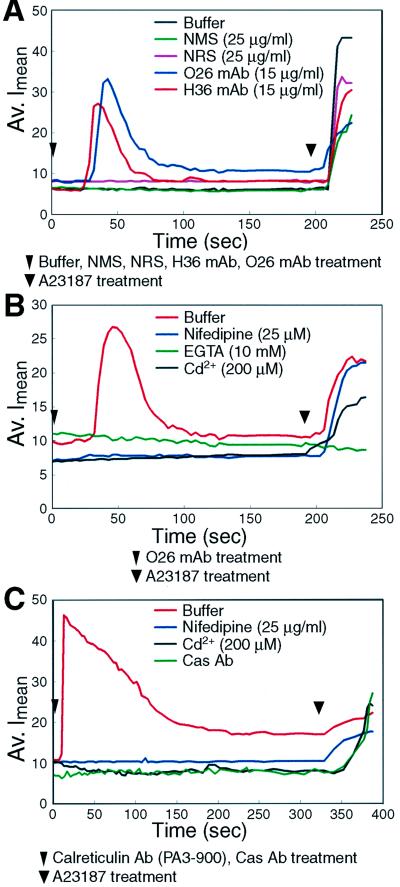
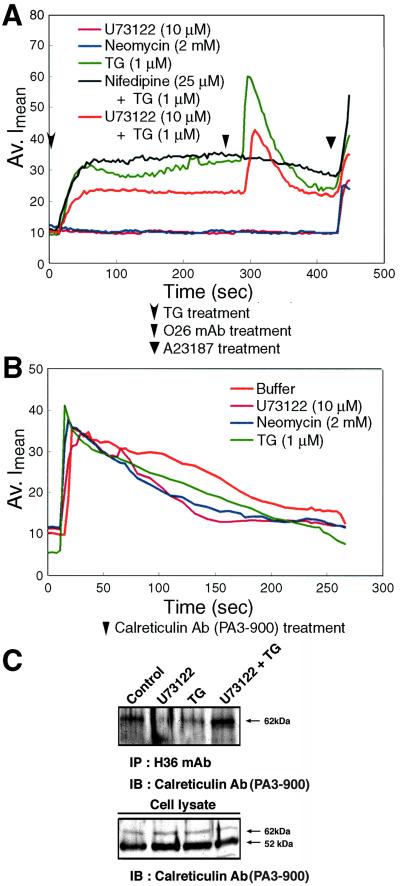
The engagement of integrin alpha7 in E63 skeletal muscle cells by laminin or anti-alpha7 antibodies triggered transient elevations in the intracellular free Ca(2+) concentration that resulted from both inositol triphosphate-evoked Ca(2+) release from intracellular stores and extracellular Ca(2+) influx through voltage-gated, L-type Ca(2+) channels. The extracellular domain of integrin alpha7 was found to associate with both ectocalreticulin and dihydropyridine receptor on the cell surface. Calreticulin appears to also associate with cytoplasmic domain of integrin alpha7 in a manner highly dependent on the cytosolic Ca(2+) concentration. It appeared that intracellular Ca(2+) release was a prerequisite for Ca(2+) influx and that calreticulin associated with the integrin cytoplasmic domain mediated the coupling of between the Ca(2+) release and Ca(2+) influx. These findings suggest that calreticulin serves as a cytosolic activator of integrin and a signal transducer between integrins and Ca(2+) channels on the cell surface.


Figures

Figure 1
Figure 1
Measurement of fluorescence intensity in the selected single-cell area using confocal microscope. Cells preloaded with fluo-3/AM were treated with laminin (100 μg/ml), and the fluorescence intensity was measured every 3 s in the selected area using a confocal microscope (n = 21; SD, ±1.94 ∼ 3.66). (1) A resting cell before laminin treatment elicits the basal level of fluorescence intensity. (2) The selected cell elicits the maximum fluorescence intensity after laminin treatment. (3) Fluorescence intensity drops down to the basal level at 90 s after laminin treatment. (4) Fluorescence intensity is increased by ionophore A23187 treatment, indicating that the cell is viable. n, cell number; SD, SD of Av. Imean.
Figure 2
Figure 2
Elevation of [Ca2+]i elicited by integrin α7 mAbs in E63 cells. (A) Transient elevations in [Ca2+]i elicited by H36 mAb (red; n = 21; SD, ±0.76 ∼ 4.02) and O26 mAb (blue; n = 56; SD, ±0.43 ∼ 2.74) in 5-d-old E63 cells. Exposure to buffer (black; n = 21; SD, ±0.42 ∼ 3.02), NMS (green; n = 21; SD, ±1.14 ∼ 3.53), or NRS (pink; n = 28; SD, ±0.59 ∼ 3.63) had no effect on [Ca2+]i. (B) Cells were preincubated for 5 min in either normal bath solution (red; n = 56; SD, ±1.07 ∼ 3.04) or bath solution containing 25 μM nifedipine (blue; n = 48; SD, ±0.40 ∼ 2.04), 10 mM EGTA (green; n = 28;SD, ±0.83 ∼ 1.32), or 200 μM Cd2+ (black; n = 28; SD, ±0.51 ∼ 1.81). After preincubation, cells were treated with O26 mAb (15 μg/ml), and the change of [Ca2+]i was measured. (C) Elevations in [Ca2+]i elicited by treatment with calreticulin polyclonal Ab. After preincubation for 5 min in either bath solution (red; n = 40; SD, ±1.13 ∼ 6.46) or bath solution containing 25 μM nifedipine (blue; n = 28; SD, ±1.83 ∼ 5.19) or 200 μM Cd2+ (black; n = 28; SD, ±0.93 ∼ 2.76), cells were exposed to calreticulin Ab (PA3-900). Crk-associated substrate (Cas) polyclonal Ab, a nonspecific Ab, did not elicit [Ca2+]i. The values shown are averages of fluorescence intensity obtained from at least 20 single cells in at least five independent experiments conducted under the same experimental conditions. n, cell number; SD, SD of Av. Imean.
Figure 3
Figure 3
Association of integrin α7 with ectocalreticulin and DHPR α1 subunit in E63 cells. (A) The unfixed E63 cells (5 d old) were first immunostained with calreticulin Ab (PA3-900) and then stained with integrin α7 Ab (O26 mAb) again. Ectocalreticulin was diffusely distributed on the cell surface (a), whereas integrin α7 displayed a stress fiber-like distribution (b). In contrast, prior incubation of integrin α7 Ab (c–h) before staining of calreticulin Ab (PA3-900 [c and g] or LAR090 [e]) induced cellular localization of ectocalreticulin (c, e, and g), in which ectocalreticulin appears to be colocalized with integrin α7 (d, f, and h). In control experiments, cells were first stained with normal mouse immunoglobulin and then stained with normal rabbit immunoglobulin (i and j). Cells shown in the left panels (a, c, e, g, and i) were stained with TRITC-conjugated donkey anti-rabbit immunoglobulin, whereas those in the right panels (b, d, f, h, and j) were stained with FITC-conjugated donkey anti-mouse immunoglobulin. Bars: in f (for a–f, i, and j), 10 μm; in h (for g and j), 5 μm. (B) Cell surface proteins in 5-d cultured cells were iodinated with Na125I and immunoprecipitated with calreticulin Ab (PA3-900). Autoradiography of cell surface proteins (a) and imunoblot analysis (b) of cell lysates with calreticulin Ab (PA3-900) are presented. Iodinated ectocalreticulin is indicated by 125I-CRT. (C) Cell lysates were immunoprecipitated (IP) using integrin α7 Ab (H36 mAb) and DHPR α1 Ab and then immunoblotted (IB) with calreticulin Ab: PA3-900 (left panel) and LAR090 (right panel). (D) After stripping, the same membrane was reprobed with DHPR α1 Ab. Note that integrin α7 was associated with both calreticulin and DHPR α1.
Figure 4
Figure 4
Effect of PLC inhibitors on integrin α7-mediated Ca2+ signaling. (A) Pretreatment with 10 μM U73122 (pink; n = 35; SD, ±1.85 ∼ 2.11) or 2 mM neomycin (blue; n = 35; SD, ±0.17 ∼ 1.68) completely blocked α7-mediated [Ca2+]i transient. Addition of 1 μM TG (green; n = 42; SD, ±0.76 ∼ 4.37) elicited the characteristic [Ca2+]i plateau because of the calcium release from internal calcium stores and restored Ca2+ transients even in U73122-pretreated cells (red; n = 28; SD, ±1.32 ∼ 4.74), but not in nifedipine-pretreated cells (black; n = 28; SD, ±1.83 ∼ 5.49). (B) Pretreating cells for 5 min with bath solution alone (red; n = 35; SD, ±0.71 ∼ 3.29) or bath solutioncontaining 10 μM U73122 (pink; n = 35; SD, ±1.37 ∼ 5.02), 2 mM neomycin (blue; n = 35; SD, ±1.80 ∼ 4.23), or 1 μM TG (green; n = 35; SD, ±1.29 ∼ 4.63) did not inhibit calreticulin-mediated Ca2+ transients. (C) Cells were exposed to U73122 for 5 min in the absence or presence of TG, followed by exposure to integrin α7 Ab (H36 mAb) for 5 min. The lysate was immunoprecipitated (IP) with H36 mAb and then immunoblotted (IB) with calreticulin Ab (PA3-900). Note that the association of integrin α7 with calreticulin was highly dependent on increased cytosolic Ca2+. n, cell number; SD, SD of Av. Imean.
Figure 5
Figure 5
Inhibition of integrin α7-mediated Ca2+ signaling by KLGFFKR peptide. (A) E63 cells were transiently permeabilized in the absence (b, g, and l) or presence of 25 μg/ml (c, h, and m), 50 μg/ml (d, i, and n), or 75 μg/ml (e, j, and o) KLGFFKR peptide or, as a control, 75 μg/ml (a, f, and k) of KLRFGFK (scrambled peptide). The top row (a–e) was obtained before O26 mAb (15 μg/ml) treatment; the middle row (f–j) shows the elevated [Ca2+]i within 40 s after exposure to O26 mAb; and the bottom row (k–o) was obtained within 10 s after exposing cells to the Ca2+ ionophore A23187 as a positive control. (B) Five-day cultured cells were permeabilized and treated with FITC-KLGFFKR peptides or with KLGFFKR peptides. The supernatant of lysates was applied to an FL-600 microplate fluorometer equipped with a standard filter set for FITC (excitation, 485 nm; emission, 538 nm) for fluorometric analysis. For quantification of fluorescence intensity, natural fluorescence (autofluorescence) by cell lysates was subtracted from the fluorescence intensity of FITC-KLGFFKR peptides. This experiment was repeated at least five times. (C) Cell lysates were immunoprecipitated (IP) with integrin α7 Ab (H36 mAb) in the absence or presence of 75 μg/ml KLGFFKR or 75 μg/ml KLRFGFK and immunoblotted (IB) with calreticulin Ab (PA3-900). Note that the integrin–calreticulin interaction was partially blocked by the KLGFFKR peptide.

Similar articles

Cited by

References

    1. Albelda SM, Buck CA. Integrins and other cell adhesion molecules. FASEB J. 1990;4:2868–2880. - PubMed
    1. Baksh S, Michalak M. Expression of calreticulin in Escherichia coli and identification of its Ca2+ binding domains. J Biol Chem. 1991;266:21458–21465. - PubMed
    1. Bastianutto C, Clementi E, Codazzi F, Podini P, De Giorgi F, Rizzuto R, Meldolesi J, Pozzan T. Overexpression of calreticulin increases the Ca2+ capacity of rapidly exchanging Ca2+ stores and reveals aspects of their lumenal microenvironment and function. J Cell Biol. 1995;130:847–855. - PMC - PubMed
    1. Boudreau N, Sympson CJ, Werb Z, Bissell MJ. Suppression of ICE and apoptosis in mammary epithelial cells by extracellular matrix. Science. 1995;267:891–893. - PMC - PubMed
    1. Bouvard D, Molla A, Block MR. Calcium/calmodulin-dependent protein kinase II controls α5β1 integrin-mediated inside-out signaling. J Cell Sci. 1998;111:657–665. - PubMed

Publication types

MeSH terms