. 2000 Apr;115(4):519-32.
doi: 10.1085/jgp.115.4.519.

Functional coupling of Ca(2+) channels to ryanodine receptors at presynaptic terminals. Amplification of exocytosis and plasticity

Affiliations

Functional coupling of Ca(2+) channels to ryanodine receptors at presynaptic terminals. Amplification of exocytosis and plasticity

K Narita et al. J Gen Physiol. 2000 Apr.

Abstract

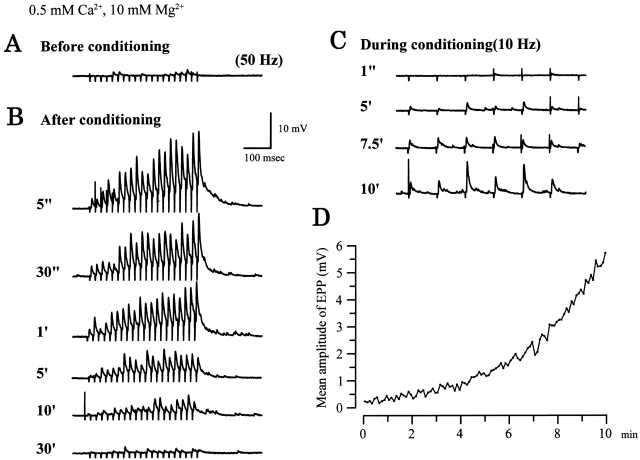
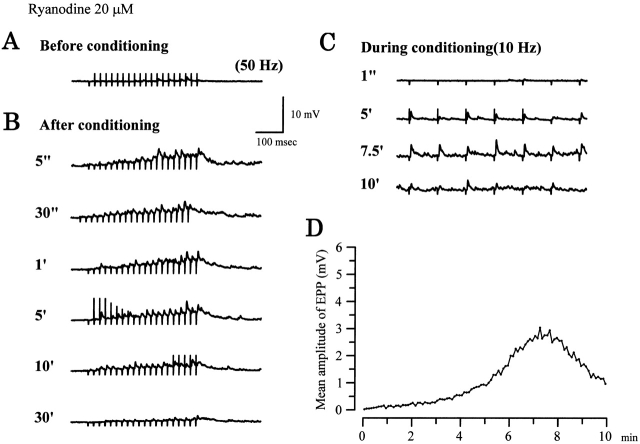
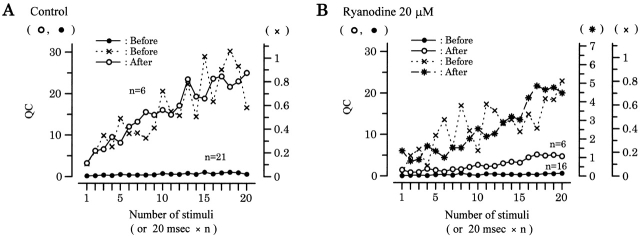
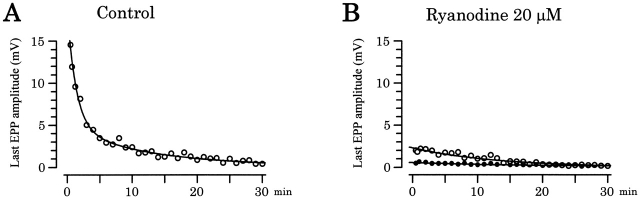
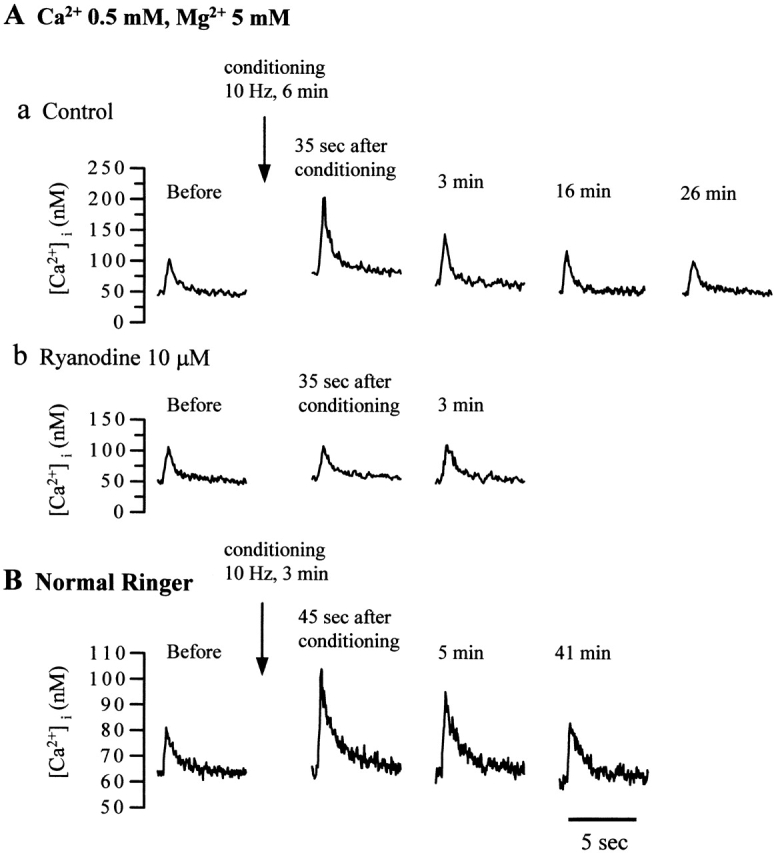
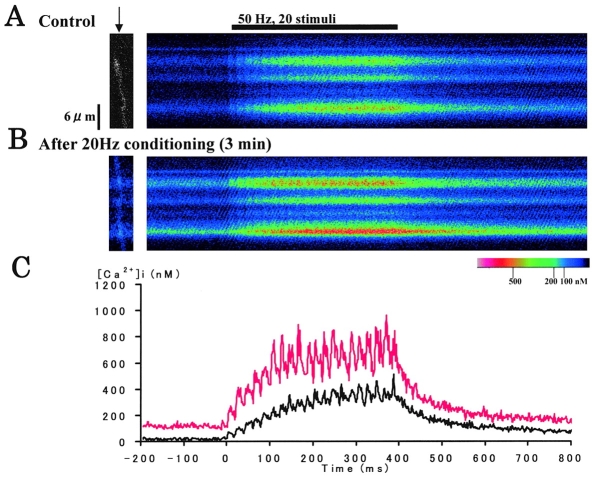
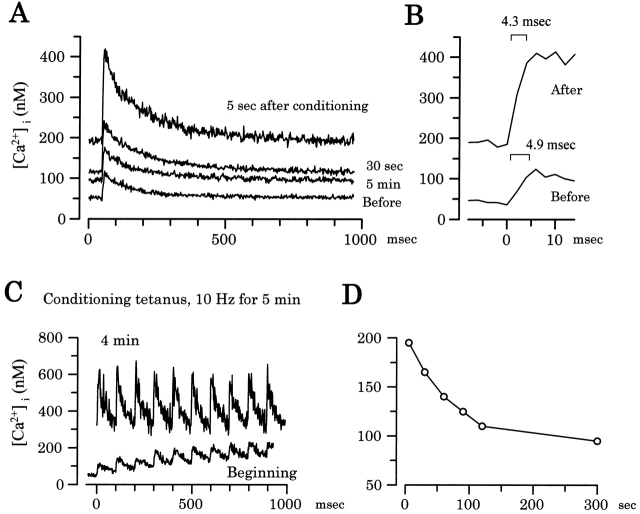
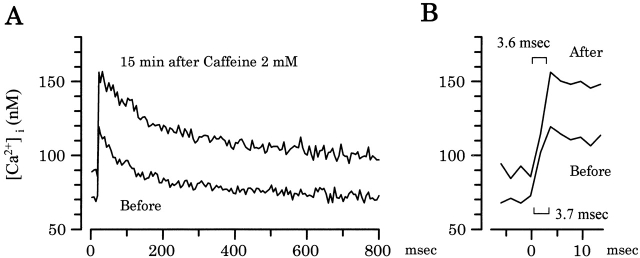
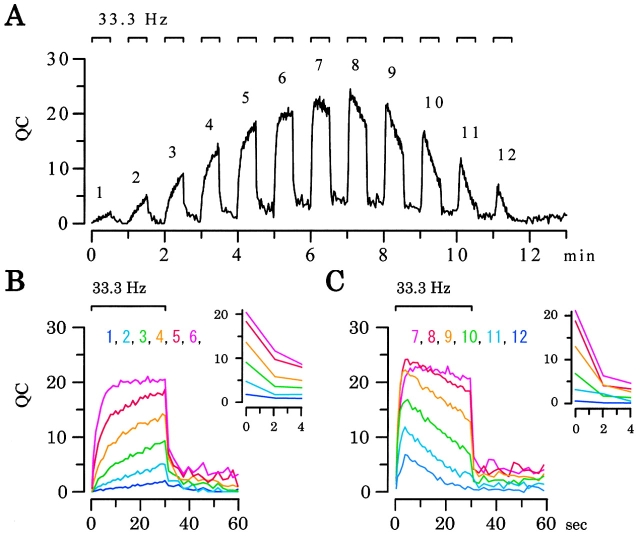
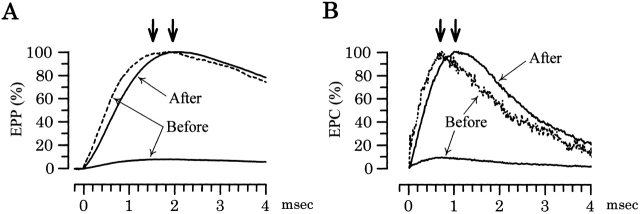
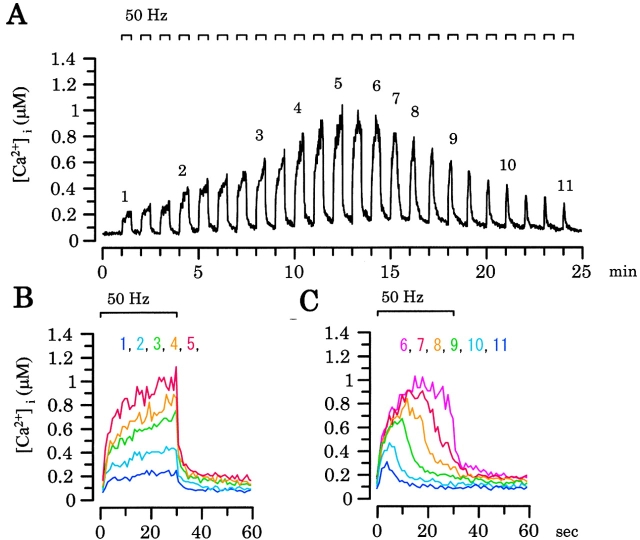
Ca(2+)-induced Ca(2+) release (CICR) enhances a variety of cellular Ca(2+) signaling and functions. How CICR affects impulse-evoked transmitter release is unknown. At frog motor nerve terminals, repetitive Ca(2+) entries slowly prime and subsequently activate the mechanism of CICR via ryanodine receptors and asynchronous exocytosis of transmitters. Further Ca(2+) entry inactivates the CICR mechanism and the absence of Ca(2+) entry for >1 min results in its slow depriming. We now report here that the activation of this unique CICR markedly enhances impulse-evoked exocytosis of transmitter. The conditioning nerve stimulation (10-20 Hz, 2-10 min) that primes the CICR mechanism produced the marked enhancement of the amplitude and quantal content of end-plate potentials (EPPs) that decayed double exponentially with time constants of 1.85 and 10 min. The enhancement was blocked by inhibitors of ryanodine receptors and was accompanied by a slight prolongation of the peak times of EPP and the end-plate currents estimated from deconvolution of EPP. The conditioning nerve stimulation also enhanced single impulse- and tetanus-induced rises in intracellular Ca(2+) in the terminals with little change in time course. There was no change in the rate of growth of the amplitudes of EPPs in a short train after the conditioning stimulation. On the other hand, the augmentation and potentiation of EPP were enhanced, and then decreased in parallel with changes in intraterminal Ca(2+) during repetition of tetani. The results suggest that ryanodine receptors exist close to voltage-gated Ca(2+) channels in the presynaptic terminals and amplify the impulse-evoked exocytosis and its plasticity via CICR after Ca(2+)-dependent priming.


Figures

Figure 1
Figure 1
Enhancement of EPPs by a conditioning tetanus that primes the mechanism of CICR at the nerve terminal. (A) A train of EPPs induced by 20 stimuli at 50 Hz before a conditioning tetanus (10 Hz, 10 min) in a low Ca2+ (0.5 mM), high Mg2+ (10 mM) solution. (B) Trains of EPPs (20 stimuli, 50 Hz) induced at variable times after the conditioning tetanus. (C) Changes in EPPs during the conditioning tetanus. Sample records are those at 1 s, and 5, 7.5, and 10 min after the beginning of the tetanus. (D) The time course of changes in EPP amplitude during the conditioning tetanus. Each point represents the mean of 60 EPPs recorded for a period of 6 s.
Figure 2
Figure 2
Effects of ryanodine on EPPs during a conditioning tetanus and the enhancement of the amplitudes of EPPs produced by the conditioning tetanus. All the records were taken after superfusion with a low Ca2+ (0.5 mM), high Mg2+ (10 mM) solution containing ryanodine (20 μM) for 60 min. Explanations are identical for those in Fig. 1.
Figure 3
Figure 3
The rates of growth of QC of EPPs during a short train before and after a conditioning tetanus. All data were obtained from the experiments shown in Fig. 1 and Fig. 2. (A and B) The rate of increases in QC of each of 20 EPPs (50 Hz) before and after the conditioning tetanus (10 Hz, 10 min). (• and ○) QCs of EPPs before and after the conditioning tetanus, respectively, in the absence (A) and presence (B) of ryanodine (20 μM). (× and *) QCs of EPPs before (×) and after (*, only for those in B) the conditioning tetanus replotted in enlarged scales of the right ordinates to compare their relative changes during a short train. Each symbol represents the QC of nth averaged EPP in each train (the number of trains is shown in the graphs), which was calculated by dividing the mean of EPPs by the mean amplitude of miniature EPPs.
Figure 4
Figure 4
The decay time course of the enhancement of EPP amplitude after the conditioning tetanus in the absence and presence of ryanodine. (A) The decay time courses of the enhanced EPP in a train after the conditioning tetanus (10 Hz, 10 min). The averaged amplitudes of the last EPPs in trains recorded after the conditioning tetanus were plotted against the time after the end of tetanus. The time course was fitted by the equation, EPP = 9.5exp(−t/1.4) + 4.5exp(−t/12.0) (mV/min). (B) The decay time courses of the enhanced EPPs in a train after the conditioning tetanus in the presence of ryanodine (20 μM). (○) The decay of EPPs recorded after the first conditioning tetanus at 30 min after the application of ryanodine; (•) the decay of EPPs after the second tetanus applied at 130 min. The time courses shown by ○ and • were fitted by the equations, EPP = 2.24exp(−t/12.8) and EPP = 0.44exp(−t/15.9), respectively.
Figure 5
Figure 5
Enhancement of a test tetanus-induced rise in [Ca2+]i after the conditioning tetanus and the blockade by ryanodine. (A) Enhancement of a test tetanus-induced rise in [Ca2+]i (50 Hz, 20 pulses) after the conditioning tetanus (10 Hz, 6 min) and its blockade by ryanodine (10 μM) in a low Ca2+, high Mg2+ solution. Ryanodine was applied for 30 min. (B) Enhancement of a test tetanus-induced rise in [Ca2+]i (50 Hz, 10 pulses) after the conditioning tetanus (10 Hz, 3 min) in normal Ringer solution. Test tetanus-induced rises in [Ca2+]i were recorded by measuring changes in dOGB-1 fluorescence with an intensified CCD camera.
Figure 6
Figure 6
Enhancement of tetanus-induced rises in [Ca2+]i in the nerve terminal after the priming of CICR by a conditioning tetanus. (A and B) Increases in [Ca2+]i in the nerve terminal induced by a train of 20 stimuli at 50 Hz (test tetanus) before and after the conditioning tetanus (20 Hz, 3 min). Fluorescent images (right) were obtained by line scanning the nerve terminal loaded with dOGB-1 along the long axis of the nerve terminal with a confocal microscope in normal Ringer (20 images were averaged). Small images in the left side are X-Y scanned images before stimulation, which are superimposed by a part of the line-scanned image to show the scanned line. The ratio of fluorescence intensity at each line to those before a train of stimuli applied in a period before the conditioning tetanus was taken. The time bases in A and B correspond to that of the graph in C. (C) The time course of increases in [Ca2+]i before, during, and after a test tetanus applied before or after the conditioning tetanus. Black and red lines are changes in [Ca2+]i before and after the conditioning tetanus, respectively.
Figure 7
Figure 7
Enhancement of single impulse-induced rises in [Ca2+]i by a conditioning tetanus. (A) Single impulse-induced rises in [Ca2+]i before and 5 s, 30 s, and 5 min after a conditioning tetanus (10 Hz, 5 min). Single impulse-induced rises in [Ca2+]i were recorded by line-scanning the terminal loaded with dOGB-1 with a confocal microscope in normal Ringer, and changes in the fluorescence of dOGB-1 were averaged over 3–5-μm width along each line and plotted against time. Each trace is the average of five records. (B) The initial phases of single impulse-induced rise in [Ca2+]i are expanded in time to show no change in the peak time after the conditioning tetanus. (C) Changes in [Ca2+]i produced by individual stimuli of the conditioning tetanus. Only those in the initial and the late (4 min) phases of stimuli are shown. (D) The decay time course of the increased basal [Ca2+]i after the conditioning tetanus.
Figure 8
Figure 8
Enhancement of single impulse-induced rises in [Ca2+]i by caffeine. Single impulse-induced rises in [Ca2+]i were recorded by line scanning the terminal loaded with dOGB-1 with a confocal microscope in normal Ringer's, and changes in the fluorescence of dOGB-1 were averaged over 3–5-μm width along each line and plotted against time. Each trace is the average of five records. The records are shown in two different time scales (A and B).
Figure 10
Figure 10
Changes in QC of EPPs induced by a high frequency tetanus during the course of priming and inactivation of the mechanism of CICR. (A) Changes in QC of EPPs induced by repetition of tetani in a low Ca2+ (0.5 mM), high Mg2+ (10 mM) solution. Combination of a high frequency tetanus (33.3 Hz, 30 s) and low frequency stimuli (0.5 Hz, 30 s) were repeated. QC averaged over those of 20 EPPs throughout all tetani is plotted. (B and C) Changes in QC during and after each high frequency tetani shown in A. Responses to each tetani during the waxing phase of QC are shown in an expanded time scale (B), while those during the waning phase are shown in (C). Insets are the early decay phases of the enhancement of QC after each tetani during the waxing (B) and waning (C) phases.
Figure 9
Figure 9
Changes in the time course of EPPs and EPCs after the conditioning tetanus. (A) EPPs before and after a conditioning tetanus. All EPPs in trains recorded before the tetanus were averaged, while the first EPPs in trains after the conditioning tetanus (10 Hz, 10 min) were averaged. The time courses of EPP recorded before the conditioning tetanus are shown in relative (continuous curves) and normalized (dotted curves) magnitudes to those after the tetanus. Arrows indicate the peak of EPP. (B) EPCs before and after a conditioning tetanus. The time course of EPC was calculated by the deconvolution of that of EPP (see materials and methods). Other explanations are the same as those in A.
Figure 11
Figure 11
Changes in rises of [Ca2+]i in response to a high frequency tetanus during the course of priming and inactivation of the mechanism of CICR. (A) Changes in the magnitude of a rise in [Ca2+]i induced by a high frequency tetanus during repetition of tetani in a low Ca2+ (0.5 mM), high Mg2+ (10 mM) solution. Combination of a high frequency tetanus (50 Hz, 30 s) and low frequency stimuli (0.5 Hz, 30 s) were repeated, and changes in [Ca2+]i were measured by recording changes in fluorescence of dOGB-1 loaded in the nerve terminal using an intensified CCD camera. (B and C) Changes in an increase in [Ca2+]i in response to each high frequency tetani shown in A. Responses to each tetani during the waxing phase of an increased [Ca2+]i are shown in an expanded time scale (B), while those during the waning phase are shown in C.

Similar articles

Cited by

References

    1. Chiou C.Y., Malagodi M.H. Studies on the mechanism of action of a new Ca2+ antagonist, 8-(N,N-diethylamino) octyl 3,4,5-trimethoxybenzoate hydrochloride in smooth and skeletal muscles. Brit. J. Pharmacol. 1975;53:279–285. - PMC - PubMed
    1. David G., Barrett J.N., Barrett E.F. Stimulation-induced changes in [Ca2+]i in lizard motor nerve terminals. J. Physiol. 1997;504:83–96. - PMC - PubMed
    1. Delaney K.R., Tank D.W.A. Quantitative measurement of the dependence of short-term synaptic enhancement on presynaptic residual calcium. J. Neurosci. 1994;14:5885–5902. - PMC - PubMed
    1. DiGregorio D.A., Vergara J.L. Localized detection of action potential-induced presynaptic calcium transients at a Xenopus neuromuscular junction. J. Physiol. 1997;505:585–592. - PMC - PubMed
    1. DiGregorio D.A., Peskoff A., Vergara J.L. Measurement of action potential-induced presynaptic calcium domains at a cultured neuromuscular junction. J. Neurosci. 1999;15:7846–7859. - PMC - PubMed

Publication types

MeSH terms