. 2000 Mar 20;191(6):1017-30.
doi: 10.1084/jem.191.6.1017.

Regulation of fas ligand expression during activation-induced cell death in T cells by p38 mitogen-activated protein kinase and c-Jun NH2-terminal kinase

Affiliations

Regulation of fas ligand expression during activation-induced cell death in T cells by p38 mitogen-activated protein kinase and c-Jun NH2-terminal kinase

J Zhang et al. J Exp Med. .

Abstract

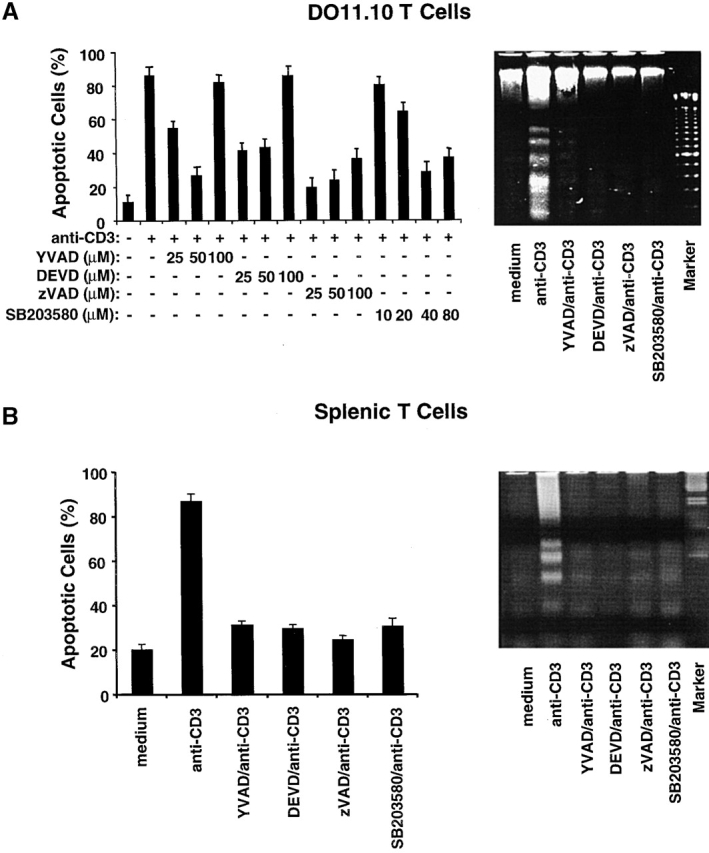
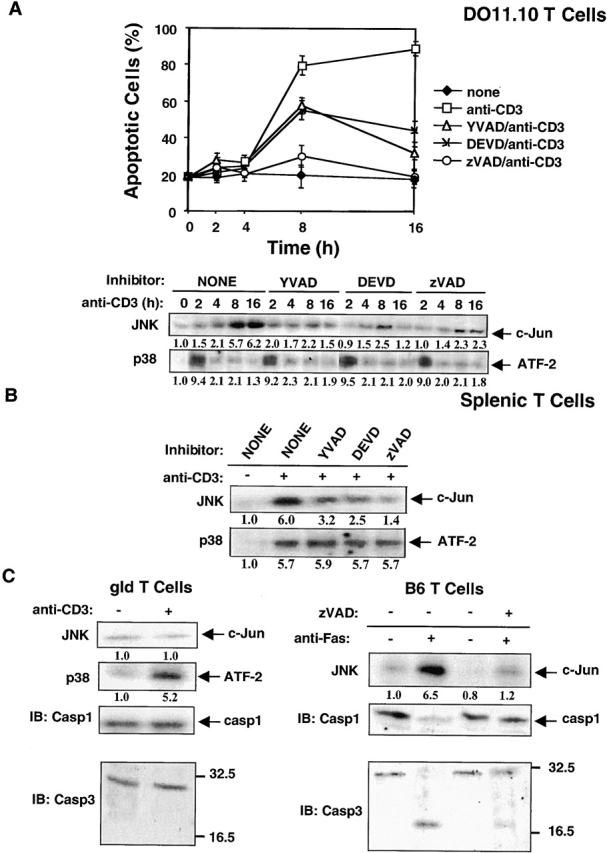
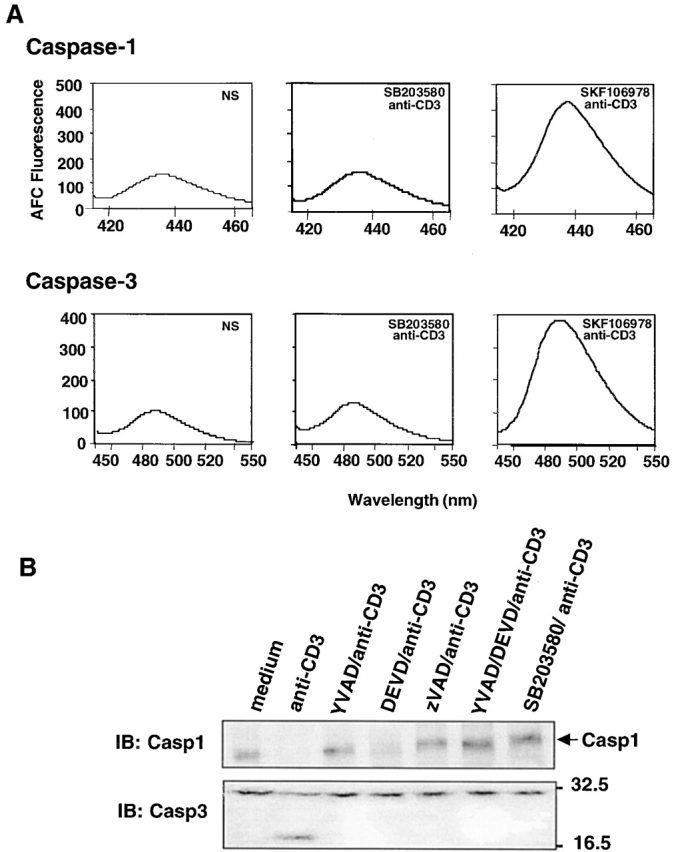
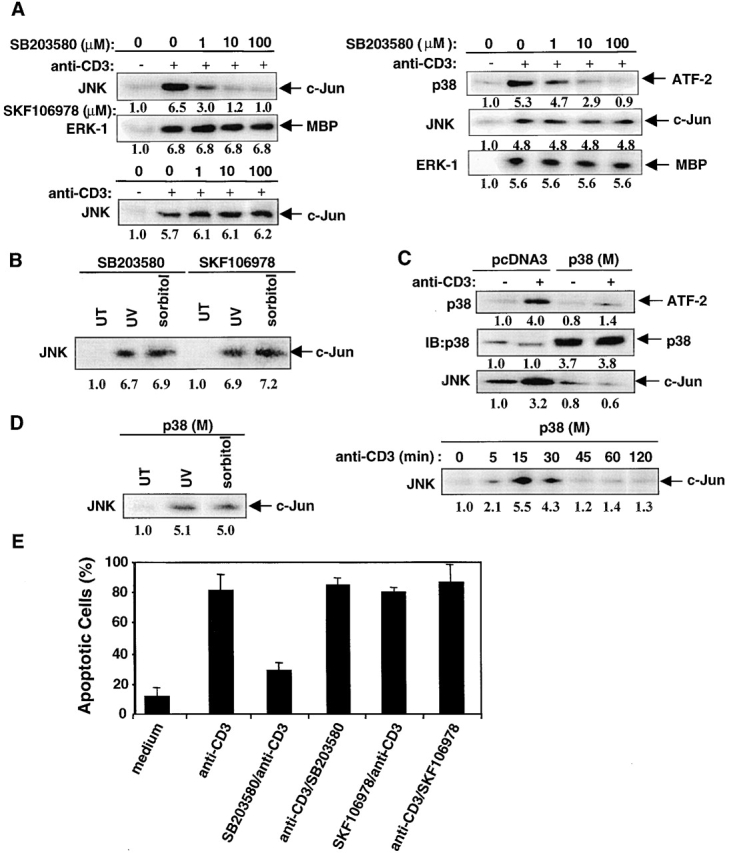
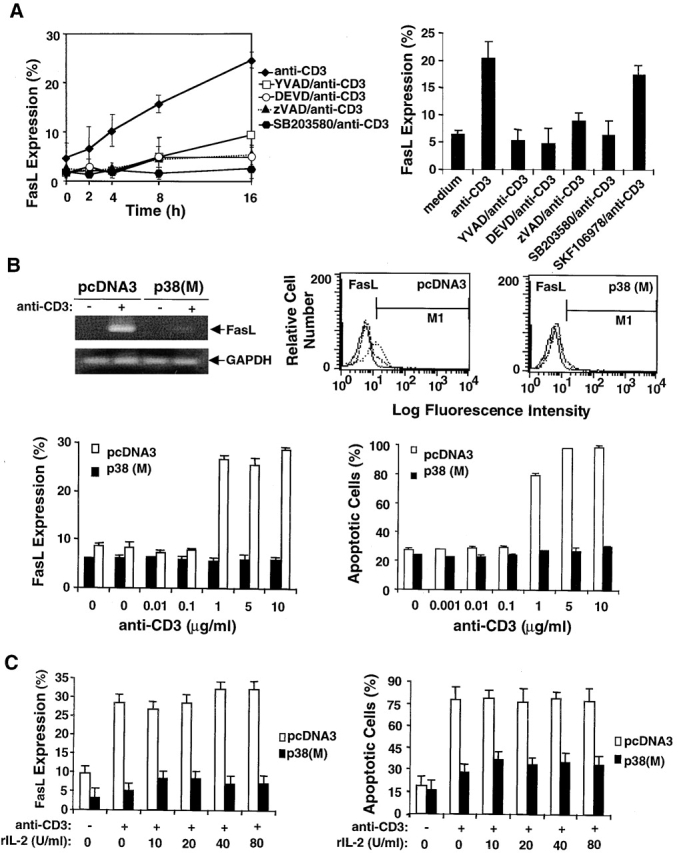
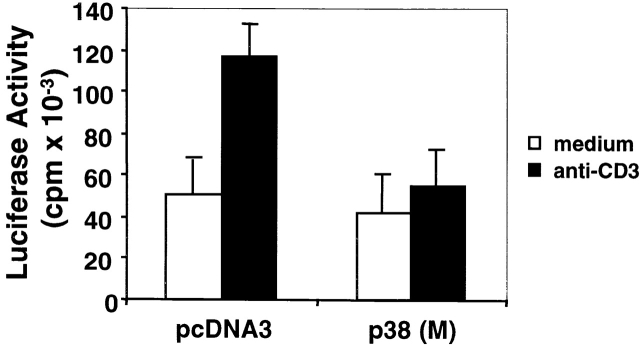
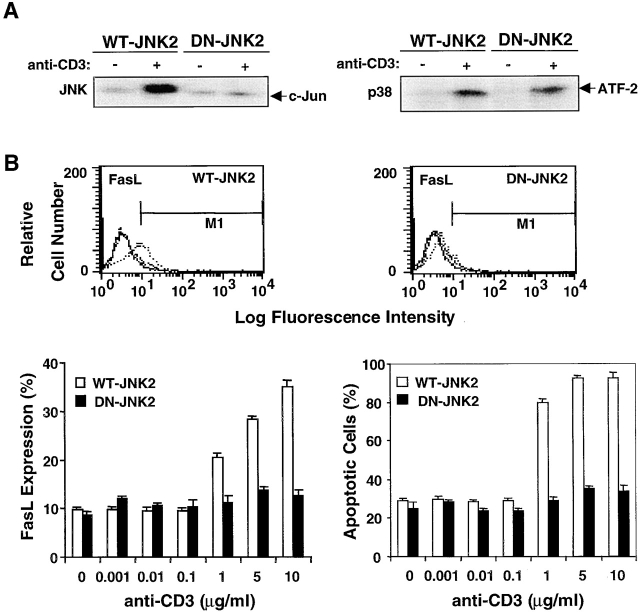
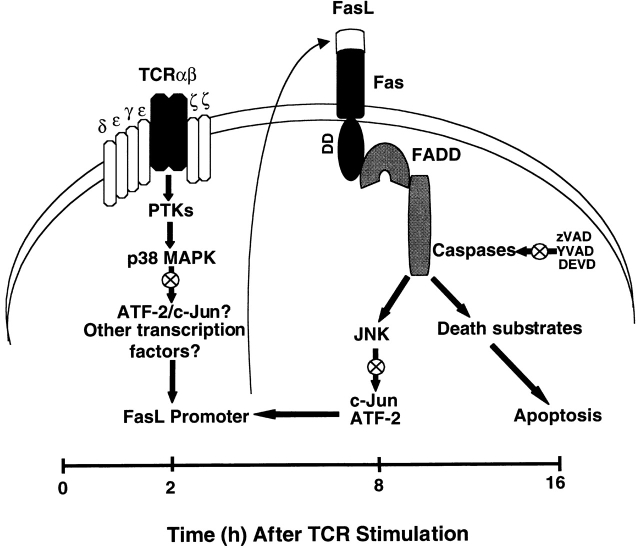
Activation-induced cell death (AICD) is a mechanism of peripheral T cell tolerance that depends upon an interaction between Fas and Fas ligand (FasL). Although c-Jun NH2-terminal kinase (JNK) and p38 mitogen-activated protein kinase (MAPK) may be involved in apoptosis in various cell types, the mode of regulation of FasL expression during AICD in T cells by these two MAPKs is incompletely understood. To investigate the regulatory roles of these two MAPKs, we analyzed the kinetics of TCR-induced p38 MAPK and JNK activity and their regulation of FasL expression and AICD. We report that both JNK and p38 MAPK regulate AICD in T cells. Our data suggest a novel model of T cell AICD in which p38 MAPK acts early to initiate FasL expression and the Fas-mediated activation of caspases. Subsequently, caspases stimulate JNK to further upregulate FasL expression. Thus, p38 MAPK and downstream JNK converge to regulate FasL expression at different times after T cell receptor stimulation to elicit maximum AICD.


Figures

Figure 1
Figure 1
p38 MAPK is required for T cell AICD. (A) DO11.10 T hybridoma cells were pretreated with different concentrations of SB203580 or caspase inhibitors YVAD, DEVD, and zVAD and then stimulated with plate-bound anti-CD3 mAb (10 μg/ml) for 16 h. The number of dead cells was quantitated by PI staining, and the results are expressed as percent apoptotic cells (left panel). Data are shown as mean values ± SEM and are from one of two independent experiments. DO11.10 T hybridoma cells were pretreated and then stimulated as in A. Chromosomal DNA was extracted and analyzed on a 2% agarose gel to detect DNA fragmentation (right panel). (B) Purified splenic T cells from B6 mice were activated with plate-bound anti-CD3 and anti-CD28 mAbs for 48 h. Activated T cells were then restimulated in wells coated with anti-CD3 for 16 h in the presence of either the caspase inhibitors YVAD, DEVD, or zVAD or the p38 MAPK inhibitor SB203580. rIL-2 (20 U/ml) was added to unstimulated and restimulated cells. The percent apoptotic cells was determined by PI staining (left panel). Data are shown as mean values ± SEM and are from one of three independent and reproducible experiments. DNA fragmentation (right panel) was detected as in A. Data shown are from one of three independent and reproducible experiments.
Figure 2
Figure 2
p38 MAPK and JNK are activated during AICD in DO11.10 T hybridoma cells and primary splenic T cells. (A) DO11.10 T cells were pretreated with the caspase inhibitors YVAD, DEVD, or zVAD and were then cultured in anti-CD3 (10 μg/ml)-coated plates for varying times. The percent of apoptotic cells was determined by PI staining as in Fig. 1. p38 MAPK was immunoprecipitated with an anti-p38 MAPK, and p38 MAPK activity in immunoprecipitates was measured using GST–ATF-2 as substrate. JNK activity was measured using a solid-phase JNK assay. Cell lysates were reacted for 4 h at 4°C with GST–c-Jun precoupled to glutathione–agarose beads, followed by an in vitro kinase reaction. Data are shown as mean values ± SEM and are from one of two independent and reproducible experiments. The relative activities of the p38 MAPK and JNK were quantitated by densitometric scanning and are shown below the respective gel lanes. (B) Splenic T cells from B6 mice were activated with plate-bound anti-CD3 and anti-CD28 mAbs for 48 h. Activated T cells were then restimulated in wells coated with anti-CD3 for 16 h in the presence of the caspase inhibitors YVAD, DEVD, or zVAD. For in vitro kinase assays of p38 MAPK and JNK, activated T cells were restimulated with plated-bound anti-CD3 for 2 h and 8 h, respectively, and the relative activities of p38 MAPK and JNK were assayed and quantitated as in A. (C) Splenic T cells from gld mice (left panel) were activated with plate-bound anti-CD3 and anti-CD28 mAbs for 48 h. Activated T cells were then restimulated in wells coated with anti-CD3 for 2 and 8 h. JNK and p38 MAPK activities were assayed as in A. Cell lysates were immunoblotted with anti–caspase-1 (Casp1) or anti-CPP32 (Casp3), respectively (left panel). Alternatively, B6 splenic T cells (right panel) were activated as in B, and activated T cells were then treated with plate-bound anti-Fas (5 μg/ml) for 8 h in the presence or absence of zVAD (50 μ/M). Activities of JNK and p38 MAPK and cleavage of caspase-1 and -3 were assayed as above. A and B, p29, line 4–5: in the presence of the caspase inhibitors YVAD, DEVD, and zVAD.
Figure 3
Figure 3
p38 MAPK regulates caspase activities. (A) DO11.10 T cells were pretreated for 1 h with 40 μM SB203580 or SKF106978 and then stimulated for 8 h with plate-bound anti-CD3. The activities of caspase-1 and caspase-3 were assayed using Ac-YVAD–AMC and Ac-DEVD–AFC as substrates. (B) DO11.10 T cells were pretreated with YVAD, DEVD, zVAD, and SB203580 for 1 h and then stimulated with plate-bound anti-CD3 for 8 h. The cells were lysed, and the cleavage of procaspase-1 and procaspase-3 were detected by immunoblotting with anti–caspase-1 (Casp1) and anti-CPP32 (Casp3) antibodies. Data shown are from one of three independent and reproducible experiments.
Figure 4
Figure 4
p38 MAPK is required for JNK activation during AICD. (A) Left panel, DO11.10 T cells were pretreated with SB203580 (0–100 μM) and then stimulated with plate-bound anti-CD3 for 8 h. JNK activity was assayed as in Fig. 2 A, and ERK1 activity was measured using MBP as substrate. Alternatively, JNK activity was assayed in DO11.10 T cells pretreated with SKF106978 (0–100 μM) and then stimulated with plate-bound anti-CD3 for 8 h. The relative activities of JNK and ERK1 were quantitated as in Fig. 2 A. Right panel, the activities of p38 MAPK, JNK, and ERK1 were assayed in DO11.10 T cells pretreated with SB203580 (0–100 μM) and then stimulated with anti-CD3 for 15 min. (B) DO11.10 T cells were pretreated with 40 μM of SB203580 or SKF106798 for 15 min and then treated with 0.4 mM sorbitol for 30 min. The cells were either left untreated (UT) or exposed to UV irradiation at 40 J/m2 and were then maintained for a further 30 min at 37°C. JNK activity in cell lysates was assayed and quantitated as in Fig. 2 A. (C) DO11.10 T cells were stably transfected with a control plasmid pcDNA3 or with pcDNA3 encoding p38 (M). DO11.10 transfectants were stimulated with plate-bound anti-CD3 for either 2 or 8 h for the p38 MAPK and JNK assays, respectively, which were performed and quantitated as in Fig. 2 A. The amounts of p38 MAPK proteins loaded were determined by anti-p38 MAPK immunoblotting. (D) p38 (M) DO11.10 transfectants were treated with UV irradiation or sorbitol as in B (left panel) or were stimulated with anti-CD3 for 0–120 min (right panel) and lysed. JNK activity was assayed and quantitated as in Fig. 2 A. (E) SB203580 or SKF106978, each at a concentration of 40 μM, was either added at 1 h before anti-CD3 stimulation or 4 h after anti-CD3 stimulation of DO11.10 T cells. The percent of apoptotic cells was scored by FACS® analysis of PI-stained cells. Data are shown as mean values ± SEM and are from one of three independent and reproducible experiments.
Figure 5
Figure 5
p38 MAPK regulates FasL expression. (A) Left panel, DO11.10 T cells were pretreated with SB203580 or caspase inhibitors YVAD, DEVD, and zVAD for 1 h at 37°C and then incubated with plate-bound anti-CD3 for varying times. At each time point, cells were harvested, stained with PE–anti-FasL mAb, and analyzed by flow cytometry. Data are shown as mean values ± SEM and are from one of three independent and reproducible experiments. Right panel, B6 splenic T cells were preactivated with plate-bound anti-CD3 and anti-CD28 for 48 h. Activated T cells were pretreated with either SB203580 or SKF106978 or caspase inhibitors YVAD, DEVD, and zVAD and then cultured in wells coated with anti-CD3. After 16 h, the cells were assayed for surface FasL expression as in A. Data are shown as mean values ± SEM and are from one of three independent and reproducible experiments. (B) DO11.10 T cells stably transfected with p38 (M) or control plasmid pcDNA3 were either left unstimulated or were stimulated with plate-bound anti-CD3 for 16 h. Cells were harvested, and RNA was prepared from all samples, reverse transcribed, amplified using primers specific for FasL and GAPDH, and electrophoresed in 1.5% agarose gels. Alternatively, cells were stained with PE–anti-FasL mAb or PI and analyzed by flow cytometry (center and right panels, respectively). The FasL expression data (fluorescence intensity) are shown as overlays (solid line, negative control; dashed line, unstimulated cells; and dotted line, stimulated cells) and are from one of three independent experiments. Alternatively, DO11.10 T cells stably transfected with p38 (M) or control plasmid pcDNA3 were either left unstimulated or stimulated with different concentrations of plate-bound anti-CD3 (0.001–10 μg/ml), and FasL expression and apoptosis were analyzed by flow cytometry. The data shown are from one of three independent and reproducible experiments. (C) p38 (M)- or pcDNA3-transfected DO11.10 T cells were cultured in wells coated with anti-CD3 in the presence of different concentrations of rIL-2 (10–80 U/ml) for 16 h. Percent FasL expression and apoptotic cells was quantitated as in B. Data shown are from one of three independent and reproducible experiments.
Figure 6
Figure 6
p38 MAPK regulates FasL promoter activity. p38 (M) or pcDNA3 DO11.10 stable transfectants were transiently transfected with a FasL-511 luciferase construct, maintained in medium for 36 h at 37°C, and were then either left unstimulated or were stimulated with plate-bound anti-CD3 for 16 h. Luciferase activity in whole cell lysates was assayed and is shown as mean value ± SEM. Transfection efficiency was monitored by cotransfection of a pUC19 plasmid encoding β-galactosidase. Similar results were obtained in three independent and reproducible experiments.
Figure 7
Figure 7
JNK regulates FasL expression and AICD. (A) DO11.10 T cells transfected with WT–JNK-2 or DN–JNK-2 were cultured for 8 h in the absence or presence of plate-bound anti-CD3. Cell lysates were reacted with 10 μg of either GST–c-Jun (left panel) precoupled to glutathione–agarose beads for 4 h at 4°C or immunoprecipitated with anti-p38 MAPK (right panel) and were then assayed for JNK or p38 MAPK activity, respectively. (B) DO11.10 T cells stably transfected with WT–JNK-2 or DN–JNK-2 were either left unstimulated or were stimulated with different concentrations of plate-bound anti-CD3 (0.001–10 μg/ml) for 16 h. The cells were harvested, stained with PE–anti-FasL or PI, and analyzed for percent surface Fas expression and apoptotic cells by flow cytometry (solid line, negative control; dashed line, unstimulated cells; and dotted line, stimulated cells). Data are shown as mean values ± SEM and are from one of three independent and reproducible experiments.
Figure 8
Figure 8
Model of regulation of FasL expression during TCR-induced T cell AICD. In this model, TCR ligation leads to the activation of PTKs, which results in the activation of p38 MAPK. p38 MAPK then phosphorylates several nuclear transcription factors (e.g., ATF-2), which may bind to the FasL promoter and activate FasL gene transcription. Transcribed FasL protein translocates from the cytoplasm to the plasma membrane, interacts with Fas which then recruits FADD to bind to its death domain. This FasL–Fas interaction initiates a caspase cascade that subsequently activates JNK. Activated JNK promotes AICD by regulating FasL expression. Thus, p38 MAPK and JNK may preferentially regulate FasL expression at early and later times after activation, respectively, perhaps by the phosphorylation and activation of distinct transcription factors for the FasL promoter. Consistent with this model, we observed that inhibition (⊗) of p38 MAPK, JNK, and caspase activity blocks T cell AICD.

Similar articles

Cited by

References

    1. Nagata S. Apoptosis by death factor. Cell. 1997;88:355–365. - PubMed
    1. Green D.R., Scott D.W. Activation-induced apoptosis in lymphocytes. Curr. Opin. Immunol. 1994;6:476–487. - PubMed
    1. Russell J.H. Activation-induced death of mature T cells in the regulation of immune responses. Curr. Opin. Immunol. 1995;7:382–388. - PubMed
    1. Brunner T., Mogil R.J., LaFrace D., Yoo N.J., Mahboubl A., Echeverri F., Martin S.J., Force W.R., Lynch D.H., Ware C.F. Cell-autonomous Fas (CD95)/Fas-ligand interaction mediates activation-induced apoptosis in T-cell hybridomas. Nature. 1995;373:441–444. - PubMed
    1. Dhein J., Walczak H., Baumler C., Debatin K.-M., Krammer P.H. Autocrine T-cell suicide mediated by APO-1/(Fas/CD95) Nature. 1995;373:438–441. - PubMed

Publication types

MeSH terms