. 2000 Mar;12(3):319-41.
doi: 10.1105/tpc.12.3.319.

Proteomics of the chloroplast: systematic identification and targeting analysis of lumenal and peripheral thylakoid proteins

Affiliations

Proteomics of the chloroplast: systematic identification and targeting analysis of lumenal and peripheral thylakoid proteins

J B Peltier et al. Plant Cell. 2000 Mar.

Abstract

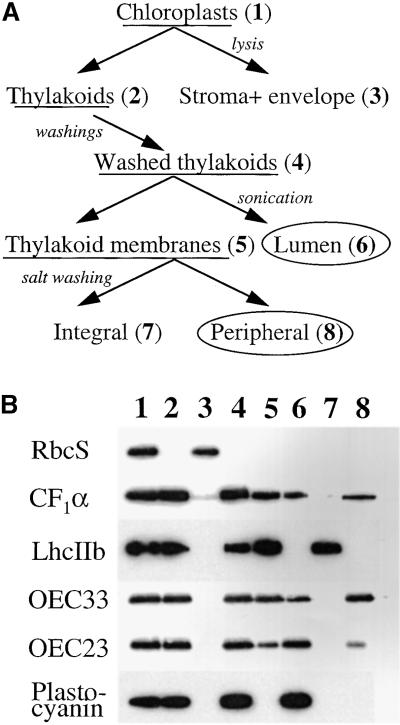
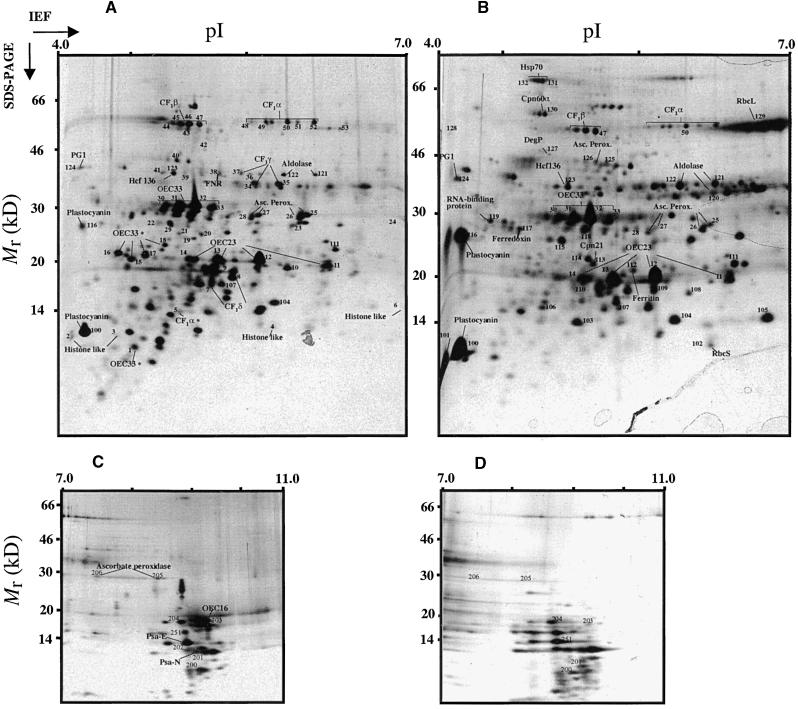
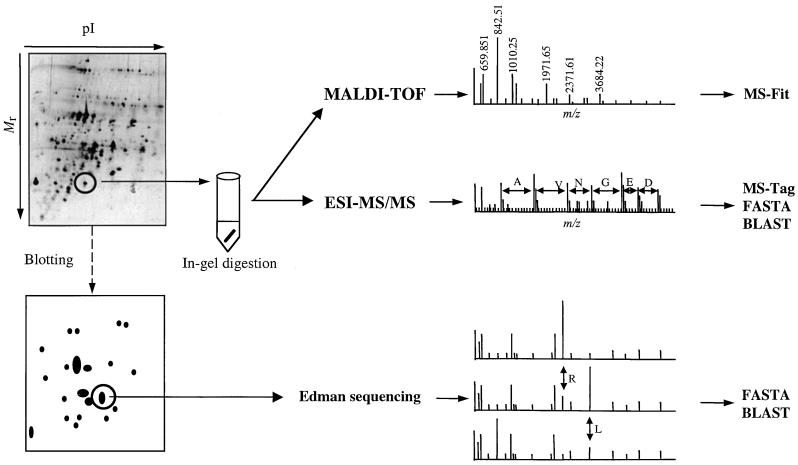
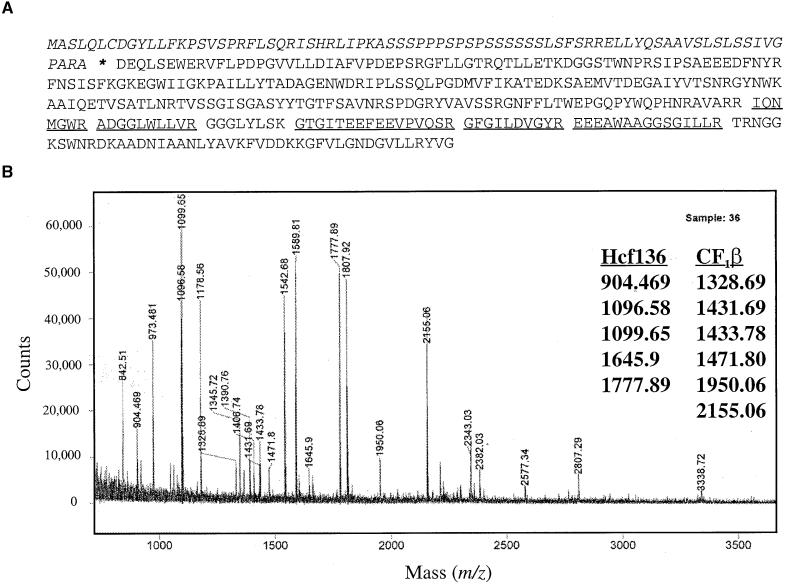
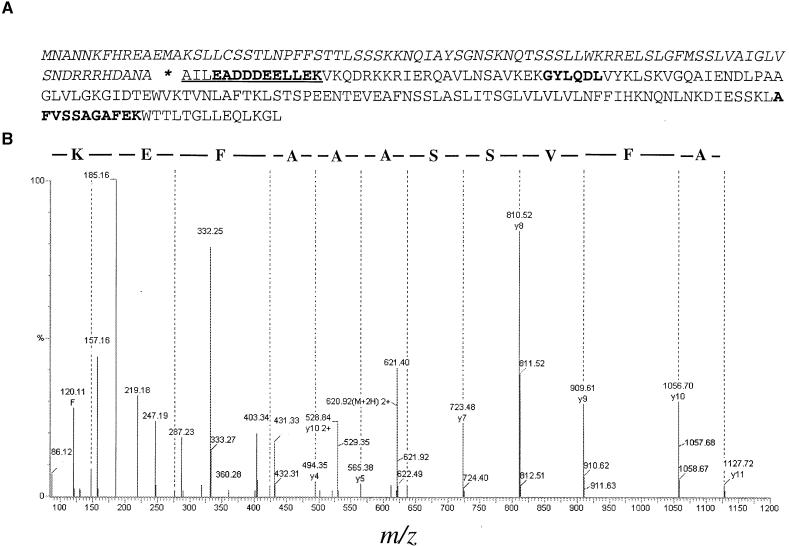
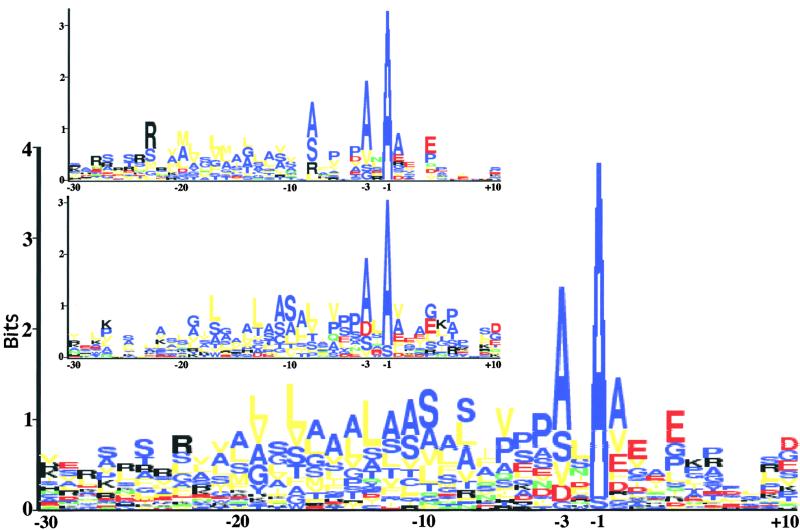
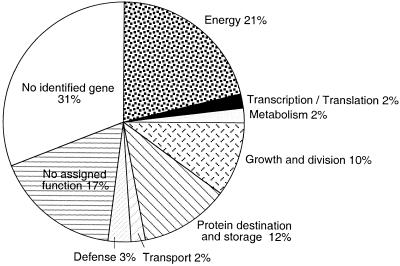
The soluble and peripheral proteins in the thylakoids of pea were systematically analyzed by using two-dimensional electrophoresis, mass spectrometry, and N-terminal Edman sequencing, followed by database searching. After correcting to eliminate possible isoforms and post-translational modifications, we estimated that there are at least 200 to 230 different lumenal and peripheral proteins. Sixty-one proteins were identified; for 33 of these proteins, a clear function or functional domain could be identified, whereas for 10 proteins, no function could be assigned. For 18 proteins, no expressed sequence tag or full-length gene could be identified in the databases, despite experimental determination of a significant amount of amino acid sequence. Nine previously unidentified proteins with lumenal transit peptides are presented along with their full-length genes; seven of these proteins possess the twin arginine motif that is characteristic for substrates of the TAT pathway. Logoplots were used to provide a detailed analysis of the lumenal targeting signals, and all nuclear-encoded proteins identified on the two-dimensional gels were used to test predictions for chloroplast localization and transit peptides made by the software programs ChloroP, PSORT, and SignalP. A combination of these three programs was found to provide a useful tool for evaluating chloroplast localization and transit peptides and also could reveal possible alternative processing sites and dual targeting. The potential of proteomics for plant biology and homology-based searching with mass spectrometry data is discussed.


Figures

Figure 1.
Figure 1.
Protein Gel Blot Analysis and Scheme of the Protein Purification Process. (A) To purify thylakoid protein fractions enriched in lumenal and peripheral proteins, intact and purified chloroplasts (1) were lysed and separated into crude thylakoids (2) and soluble stromal proteins and envelope proteins (3). Subsequently, the thylakoids were washed extensively to remove stromal proteins and envelopes. These washed thylakoids (4) then were sonicated to liberate soluble lumenal proteins (6), and the sonicated thylakoid membranes (5) were collected by centifugation. The sonicated thylakoid membranes were incubated in high salt to liberate the peripheral thylakoid proteins (8), and the remaining membranes, containing only integral membrane proteins (7), were removed by centrifugation. Fractions 6 and 8 were used for the proteomics analysis. (B) The partitioning of a set of stromal, peripheral, integral, and lumenal proteins during the purification of the lumenal and peripheral protein-enriched fractions was followed by protein gel blotting. All samples were loaded on an equal volume basis. Polyclonal antisera were used against the ribulose bisphosphate carboxylase small subunit (RbcS), which is one of the most abundant stromal proteins, peripheral protein CF1α on the stromal side, the integral membrane protein LhcIIb, two extrinsic subunits of the oxygen-evolving complex (OEC33 and OEC23) of PSII on the lumenal side of the membrane, and the soluble lumenal protein plastocyanin. The lane numbers in the protein gel blots correspond to the numbers in the purification scheme shown in (A).
Figure 2.
Figure 2.
Silver-Stained Two-Dimensional Electrophoresis Maps of Lumenal and Peripheral Proteins. Proteins were separated by two-dimensional gel electrophoresis with denaturing isoelectric focusing in the first dimension and SDS-PAGE in the second dimension. Gels were calibrated for molecular mass (in kilodaltons) and pI (in pH units) by internal (pH and mass) and external (mass) standards, which are indicated. Numbers indicate protein spots listed in Tables 1 to 4. For a selected number of spots, the identity (in addition to the number) has been listed on the two-dimensional electrophoresis map. Spots on the acidic maps (pH 4.0 to 7.0) for the peripheral and the lumenal proteins are, respectively, numbered from 1 to 99 and 100 to 199. Spots on the basic maps (pH 7.0 to 11.0) of the peripheral and lumenal proteins are numbered from 200 to 249 and 250 to 300, respectively. The same numbers are used on the lumenal and peripheral maps if spots could be matched by image analysis and confirmed by mass fingerprints or sequence tags. If proteins were identified on both maps, the number was chosen for the map in which the spot was most abundant. (A) and (C) Peripheral proteins were separated in the first dimension on IPGs between pH 4.0 and 7.0 (A) and between pH 7.0 and 11.0 (C). (B) and (D) Lumenal proteins were separated in the first dimension on IPGs between 4.0 and 7.0 (B) and between 7.0 and 11.0 (D).
Figure 3.
Figure 3.
Schematic Explanation of the Proteomics Strategy for Systematic Analysis of the Lumenal and Peripheral Thylakoid Proteins. The proteins were separated according to their isoelectric point (pI) and then according to their molecular mass, resulting in a two-dimensional gel. The spots were then visualized by Coomassie blue or silver staining, and the gels were scanned for image analysis. Individual protein spots then were selected (exemplified by the encircled spot), excised from the gel, and digested with the site-specific protease trypsin (cleavage C-terminal of either a K residue or an R residue), resulting in a set of tryptic peptides. The peptides were extracted, and their masses were measured by MALDI-TOF MS. The list of measured peptide masses was compared with the masses of the predicted tryptic peptides for each entry in the sequence databases (NCBI, SWISS-Prot, and PIR). Multiple search rounds were performed as described in Methods. In case the protein was not unambiguously identified by MALDI-TOF MS, peptide sequence tags were obtained by ESI-MS/MS or Edman sequencing. The peptide masses and obtained sequence tags were used to search the public databases with the program MS-Tag and FASTA. To obtain sequence tags by Edman sequencing, we stained gels with Coomassie blue before blotting to increase the sensitivity and to allow easier matching of the gels. Spots containing 10 to 15 pmol or more were selected.
Figure 4.
Figure 4.
MALDI-TOF MS Peptide Map of Spot Number 123 from the Peripheral Map (4 to 7). (A) The precursor protein sequence of Hcf136 from Arabidopsis. The N-terminal part of the sequence in italics is the predicted presequence; the lumenal cleavage site is indicated by an asterisk. Five peptides were identified by MALDI-TOF MS (B) and are indicated in the protein sequence (underlined). (B) The MALDI-TOF MS spectrum of the peptides generated by tryptic digestion of protein spot 123. The trypsin autodigested peptide ions 842.51 and 2211.11 (not labeled) were used for internal calibration. The MALDI-TOF MS spectrum of the peptides generated by tryptic digestion of the protein spot 123 matched (no miscleavage allowed; within 50 ppm; no oxidations) Hcf136 from Arabidopsis. Hcf136 can be seen on the lumenal map (spot 123) and was confirmed by N-terminal Edman sequencing. The second protein in this spot is CF1β, determined by the matching of six peptides (no miscleavage; four within 15 ppm; two within 40 ppm).
Figure 5.
Figure 5.
Identification of a Thylakoid Protein in Spot 104 by ESI-MS/MS. (A) Protein sequence of a hypothetical precursor protein from Arabidopsis identified in spot 104. The presequence is in italics, and the lumenal cleavage site is indicated by an asterisk. Protein spot 104 was identified by three experimental sequence tags determined by ESI-MS/MS and an N-terminal Edman tag. The four sequence tags are indicated in the protein sequence in boldface for ESI-MS/MS (I/LEADDDVELI/LEK; AFVSSAGAFEK; GYI/LK/QD) or underlined for Edman (AILEADDDEELLEK). Determination of the sequence tag AFVSSAAAFEK by ESI-MS/MS is shown in (B). (B) Typical ESI-MS/MS mass spectrum of a peptide recovered after in-gel tryptic digestion of protein spot 104. Fragmentation of the doubly charged precursor ion at an m/z ratio of 620.92 yielded the y-ion series (y1 to y11) for which the sequence is indicated. The experimental sequence tag from the pea protein matched (for 10 of 11 amino acid residues) a hypothetical protein of Arabidopsis as indicated in (A). Note that the sequence tag should be read backward from y11 to y1.
Figure 6.
Figure 6.
Logoplot of Thylakoid Proteins with Lumenal Transit Peptides Aligned According to the Predicted Cleavage Site (between −1 and +1) of Their Lumenal Transit Peptide. The main figure shows the logoplot of 26 different proteins with lumenal transit peptides, without any redundancy. The top inset shows the logoplot of a subset of 13 proteins targeted via the ΔpH/TAT pathway. The bottom inset shows the logoplot for the remaining 13 proteins. The height of the stack of letters at each position shows the amount of information, defined as the difference between the maximal and actual entropy (Schneider and Stephens, 1990), whereas the relative height of each letter shows the relative abundance of the corresponding amino acid. Positively and negatively charged amino acids are shown in black and red, respectively; external polar residues (N and Q) are shown in yellow, internal apolar (F, L, I, M, and V) in green, and ambivalent (P, T, S, C, A, G, Y, and W) in blue. Proteins used in the logoplots are for the ΔpH/TAT pathway (top inset): OEC16 (P12301); OEC23 (P16059); PsaN (P49107); Hcf136 (O82660); polyphenol oxidase (Q08303); PsbT (Q39195); the new ascorbate peroxidases in spots 23 to 28, 205, 206, and 125 in Table 2; and spots 19, 104, 108, 110, 111, and 204 in Table 3. The remaining proteins (bottom inset) are as follows: plastocyanin (P16002); OEC33 (P14226); DegP (AAC39436); CFoII (BAA09134); violaxanthin-deepoxidase (AAC50032); rotamase (CAA72792); PsbY1 (P80470); PsbY2 (P80470); CtpA (BAA09134); PsbX (AAD25151); PsaF (P13192); and spots 107 and 103 in Table 3.
Figure 7.
Figure 7.
Assignment of the Identified Proteins to Functional Categories by Using Classifications as Described by Bevan et al. (1998). In total, 58 proteins were classified. The categories are as follows: energy (the 12 nonstromal proteins in Table 1), transcription/translation (spot 119 in Table 2), metabolism (spot 42 in Table 2), growth and division (spots 2, 3, 4, 6, 39, and 124 in Table 2), protein destination and storage (spots 110, 112, 113, 123, 127, and 131 to 133 in Table 2), transport (spot 40 in Table 2), defense (spots 23 to 28, 126, 205, and 206 in Table 2), no assigned function (the 10 proteins in Table 3), and no identified gene or homolog (the 18 proteins in Table 4).

Comment in

Similar articles

Cited by

References

    1. Adam, Z. (1996). Protein stability and degradation in chloroplasts. Plant Mol. Biol. 32 773–783. - PubMed
    1. Bauw, G., De Loose, M., Inzé, D., van Montagu, M., and Vandekerckhove, J. (1987). Alterations in the phenotype of plant cells studied by NH2-terminal amino acid–sequence analysis of proteins electroblotted from two-dimensional gel-separated total extracts. Proc. Natl. Acad. Sci. USA 84 4806–4810. - PMC - PubMed
    1. Bauw, G., Van Damme, J., Puype, M., Vandekerckhove, J., Gesser, B., Ratz, G.P., Lauridsen, J.B., and Celis, J.E. (1989). Protein-electroblotting and microsequencing strategies in generating protein data bases from two-dimensional gels. Proc. Natl. Acad. Sci. USA 86 7701–7705. - PMC - PubMed
    1. Belanger, F.C., Leustek, T., Chu, B., and Kriz, A.L. (1995). Evidence for the thiamine biosynthetic pathway in higher-plant plastids and its developmental regulation. Plant Mol. Biol. 29 809–821. - PubMed
    1. Bevan, M., et al., (1998). Analysis of 1.9 Mb of contiguous sequence from chromosome 4 of Arabidopsis thaliana. Nature 39 485–488. - PubMed

Publication types

MeSH terms

Substances

LinkOut - more resources