Paternal versus maternal transmission of a stimulatory G-protein alpha subunit knockout produces opposite effects on energy metabolism
- PMID: 10712433
- PMCID: PMC289181
- DOI: 10.1172/JCI8437
Paternal versus maternal transmission of a stimulatory G-protein alpha subunit knockout produces opposite effects on energy metabolism
Abstract
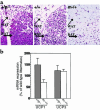
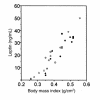
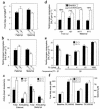
Heterozygous disruption of Gnas, the gene encoding the stimulatory G-protein alpha subunit (G(s)alpha), leads to distinct phenotypes depending on whether the maternal (m-/+) or paternal (+/p-) allele is disrupted. G(s)alpha is imprinted, with the maternal allele preferentially expressed in adipose tissue. Hence, expression is decreased in m-/+ mice but normal in +/p- mice. M-/+ mice become obese, with increased lipid per cell in white and brown adipose tissue, whereas +/p- mice are thin, with decreased lipid in adipose tissue. These effects are not due to abnormalities in thyroid hormone status, food intake, or leptin secretion. +/p- mice are hypermetabolic at both ambient temperature (21 degrees C) and thermoneutrality (30 degrees C). In contrast, m-/+ mice are hypometabolic at ambient temperature and eumetabolic at thermoneutrality M-/+ and wild-type mice have similar dose-response curves for metabolic response to a beta(3)-adrenergic agonist, CL316243, indicating normal sensitivity of adipose tissue to sympathetic stimulation. Measurement of urinary catecholamines suggests that +/p- and m-/+ mice have increased and decreased activation of the sympathetic nervous system, respectively. This is to our knowledge the first animal model in which a single genetic defect leads to opposite effects on energy metabolism depending on parental inheritance. This probably results from deficiency of maternal- and paternal-specific Gnas gene products, respectively.
Figures


Similar articles
-
Alternative Gnas gene products have opposite effects on glucose and lipid metabolism.Proc Natl Acad Sci U S A. 2005 May 17;102(20):7386-91. doi: 10.1073/pnas.0408268102. Epub 2005 May 9. Proc Natl Acad Sci U S A. 2005. PMID: 15883378 Free PMC article.
-
Endocrine manifestations of stimulatory G protein alpha-subunit mutations and the role of genomic imprinting.Endocr Rev. 2001 Oct;22(5):675-705. doi: 10.1210/edrv.22.5.0439. Endocr Rev. 2001. PMID: 11588148 Review.
-
Variable and tissue-specific hormone resistance in heterotrimeric Gs protein alpha-subunit (Gsalpha) knockout mice is due to tissue-specific imprinting of the gsalpha gene.Proc Natl Acad Sci U S A. 1998 Jul 21;95(15):8715-20. doi: 10.1073/pnas.95.15.8715. Proc Natl Acad Sci U S A. 1998. PMID: 9671744 Free PMC article.
-
A mouse model of albright hereditary osteodystrophy generated by targeted disruption of exon 1 of the Gnas gene.Endocrinology. 2005 Nov;146(11):4697-709. doi: 10.1210/en.2005-0681. Epub 2005 Aug 11. Endocrinology. 2005. PMID: 16099856
-
Studies of the regulation and function of the Gs alpha gene Gnas using gene targeting technology.Pharmacol Ther. 2007 Aug;115(2):271-91. doi: 10.1016/j.pharmthera.2007.03.013. Epub 2007 Apr 21. Pharmacol Ther. 2007. PMID: 17588669 Free PMC article. Review.
Cited by
-
Maternal inheritance of the Gnas cluster mutation Ex1A-T affects size, implicating NESP55 in growth.Mamm Genome. 2013 Aug;24(7-8):276-85. doi: 10.1007/s00335-013-9462-2. Epub 2013 Jul 10. Mamm Genome. 2013. PMID: 23839232 Free PMC article.
-
Transcription driven somatic DNA methylation within the imprinted Gnas cluster.PLoS One. 2015 Feb 6;10(2):e0117378. doi: 10.1371/journal.pone.0117378. eCollection 2015. PLoS One. 2015. PMID: 25659103 Free PMC article.
-
Extralarge XL(alpha)s (XXL(alpha)s), a variant of stimulatory G protein alpha-subunit (Gs(alpha)), is a distinct, membrane-anchored GNAS product that can mimic Gs(alpha).Endocrinology. 2009 Aug;150(8):3567-75. doi: 10.1210/en.2009-0318. Epub 2009 May 7. Endocrinology. 2009. PMID: 19423757 Free PMC article.
-
Myostatin inhibition prevents diabetes and hyperphagia in a mouse model of lipodystrophy.Diabetes. 2012 Oct;61(10):2414-23. doi: 10.2337/db11-0915. Epub 2012 May 17. Diabetes. 2012. PMID: 22596054 Free PMC article.
-
Ablation of Sim1 neurons causes obesity through hyperphagia and reduced energy expenditure.PLoS One. 2012;7(4):e36453. doi: 10.1371/journal.pone.0036453. Epub 2012 Apr 27. PLoS One. 2012. PMID: 22558467 Free PMC article.
References
-
- Spiegel AM, Shenker A, Weinstein LS. Receptor-effector coupling by G proteins: implications for normal and abnormal signal transduction. Endocr Rev. 1992;13:536–565. - PubMed
-
- Gejman PV, et al. Genetic mapping of the Gs-α subunit gene (GNAS1) to the distal long arm of chromosome 20 using a polymorphism detected by denaturing gradient gel electrophoresis. Genomics. 1991;9:782–783. - PubMed
-
- Weinstein, L.S. 1998. Albright hereditary osteodystrophy, pseudohypoparathyroidism and Gs deficiency. In G proteins, receptors, and disease. A.M. Spiegel, editor. Humana Press. Totowa, NJ. 23–56.
-
- Bartolomei MS, Tilghman SM. Genomic imprinting in mammals. Annu Rev Genet. 1997;31:493–525. - PubMed
Publication types
MeSH terms
Substances
Grants and funding
LinkOut - more resources
Full Text Sources
Medical
Molecular Biology Databases

