. 2000 Feb 7;191(3):529-40.
doi: 10.1084/jem.191.3.529.

The first alpha helix of interleukin (IL)-2 folds as a homotetramer, acts as an agonist of the IL-2 receptor beta chain, and induces lymphokine-activated killer cells

Affiliations

The first alpha helix of interleukin (IL)-2 folds as a homotetramer, acts as an agonist of the IL-2 receptor beta chain, and induces lymphokine-activated killer cells

R Eckenberg et al. J Exp Med. .

Abstract

Interleukin (IL)-2 interacts with two types of functional receptors (IL-2Ralphabetagamma and IL-2Rbetagamma) and acts on a broad range of target cells involved in inflammatory reactions and immune responses. For the first time, we show that a chemically synthesized fragment of the IL-2 sequence can fold into a molecule mimicking the quaternary structure of a hemopoietin. Indeed, peptide p1-30 (containing amino acids 1-30, covering the entire alpha helix A of IL-2) spontaneously folds into an alpha-helical homotetramer and stimulates the growth of T cell lines expressing human IL-2Rbeta, whereas shorter versions of the peptide lack helical structure and are inactive. We also demonstrate that this neocytokine interacts with a previously undescribed dimeric form of IL-2Rbeta. In agreement with its binding to IL-2Rbeta, p1-30 activates Shc and p56(lck) but unlike IL-2, fails to activate Janus kinase (Jak)1, Jak3, and signal transducer and activator of transcription 5 (STAT5). Unexpectedly, we also show that p1-30 activates Tyk2, thus suggesting that IL-2Rbeta may bind to different Jaks depending on its oligomerization. At the cellular level, p1-30 induces lymphokine-activated killer (LAK) cells and preferentially activates CD8(low) lymphocytes and natural killer cells, which constitutively express IL-2Rbeta. A significant interferon gamma production is also detected after p1-30 stimulation. A mutant form of p1-30 (Asp20-->Lys), which is likely unable to induce vascular leak syndrome, remains capable of generating LAK cells, like the original p1-30 peptide. Altogether, our data suggest that p1-30 has therapeutic potential.


Figures
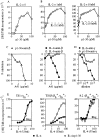
Figure 1
Figure 1
p1–30 induces cell proliferation and acts in synergy with IL-2. Role of human IL-2β. TS1β cells were stimulated with p1–30 (up to 100 μM) in the absence (A) or presence (B) of 1 or 10 nM IL-2. This was followed by measuring [3H]TdR incorporation. Proliferative responses induced with 1 or 10 nM of IL-2 were 38,148 and 72,370 cpm, respectively. Optimal responses were obtained with 60 μM of p1–30. Background was subtracted. (C) Effects of neutralizing anti–human IL-2Rβ mAb (A41) were tested on TS1β cell proliferation induced by p1–30 (60 μM), IL-2 (1 nM), or IL-9 (10 nM). (D) Effects of two neutralizing anti–mouse IL-2Rγ mAbs (3E12 and 4G3 mAbs) on the IL-2– and p1–30-induced proliferation of TS1β cells. Abs isolated from mouse ascitic fluids were diluted and added to the cell culture. (E) Synergy between p1–30 and IL-4. Proliferative responses of TS1 (expressing mouse IL-2Rγ), TS1β (expressing human IL-2Rβ and mouse IL-2Rγ), and 8.2 cells (expressing mouse IL-2Rβ and mouse IL-2Rγ) were induced at various concentrations of IL-4 (up to 100 U/ml) in the presence or absence of 60 μM of p1–30. Values obtained for p1–30 responses (Bkg) were subtracted from the IL-4 plus p1–30 response.
Figure 2
Figure 2
Structure–function analysis of p1–30. (A) The CD spectra from 180 to 260 nm are shown for p1–10, p5–15, p10–20, p1–22, p10–30, and p1–30 at 150 μM. The p1–30 concentration dependence (3–150 μM) of the CD signal at 192 nm is shown in the insert. (B) Size exclusion chromatography. Peptide p1–30 was eluted as a single main peak of molecular mass 13 kD (according to column calibration). Arrows indicate molecular weight (mw) markers, void volume (V0) and total volume (Vc). Monomeric, tetrameric, and octameric forms are shown. (C) TS1β cell proliferation was tested at various concentrations of IL-2 (from 5 × 10⁻³ to 10 nM) with 60 μM of either p1–30, p1–22, or p10–30. The response to IL-2 or peptide alone was subtracted from that obtained with both IL-2 and peptide. (D) Role of Asp20 in p1–31 activity. TS1β cells were stimulated with various concentrations of IL-2 (from 5 × 10⁻³ to 10 nM) in the presence of 60 μM of peptide p1–31 or p1–31(Lys20). Results are presented as in C. (E) The biological activity of mutant IL-2(Lys20) is shown for comparison.
Figure 3
Figure 3
Sedimentation–diffusion equilibrium of p1–30 and soluble IL-2Rβ. Profiles of absorbance versus radius from the center of rotation were obtained by sedimentation–diffusion equilibrium at 25 krpm in 20 mM sodium phosphate, pH 7.2, at 20°C. Residual errors as a function of radial distance from the center of rotation show the fitting quality of the data to the selected models. (A) p1–30 initial concentration was 150 μM. Absorbance was recorded at 242 nm. A better fit was obtained with a tetramer–octamer model of equilibrium (bottom) than with a tetramer model (top). (B) IL-2Rβ 31–230 initial concentration was 14 μM. Absorbance was recorded at 295 nm. An equilibrium monomer–dimer model (bottom) seemed slightly better than a dimer model (top). (C) p1–30Cys-FLC and IL-2Rβ 31–230 initial concentrations were 150 and 14 μM, respectively. Absorbance of p1–30Cys-FLC (at 490 nm) in the presence or absence of IL-2Rβ 31–230 is shown (top). Profile at 295 nm (aromatic residue absorbance of IL-2Rβ 31–230) of the peptide–protein mixture is also shown (bottom).
Figure 4
Figure 4
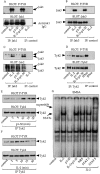
Signal transduction induced by p1–30. (A) General pattern of protein tyrosine phosphorylation. Kit 225 cells were stimulated for 10 min with IL-2 (10 nM), p1–30 (60 μM), or both. Cells were lysed, and the pattern of protein tyrosine phosphorylation was visualized by SDS-PAGE and immunoblotted with mAb 4G10, specific for phosphotyrosine (P-TYR). Arrowheads indicate the phosphorylated proteins upregulated by p1–30. (B) Phosphorylation of Shc. Kit 225 cells were stimulated for 1, 2, 5, 10, and 15 min. After lysis, phosphotyrosine-containing proteins were detected with 4G10 mAb (top). The identity and equal loading of the two Shc isoforms were confirmed by probing with the mAb to human Shc (bottom). (C) Induction of p56lck kinase activity. Kit 225 cells were stimulated for 15 min with 10 nM of IL-2, 60 μM of p1–30, or a combination of both. p56lck was immunoprecipitated and tested for its ability to phosphorylate the exogenous enolase substrate (top). The bottom panel shows that equal amounts of immunoprecipitated p56lck were used in the kinase assay.
Figure 5
Figure 5
Implications of the Jak proteins in p1–30 signaling. (A–D) Analysis of Jak protein activation. Cells were stimulated for 10 min as indicated and immunoprecipitated with anti-Jak1 (A), Jak3 (B), Jak2 (C), and Tyk2 (D) mAbs. Antiphosphotyrosine blotting (P-TYR, top) and anti-Jak blotting (bottom) are shown. For C, the immunoblot displays two bands because the commercial anti-Jak2 serum cross-reacts with Jak3. However, the two kinases could be distinguished by their molecular weights. For D, cells were stimulated with IFN-α (0.3 nM) as a positive control for Tyk2 activation. (E and F) Analysis of Tyk2. Kit 225 cells were stimulated for 2, 5, 10, 15, and 30 min with p1–30 (60 μM) or IL-2 (10 nM). After lysis and anti-Tyk2 immunoprecipitation, phosphotyrosine-containing Tyk2 was detected (top). The total amount of immunoprecipitated Tyk2 corresponding to each stimulation was verified (bottom). (G) Activation of STAT proteins by IL-2 but not by p1–30. EMSA was carried out on nuclear extracts of Kit 225 stimulated for 10 min with IL-2 (10 nM), p1–30 (60 μM), or both. Nuclear extracts were incubated with the GAS probe. Supershifted complexes were analyzed with antibodies directed against STAT5, STAT3, or a nonrelevant serum (NRS) after IL-2 stimulation.
Figure 6
Figure 6
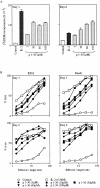
p1–30 activity on PBMCs. (A) Proliferation of PBMCs. PBMCs from healthy human donors were stimulated with IL-2 (0.5 nM) or p1–30 (3, 30, 60, or 100 μM) for 3 or 6 d followed by measurement of thymidine incorporation. The graph shows the negative control (white bars), IL-2–induced proliferation (black bars), and the dose-dependent p1–30-induced proliferation (gray bars). (B) Induction of LAK cells. PBMCs stimulated with IL-2 (0.5 nM) or p1–30 (3, 10, 30, 60, or 100 μM) for 3 or 6 d were tested for their ability to lyse K562 or Daudi target cells. Percent lysis at different effector/target ratios is shown. (C) LAK cell induction by p1–31(Lys20). The lysis of K562 or Daudi target cells by PBMCs stimulated with p1–30 or p1–31(Lys20) (30 μM) for 6 d was measured. Results obtained at different effector/target ratios are presented. Data of representative experiments are shown.
Figure 6
Figure 6
p1–30 activity on PBMCs. (A) Proliferation of PBMCs. PBMCs from healthy human donors were stimulated with IL-2 (0.5 nM) or p1–30 (3, 30, 60, or 100 μM) for 3 or 6 d followed by measurement of thymidine incorporation. The graph shows the negative control (white bars), IL-2–induced proliferation (black bars), and the dose-dependent p1–30-induced proliferation (gray bars). (B) Induction of LAK cells. PBMCs stimulated with IL-2 (0.5 nM) or p1–30 (3, 10, 30, 60, or 100 μM) for 3 or 6 d were tested for their ability to lyse K562 or Daudi target cells. Percent lysis at different effector/target ratios is shown. (C) LAK cell induction by p1–31(Lys20). The lysis of K562 or Daudi target cells by PBMCs stimulated with p1–30 or p1–31(Lys20) (30 μM) for 6 d was measured. Results obtained at different effector/target ratios are presented. Data of representative experiments are shown.
Figure 7
Figure 7
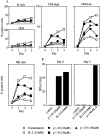
Activation of NK and CD8 T cells by p1–30 and induction of IFN-γ. (A) PBMCs were stimulated with IL-2 (0.5 nM) or p1–30 (10, 30, or 100 μM) for 1, 2, or 3 d. Subpopulations labeled with anti-CD4 (Th lymphocytes), CD8 (CTLs), CD20 (B lymphocytes), or CD56 (NK cells) were assayed for CD69 expression. Graphs represent the percentage of CD69+ cells for each population with respect to stimulant (IL-2 or p1–30) and time (day) of stimulation. Data of a representative experiment are shown. (B) IFN-γ production was measured on supernatants from PBMCs stimulated with IL-2 (0.5 nM) or p1–30 (30 μM) at day 6. In a second panel, synergy between IL-2 (0.5 nM) and p1–30 (30 μM) is shown after 2 d of stimulation.
None

Similar articles

Cited by

References

    1. Robb R.J., Kutny R.M., Panico M., Morris H.R., Chowdhry V. Amino acid sequence and post-translational modification of human interleukin-2. Proc. Natl. Acad. Sci. USA. 1984;81:6486–6490 . - PMC - PubMed
    1. Taniguchi T., Matsui H., Fujita T., Takaoka C., Kashima N., Yoshimoto R., Hamuro J. Structure and expression of a cloned cDNA for human interleukin-2. Nature. 1983;302:305–310. - PubMed
    1. MacKay D. Unraveling the structure of IL-2reply. Science. 1992;257:410–413. - PubMed
    1. Smith K.A. Interleukin-2inception, impact and implications. Science. 1988;240:1169–1176. - PubMed
    1. Thèze J., Alzari P.M., Bertoglio J. Interleukin 2 and its receptorsrecent advances and new immunological functions. Immunol. Today. 1996;10:481–486. - PubMed

Publication types

MeSH terms

Substances