. 1999 Dec 3;294(3):667-82.
doi: 10.1006/jmbi.1999.3297.

RNA sequence and secondary structural determinants in a minimal viral promoter that directs replicase recognition and initiation of genomic plus-strand RNA synthesis

Affiliations

RNA sequence and secondary structural determinants in a minimal viral promoter that directs replicase recognition and initiation of genomic plus-strand RNA synthesis

K Sivakumaran et al. J Mol Biol. .

Abstract

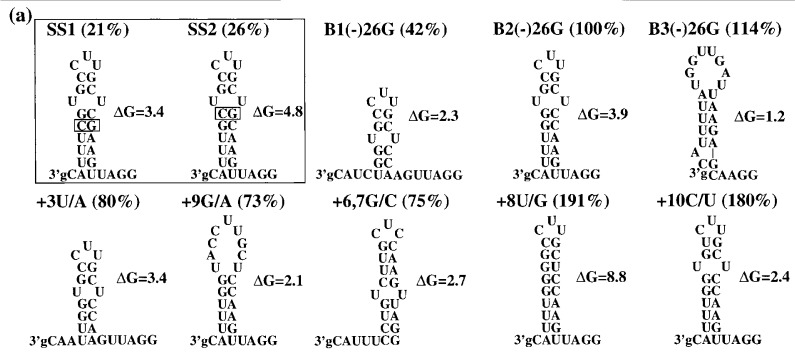
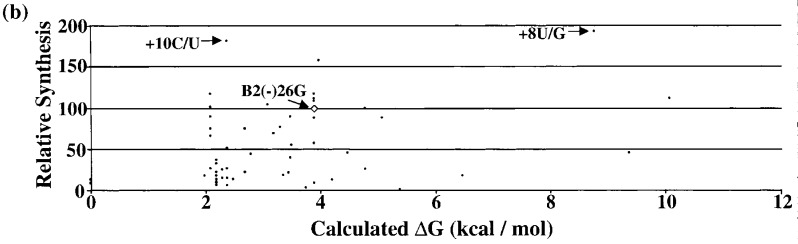
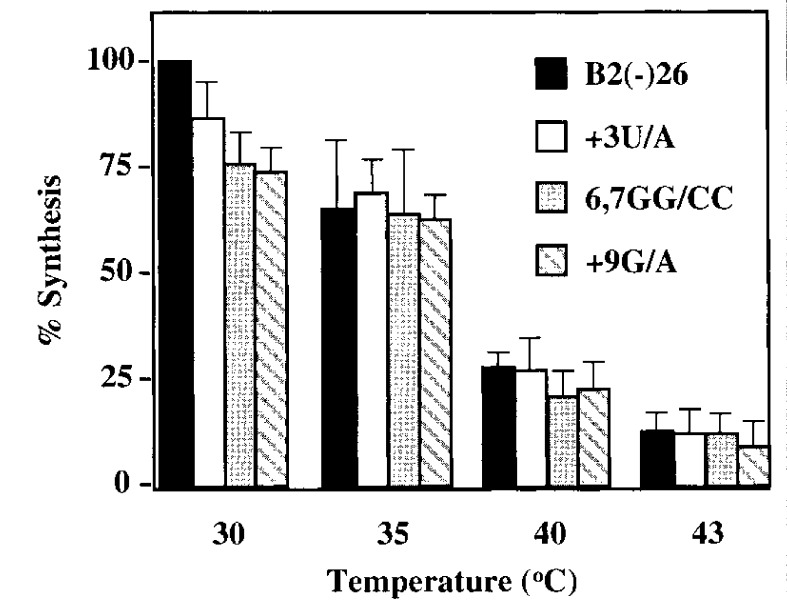
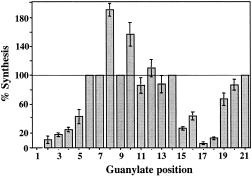
Viral RNA replication provides a useful system to study the structure and function of RNAs and the mechanism of RNA synthesis from RNA templates. Previously we demonstrated that a 27 nt RNA from brome mosaic virus (BMV) can direct correct initiation of genomic plus-strand RNA synthesis by the BMV replicase. In this study, using biochemical, nuclear magnetic resonance, and thermodynamic analyses, we determined that the secondary structure of this 27 nt RNA can be significantly altered and retain the ability to direct RNA synthesis. In contrast, we find that position-specific changes in the RNA sequence will affect replicase recognition, modulate the polymerization process, and contribute to the differential accumulation of viral RNAs. These functional results are in agreement with the phylogenetic analysis of BMV and related viral sequences and suggest that a similar mechanism of RNA synthesis takes place for members of the alphavirus superfamily.


Figures

Figure 1
Figure 1
Analysis of the secondary structure of endscript B2(–)26G. (a) Visualization of RNA conformations by electrophoresis through a non-denaturing 12 % polyacrylamide gel. Between 30 and 60 μM of RNA purified by denaturing gel electrophoresis were heated to 90 °C for two minutes, then allowed to cool over a 30 minute period to room temperature. The samples were then electrophoresed on a 17 cm × 15 cm × 0.8 cm gel at 200 V until the bromophenol blue migrated to the middle of the gel. The RNAs are SL13, an RNA that exists in equilibrium between an intramolecularly folded hairpin and an intermolecularly folded dimer (lane 1), B2(–)26G (lane 2), +3 U/A (lane 3), +6,7 G/C, +9G/A. (b) The secondary structure of B2(–)26G as predicted by the mfold program. (c) One-dimensional NMR spectrum of the imino protons from B2(–)26G taken at 20 °C by a Bruker 600 mHz spectrometer. B2(–)26G, at 0.7 mM, was purified and prepared in 10 % deuterium/90 % water as described in Experimental Procedures. (d) The two-dimensional NOESY spectrum of a 2.0 mM B2(–)26G sample taken at 20 °C taken from a Bruker 500 mHz spectrometer. The identity of the nucleotide responsible for the signals in the diagonal plane is indicated on the left-hand side of the Figure. Where noted with a gray spot, the origin of the signal was not determined with certainty and could have arisen from nucleotides in the loop of unbase-paired regions. The vertical and horizontal lines were added to the output containing the NMR signals to identify the connectivity of two nucleotides. The two crosspeaks associated with U4 and indicated by squares were observed in spectra with different mixing time than the one shown.
Figure 2
Figure 2
Effect of nucleotide changes on plus-strand RNA synthesis. (a) An autoradiogram of RNAs produced by select endscripts. The reaction products were separated by denaturing 12 % PAGE and visualized by autoradiography. Ø represents the products of a control reaction with no added template. WT denotes the wild-type sequence of B2(–)26G. Changes to the B2(–)26G template are indicated above the autoradiogram of the RdRp products. CM∗ denotes an endscript with a +3-5 substitutions (UUU changed to CCC) plus a substitution of position +19-21 (AAG changed to GGG). Endscripts that have an initiation-competent cytidylate at the +1 position are indicated by a +, while endscripts with an initiation incompetent +1 guanylate are indicated with a −. The predominant product is 26 nt; lesser amounts of a 27 nt product and a 25 nt product are also observed. (b) Summary of the mutational analysis. The wild-type sequence is written near the top of the Figure. The changes at each of the positions are indicated on the left of the Figure. The effect of the nucleotide substitutions on RNA synthesis is denoted as a percentage relative to the amount of synthesis directed by the B2(–)26G wild-type. All results presented are from at least three independent trials with a standard deviation ⩽11 %. Boxes left blank indicate that the effect of that nucleotide substitution was not tested.
Figure 3
Figure 3
Correlation between the secondary structure and the ability of mutant endscripts to direct RNA synthesis. The amount of RNA synthesis directed by select mutant endscripts are shown as a percentage relative to that of B2(–)26G. (a) Schematic highlighting the nucleotide changes expected to disrupt the RNA secondary structure and their effect on RNA synthesis. (b) Schematic highlighting the nucleotide changes expected to maintain the RNA secondary structure and their effect on RNA synthesis.
Figure 3
Figure 3
Correlation between the secondary structure and the ability of mutant endscripts to direct RNA synthesis. The amount of RNA synthesis directed by select mutant endscripts are shown as a percentage relative to that of B2(–)26G. (a) Schematic highlighting the nucleotide changes expected to disrupt the RNA secondary structure and their effect on RNA synthesis. (b) Schematic highlighting the nucleotide changes expected to maintain the RNA secondary structure and their effect on RNA synthesis.
Figure 4
Figure 4
Correlation between the predicted stability of RNA secondary structures and their ability to direct RNA synthesis. (a) Schematic of the secondary structures of several endscripts predicted by the mfold program (Jaeger et al., 1989). These structures were selected because they contain stems and loops that are useful to compare with those from B2(–)26G. The amount of synthesis directed by each endscript is shown as a percentage relative to that of B2(–)26G. The ΔG in kcal/mol of the predicted structure was calculated by the mfold program. Endscripts SS1 and SS2, (within the box), denote B2(–)26G RNA derivatives with compensatory nucleotide changes on both sides of the main stem. These were the only two mutant derivatives of B2(–)26G shown here that were significantly debilitated for RNA synthesis. The Other RNA derivatives are described in the legend to Figure 2(b) and in the text. (b) A plot of relative RNA synthesis versus the calculated ΔG value of the predicted secondary structures for all of mutant endscripts tested in this study. The value for B2(–)26G is denoted by a white diamond and the two endscripts with the least and most stable predicted secondary structures able to direct efficient RNA synthesis are indicated by arrows.
Figure 4
Figure 4
Correlation between the predicted stability of RNA secondary structures and their ability to direct RNA synthesis. (a) Schematic of the secondary structures of several endscripts predicted by the mfold program (Jaeger et al., 1989). These structures were selected because they contain stems and loops that are useful to compare with those from B2(–)26G. The amount of synthesis directed by each endscript is shown as a percentage relative to that of B2(–)26G. The ΔG in kcal/mol of the predicted structure was calculated by the mfold program. Endscripts SS1 and SS2, (within the box), denote B2(–)26G RNA derivatives with compensatory nucleotide changes on both sides of the main stem. These were the only two mutant derivatives of B2(–)26G shown here that were significantly debilitated for RNA synthesis. The Other RNA derivatives are described in the legend to Figure 2(b) and in the text. (b) A plot of relative RNA synthesis versus the calculated ΔG value of the predicted secondary structures for all of mutant endscripts tested in this study. The value for B2(–)26G is denoted by a white diamond and the two endscripts with the least and most stable predicted secondary structures able to direct efficient RNA synthesis are indicated by arrows.
Figure 5
Figure 5
Characterization of the structures of endscript B2(–)26G and three mutant derivatives. (a) Change in absorbencies (at A260) as a function of temperature. The absorbencies were recorded as described in Experimental Procedures. The identities of the RNAs are labeled next to the plot for each of the RNAs. (b) One dimensional NMR spectra of B2(–)26G and three mutant derivatives. The RNAs used ranged from 0.2 mM to 0.7 mM and the spectra were taken with a Bruker 600 mHz spectrometer. Similar regions of the spectrum from the samples are shown. The identities of several of the peaks were determined using 2D-NOESY data shown in Figure 1(d) and indicated above the peaks. All of the spectra in the left panel were taken at 30 °C. The spectra in the right-hand panel were taken at 40 °C for B2(–)26G, +3U/A, and +6,7G/C, and at 35 °C for +9G/A.
Figure 6
Figure 6
Effect of temperature on the ability of B2(–)26G and mutant endscripts to direct RNA synthesis. RdRp assays were carried out at 30 °C, 35 °C, 40 °C and 43 °C using B2(–)26G, +3 U/A, +6,7 G/C, and +9 G/A as templates. The amount of RNA synthesis directed by the various endscripts are presented as a percentage compared to B2(–)26G. All results presented are from at least three independent trials and the range for one standard deviation shown by the vertical lines.
Figure 7
Figure 7
Correlation between guanylate substitutions and their effect on RNA synthesis. Guanylates were introduced at the different positions of the template as described in Experimental Procedures. All results are normalized to the amount of RNA synthesis directed by B2(–)26G (100 %). The effect of three independently tested guanylate substitutions on viral RNA synthesis is shown with error bars denoting one standard deviation of the mean. Guanylates present in the wild-type sequence are shown without error bars.
Figure 8
Figure 8
A selection of 60 plus-strand viral RNA templates reveals a propensity against guanylate and cytidylate proximal to the genomic plus-strand initiation site. Genomic minus-strand initiation sequences of the same templates do not exhibit such a preference. Sequence data were obtained from NCBI Entrez. Only plus-sense RNA viruses with complete genomic sequences and with plant tropism were included. For database accession numbers, see Experimental Procedures.
Figure 9
Figure 9
Effect of nucleotide changes on the differential accumulation of BMV RNAs. (a) Comparison of the 3′ minus-strand RNA sequences of BMV. The non-templated guanylate at the 3′ end is shown in lower case g. The arrow denotes the initiation cytidylate. The +4 U/C change in B3(–)26G endscript is shown in bold. (b) RNA synthesis directed by B1(–)26G, B2(–)26G, B3(–)26G and B3(–)+4 U/C. RdRp reaction products were separated by 12 % denaturing PAGE and visualized by autoradiography. The amount of RNA synthesis from various templates relative to B2(–)26G are summarized at the bottom of the autoradiogram. Each number presented is an average from three independent trials.
Figure 10
Figure 10
A model for the synthesis of genomic and subgenomic plus-strand RNAs by the BMV replicase. Schematic representation of BMV RNA3 (not intended to be at correct proportions) with the coding sequences denoted by long rectangles. The untranslated 5′, 3′ and the intercistronic region are shown as lines. The replicase is shown as an oval with the direction of synthesis indicated by an arrow. The replicase binds to the 3′ tRNA-like end of genomic RNA and initiates synthesis of the minus-strand RNA. The nascent strand is shown attached to the replicase. Upon reaching the intercistronic region the replicase could either continue minus-strand synthesis or reverse course to initiate subgenomic plus-strand RNA synthesis in a process that require replicase to use nascent minus-strand as template. The replicase could also pass through the homopolymeric region and complete minus-strand synthesis. Upon reaching the end of the template, the replicase adds a non-templated nucleotide by terminal transferase activity. The 3′ non-templated nucleotide, along with the initiation nucleotide signals the replicase to switch to the nascent-strand to initiate genomic plus-strand synthesis.

Similar articles

Cited by

References

    1. Adkins S., Kao C.C. Subgenomic RNA promoters dictate the mode of recognition by bromoviral RNA-dependent RNA polymerases. Virology. 1998;252:1–8. - PubMed
    1. Adkins S., Siegel R., Sun J.H., Kao C.C. Minimal templates directing accurate initiation of subgenomic RNA synthesis in vitro by the brome mosaic virus RNA-dependent RNA polymerase. RNA. 1997;3:634–647. - PMC - PubMed
    1. Adkins S., Stawicki S.S., Faurote G., Siegel R., Kao C.C. Mechanistic analysis of RNA synthesis by RNA-dependent RNA polymerase from two promoters reveals similarities to DNA-dependent RNA polymerase. RNA. 1998;4:455–470. - PMC - PubMed
    1. Ahlquist P. Bromovirus RNA replication and transcription. Curr. Opin. Genet. Dev. 1992;2:71–76. - PubMed
    1. Ahlquist P., Dasgupta R., Kaesberg P. Near identity of 3′ RNA secondary structure in bromoviruses and cucumber mosaic virus. Cell. 1981;23:183–189. - PubMed

Publication types