. 1999 Dec;10(12):4369-84.
doi: 10.1091/mbc.10.12.4369.

Modulation of endocytic traffic in polarized Madin-Darby canine kidney cells by the small GTPase RhoA

Affiliations
Free PMC article

Modulation of endocytic traffic in polarized Madin-Darby canine kidney cells by the small GTPase RhoA

S M Leung et al. Mol Biol Cell. 1999 Dec.
Free PMC article

Abstract

Efficient postendocytic membrane traffic in polarized epithelial cells is thought to be regulated in part by the actin cytoskeleton. RhoA modulates assemblies of actin in the cell, and it has been shown to regulate pinocytosis and phagocytosis; however, its effects on postendocytic traffic are largely unexplored. To this end, we expressed wild-type RhoA (RhoAWT), dominant active RhoA (RhoAV14), and dominant inactive RhoA (RhoAN19) in Madin-Darby canine kidney (MDCK) cells expressing the polymeric immunoglobulin receptor. RhoAV14 expression stimulated the rate of apical and basolateral endocytosis, whereas RhoAN19 expression decreased the rate from both membrane domains. Polarized basolateral recycling of transferrin was disrupted in RhoAV14-expressing cells as a result of increased ligand release at the apical pole of the cell. Degradation of basolaterally internalized epidermal growth factor was slowed in RhoAV14-expressing cells. Although apical recycling of immunoglobulin A (IgA) was largely unaffected in cells expressing RhoAV14, transcytosis of basolaterally internalized IgA was severely impaired. Morphological and biochemical analyses demonstrated that a large proportion of IgA internalized from the basolateral pole of RhoAV14-expressing cells remained within basolateral early endosomes and was slow to exit these compartments. RhoAN19 and RhoAWT expression had little effect on these postendocytic pathways. These results indicate that in polarized MDCK cells activated RhoA may modulate endocytosis from both membrane domains and postendocytic traffic at the basolateral pole of the cell.


Figures
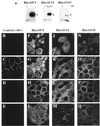
Figure 1
Figure 1
Inducible expression and distribution of myc-tagged RhoAWT, RhoAV14, and RhoAN19 in polarized MDCK cells. (A) RhoAWT, RhoAV14, and RhoAN19 cells were plated at low density in medium containing 0–5 pg/ml DC (− or 5pg/ml) or containing 20 ng/ml DC (+), incubated for 36–48 h, and then plated on Transwell filter supports (with or without DC). After 18 h, the filter-grown cells were solubilized in SDS lysis buffer, 10 μg of lysate was resolved by PAGE, and Western blots were probed with an anti-RhoA mAb to detect induction of the myc-tagged mutant proteins as well as endogenous RhoA. Asterisks indicate that the addition of the myc tag to RhoAWT, RhoAV14, and RhoAN17 causes these proteins to migrate slower than endogenous RhoA. (B–Q) Distribution of ZO-1 and myc-taggedproteins in RhoAV14 cells grown in the presence of 20 ng/ml DC (B–E), RhoAWT cells grown in the absence of DC (F–I), RhoAV14 cells grown in the presence of 5 pg/ml DC (J–M), or RhoAN19 cells grown in the absence of DC (N–Q). Cells were fixed with paraformaldehyde and stained with antibodies that recognize the tight junction protein ZO-1 or the myc tag, and emission from FITC-conjugated secondary antibodies was captured with the use of a scanning laser confocal microscope. Shown are optical sections from the base of the cells (E, I, M, and Q), along the lateral surface of the cells (D, H, L, and P), at the level of the tight junctions (C, G, K, and O), and at the very apex of the cells (B, F, J, and N). The tight junctions are the thin, brightly stained lines that surround each cell. IgA was internalized at the basolateral pole of these cells, but staining for this marker is not shown. Bar, 10 μm.
Figure 2
Figure 2
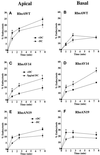
Apical and basolateral endocytosis in RhoAWT, RhoAV14, or RhoAN19 cells. [125I]IgA was bound to the apical (A, C, and E) or basolateral (B, D, and F) surface of the cells for 60 min at 4°C. The RhoAWT (A and B), RhoAV14 (C and D), or RhoAN19 (E and F) cells, cultured in the presence of 20 ng/ml DC (+DC) or 0–5 pg/ml DC (−DC or 5pg/ml DC), were washed and then incubated at 37°C for the times indicated. Medium was collected, and the cells were then rapidly cooled on ice. [125I]IgA was stripped from the cell surface by a sequential treatment of trypsin and acid at 4°C, and the filters were then cut out of their holders. Total [125I]IgA initially bound to the cells included ligand released into the medium, ligand stripped from the cell surface with trypsin and acid, and cell-associated ligand not sensitive to stripping (endocytosed). Shown is the percentage of total ligand endocytosed (mean ± SEM; n ≥ 4). Statistical significance was assessed with the use of a t test. Values for which p < 0.05 are marked with asterisks. Endocytosis values from filters that were never warmed to 37°C were subtracted from the endocytosis values of cells that were allowed to internalize ligand at 37°C.
Figure 3
Figure 3
Postendocytic fate of basolaterally internalized Tf in RhoAWT, RhoAV14, or RhoAN19 cells. [125I]Tf was internalized from the basolateral pole of the cell for 45 min at 37°C. The cells were then washed at 4°C and warmed for 2.5 min at 37°C to allow for receptor internalization, and the postendocytic fate of internalized [125I]Tf was determined in a 120-min chase at 37°C. The percentage of ligand released basolaterally (recycled) or released apically (transcytosed) in RhoAWT (A), RhoAV14 (B), or RhoAN19 (C) cells is shown. Values for degradation were as follows: RhoAWT + DC, 1.9 ± 0.2%; RhoAWT − DC, 1.9 ± 0.1%; RhoAV14 + DC, 1.9 ± 0.4%; RhoAV14 + 5 pg/ml DC, 2.6 ± 0.2%; RhoAN19 + DC, 2.6 ± 0.3%; RhoAN19 − DC, 3.0 ± 0.2%. Values for ligand remaining cell associated were as follows: RhoAWT + DC, 1.5 ± 0.2%; RhoAWT − DC, 1.4 ± 0.1%; RhoAV14 + DC, 2.3 ± 0.5%; RhoAV14 + 5 pg/ml DC, 10.3 ± 2.1%; RhoAN19 + DC, 3.1 ± 0.3%; RhoAN19 − DC, 3.0 ± 0.8%. Values (mean ± SD; n = 3) are from a representative experiment. (A and C) ■, +DC, transcytosed; ●, +DC, recycled; ▴, −DC, transcytosed; ♦, −DC, recycled. (B) ■, +DC, transcytosed; ●, +DC, recycled; ▴, 5 pg/ml DC, transcytosed; ♦, 5 pg/ml DC, recycled.
Figure 4
Figure 4
Postendocytic fate of basolaterally internalized EGF in RhoAWT, RhoAV14, or RhoAN19 cells. [125I]EGF was internalized from the basolateral surface of cells for 10 min at 37°C, and the cells were quickly washed and then chased for 120 min. The percentage of total degraded ligand released from RhoAWT (A), RhoAV14 (B), or RhoAN19 (C) cells is shown. Values for transcytosis were as follows: RhoAWT + DC, 10.1 ± 0.4%; RhoAWT − DC, 11.1 ± 1.0%; RhoAV14 + DC, 9.0 ± 1.0%; RhoAV14 + 5 pg/ml DC, 11.5 ± 2.3%; RhoAN19 + DC, 9.2 ± 0.7%; RhoAN19 − DC, 12.5 ± 3.3%. Values for ligand recycling were as follows: RhoAWT + DC, 19.4 ± 1.2%; RhoAWT − DC, 17.9 ± 1.3%; RhoAV14 + DC, 22.7 ± 0.5%; RhoAV14 + 5 pg/ml DC, 24.6 ± 2.8%; RhoAN19 + DC, 16.8 ± 0.7%; RhoAN19 − DC, 17.1 ± 0.9%. Values for ligand remaining cell associated were as follows: RhoAWT + DC, 5.0 ± 0.8%; RhoAWT − DC, 4.8 ± 0.3%; RhoAV14 + DC, 2.8 ± 0.5%; RhoAV14 + 5 pg/ml DC, 6.6 ± 1.2%; RhoAN19 + DC, 13.2 ± 5.1%; RhoAN19 − DC, 10.3 ± 3.0%. Values (mean ± SD; n = 3) are from a representative experiment. (A and C) ■, +DC; ●, −DC. (B) ■, +DC; ●, 5 pg/ml DC.
Figure 5
Figure 5
Postendocytic fate of apically internalized IgA in RhoAWT, RhoAV14, or RhoAN19 cells. [125I]IgA was internalized from the apical surface of cells for 10 min at 37°C, and the cells were quickly washed and then chased for 120 min. The percentage of total ligand released apically (recycled) or basolaterally (transcytosed) in RhoAWT (A), RhoAV14 (B), or RhoAN19 (C) cells is shown. Values for degradation were as follows: RhoAWT + DC, 5.9 ± 0.5%; RhoAWT − DC, 5.3 ± 0.3%; RhoAV14 + DC, 5.0 ± 0.8%; RhoAV14 + 5 pg/ml DC, 5.7 ± 1.3%; RhoAN19 + DC, 4.2 ± 0.8%; RhoAN19 − DC, 3.5 ± 1.6%. Values for ligand remaining cell associated were as follows: RhoAWT + DC, 12.6 ± 2.1%; RhoAWT − DC, 12.7 ± 1.3%; RhoAV14 + DC, 7.9 ± 2.0%; RhoAV14 + 5 pg/ml DC, 7.3 ± 0.3%; RhoAN19 + DC, 8.5 ± 1.9%; RhoAN19 − DC, 4.2 ± 0.5%. Values (mean ± SD; n = 3) are from a representative experiment. (A and C) ■, +DC, recycled; ●, +DC, transcytosed; ▴, −DC, recycled; ♦, −DC, transcytosed. (B) ■, +DC, recycled; ●, +DC, transcytosed; ▴, 5 pg/ml DC, recycled; ♦, 5 pg/ml DC, transcytosed.
Figure 6
Figure 6
Postendocytic fate of basolaterally internalized IgA in RhoAWT, RhoAV14, or RhoAN19 cells. [125I]IgA was internalized from the basolateral surface of cells for 5 min at 37°C, and the cells were quickly washed and then chased for 120 min. The percentage of total ligand released basolaterally (recycled) or apically (transcytosed) in RhoAWT (A), RhoAV14 (B), or RhoAN19 (C) cells is shown. Values for degradation were as follows: RhoAWT + DC, 5.3 ± 0.7%; RhoAWT − DC, 5.8 ± 0.5%; RhoAV14 + DC, 5.8 ± 0.5%; RhoAV14 + 5 pg/ml DC, 13.6 ± 0.8%; RhoAN19 + DC, 6.3 ± 0.6%; RhoAN19 − DC, 6.4 ± 0.5%. Values for ligand remaining cell associated were as follows: RhoAWT + DC, 8.1 ± 0.2%; RhoAWT − DC, 9.1 ± 1.3%; RhoAV14 + DC, 5.7 ± 1.0%; RhoAV14 + 5 pg/ml DC, 19.4 ± 1.0%; RhoAN19 + DC, 2.5 ± 0.2%; RhoAN19 − DC, 3.0 ± 0.4%. Values (mean ± SD; n = 3) are from a representative experiment. (A and C) ■, +DC, transcytosed; ●, +DC, recycled; ▴, −DC, transcytosed; ♦, −DC, recycled. (B) ■, +DC, transcytosed; ●, +DC, recycled; ▴, 5 pg/ml DC, transcytosed; ♦, 5 pg/ml DC, recycled.
Figure 7
Figure 7
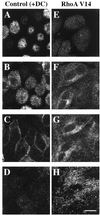
Distribution of basolaterally internalized IgA in RhoAV14 cells. RhoAV14 cells were grown in the presence of 20 ng/ml DC (A–D) or 5 pg/ml DC (E–H). IgA was internalized from the basolateral pole of the cell for 10 min at 37°C, and the cells were washed quickly and then chased in ligand-free medium for 5 min at 37°C. The cells were fixed with paraformaldehyde, incubated with rabbit anti-IgA antibody and a myc tag–specific mAb, and then reacted with fluorescently labeled secondary antibodies. Only staining for IgA is shown. Single optical sections, obtained with a confocal microscope, are shown from the base of the cell (D and H), the lateral surfaces of the cell at the level of the nucleus (C and G), 2 μm above the previous section (B and F), and at the apex of the cell (A and E). Bar, 10 μm.
Figure 8
Figure 8
Distribution of basolaterally internalized IgA and endogenous RhoA or myc-tagged RhoAV14. RhoAV14 cells were grown in the presence of 5 pg/ml DC (A–C) or 20 ng/ml DC (D–F). IgA was internalized from the basolateral pole of the cell for 10 min at 37°C, and cell surface ligand was removed by chasing in ligand-free medium for 5 min at 37°C (A–C) or by trypsin treatment at 4°C (D–F). The cells were fixed with paraformaldehyde, incubated with rabbit anti-IgA antibody (A–F) and a myc tag–specific mAb (A–C) or a monoclonal anti-RhoA antibody (D–F), and then reacted with goat anti-rabbit Cy5 and goat anti-mouse FITC secondary antibodies. Panel A is identical to panel H in Figure 7, and panel B is identical to panel M in Figure 1. In the latter case, the contrast was enhanced and the image brightened to demonstrate colocalization of myc-tagged RhoAV14 and IgA. Examples of IgA and endogenous RhoA or myc-tagged RhoAV14 colocalization are marked with arrows. Bar, 10 μm.
Figure 9
Figure 9
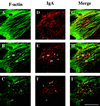
Distribution of IgA and F-actin in cells expressing RhoAV14. IgA was internalized for 10 min at 37°C from the basolateral surface of RhoAV14 cells grown in the presence of 5 pg/ml DC and then washed and chased for 5 min at 37°C. Cells were fixed with paraformaldehyde, incubated with rabbit anti-IgA antibody, and then reacted with goat anti-rabbit Cy5 secondary antibody and FITC-phalloidin. The FITC and Cy5 emissions were captured simultaneously with the use of a scanning laser confocal microscope. Single optical sections were taken at the very base of the cell (C, F, and I), 1 μm above the previous section (B, E, and H), and at a focal plane where the phalloidin-labeled stress fibers appeared maximally in focus (A, D, and G). Examples of IgA and F-actin colocalization are marked with arrows. Bar, 10 μm.
Figure 10
Figure 10
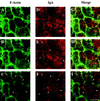
Distribution of IgA and F-actin in RhoAV14 grown in the presence of 20 ng/ml DC. IgA was internalized for 10 min at 37°C from the basolateral surface of RhoAV14 cells grown in the presence of 20 ng/ml DC, and the cell surface ligand was removed by trypsin treatment at 4°C. Cells were fixed with paraformaldehyde, incubated with rabbit anti-IgA antibody, and then reacted with goat anti-rabbit Cy5 secondary antibody and FITC-phalloidin. The FITC and Cy5 emissions were captured simultaneously with the use of a scanning laser confocal microscope. Single optical sections were taken at the very base of the cell (C, F, and I), 1 μm above the previous section (B, E, and H), and at a focal plane where the phalloidin-labeled stress fibers appeared maximally in focus (A, D, and G). Examples of IgA and F-actin colocalization are marked with arrows. Bar, 10 μm.
Figure 11
Figure 11
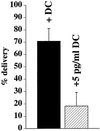
Quantification of IgA delivery to apical endosomes in RhoAV14 cells. [125I]IgA was internalized basolaterally for 10 min at 37°C, whereas WGA-HRP was cointernalized from the apical surface of RhoAV14 cells grown in the presence of 20 ng/ml DC (+DC) or 5 pg/ml DC (+5 pg/ml DC). Details of the DAB reaction and quantitation are given in MATERIALS AND METHODS. Values (mean ± SD; n = 3) are from a representative experiment.

Similar articles

Cited by

References

    1. Adam T, Giry M, Boquet P, Sansonetti P. Rho-dependent membrane folding causes Shigella entry into epithelial cells. EMBO J. 1996;15:3315–3321. - PMC - PubMed
    1. Adamson P, Paterson HF, Hall A. Intracellular localization of the p21rho proteins. J Cell Biol. 1992;119:617–627. - PMC - PubMed
    1. Apodaca G, Bomsel M, Arden J, Breitfeld PP, Tang K, Mostov KE. The polymeric immunoglobulin receptor: a model protein to study transcytosis. J Clin Invest. 1991;87:1877–1882. - PMC - PubMed
    1. Apodaca G, Cardone MH, Whiteheart SW, DasGupta BR, Mostov KE. Reconstitution of transcytosis in SLO-permeabilized MDCK cells: existence of an NSF dependent fusion mechanism with the apical surface of MDCK cells. EMBO J. 1996;15:1471–1481. - PMC - PubMed
    1. Apodaca G, Katz LA, Mostov KE. Receptor-mediated transcytosis of IgA in MDCK cells is via apical recycling endosomes. J Cell Biol. 1994;125:67–86. - PMC - PubMed

Publication types

LinkOut - more resources