. 1999 Nov;73(11):9089-97.
doi: 10.1128/JVI.73.11.9089-9097.1999.

Human immunodeficiency virus type 1-induced hematopoietic inhibition is independent of productive infection of progenitor cells in vivo

Affiliations

Human immunodeficiency virus type 1-induced hematopoietic inhibition is independent of productive infection of progenitor cells in vivo

P S Koka et al. J Virol. 1999 Nov.

Abstract

Human immunodeficiency virus (HIV)-infected individuals exhibit a variety of hematopoietic dysfunctions. The SCID-hu mouse (severe combined immunodeficient mouse transplanted with human fetal thymus and liver tissues) can be used to model the loss of human hematopoietic precursor cell function following HIV infection and has a distinct advantage in that data can be obtained in the absence of confounding factors often seen in infected humans. In this study, we establish that HIV type 1 (HIV-1) bearing a reporter gene inserted into the viral vpr gene is highly aggressive in depleting human myeloid and erythroid colony-forming precursor activity in vivo. Human CD34(+) progenitor cells can be efficiently recovered from infected implants yet do not express the viral reporter gene, despite severe functional defects. Our results indicate that HIV-1 infection alone leads to hematopoietic inhibition in vivo; however, this effect is due to indirect mechanisms rather than to direct infection of CD34(+) cells in vivo.


Figures
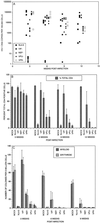
FIG. 1
FIG. 1
(A) Replicative ability of HIV-1 accessory gene mutants in Thy/Liv implants. Each symbol represents viral load (number of copies of HIV DNA per 100,000 cells) from a single Thy/Liv implant, as determined by quantitative PCR. (B) Percentages of total CD4+ (combined CD4+ CD8 and CD4+ CD8+) cells present in SCID-hu Thy/Liv implants shown in panel A at different times postinfection as determined by three-color flow cytometry. The implants were directly infected with different HIV-1 accessory gene mutants. The cells were stained with anti-CD4-PE, anti-CD8-FITC, and anti-CD3-PerCP monoclonal antibodies. (C) Myeloid and erythroid CFA of total cells (5 × 10⁶) derived from SCID-hu Thy/Liv implants, either mock infected, HIV-1NL4-3 infected, or infected with HIV-1 accessory gene mutants as indicated. Zidovudine (1 μg/ml) was also included in the methylcellulose to prevent the possibility of virus spread in the culture medium. The number of animals are as indicated in panel A.
FIG. 2
FIG. 2
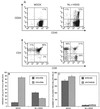
(A) Cell surface expression of the HSA (CD24) antigen by flow cytometry. Single-cell suspensions from mock-infected or NL-r-HSAS-infected implants obtained in experiment 1 (4.5 weeks postinfection) were costained with anti-CD24-PE and anti-CD45-FITC, the latter antibody to establish that viral expression was occurring in human cells of the Thy/Liv implants. Cells were also costained in parallel with anti-CD4-PE and anti-CD8-FITC, to determine whether CD4+ cell depletion was induced. In the NL-r-HSAS infected implant represented here, we observed a maximum 12% of the human cells expressed virus (CD24+ CD45+) (top); depletion of CD4+ CD8+ cells was observed in the same infected animal (bottom). The percentage of each cell subpopulation is denoted in the histogram quadrants. The second animal infected in parallel showed up to 9% cells expressing HSA and similar thymocyte depletion (not shown). (B) Depletion of CD4+ CD8+ thymocytes after infection with NL-r-HSAS, 4.5 weeks postinfection from experiment 1 (two animals). The percentage of each of the cell populations was determined by flow cytometry as described for Fig. 1A. Data from experiment 2 are similar and hence not shown. (C) Inhibition of myeloid and erythroid CFA of SCID-hu Thy/Liv implants infected with NL-r-HSAS, 4.5 weeks postinfection. Two mock-infected and two virus-infected implants were compared for CFA as indicated (experiment 1). Similar data from experiment 2 are summarized in Table 1.
FIG. 3
FIG. 3
(A) HSA expression in cells derived from NL-r-HSAS-infected SCID-hu Thy/Liv implants compared to mock-infected implants from experiment 1 (4.5 weeks postinfection). Each panel depicts the proportion of infected cells either before (left) or after (right) CD3 depletion. The data suggest that most of the HSA expression lies in the depleted thymocytes. The dark line in each of the two histograms represents the NL-r-HSAS-infected cells, and the dashed line represents the mock-infected cells. (B) Analysis of HSA expression in the CD34-enriched population. The top row represents the CD34-enriched cell populations following sorting from a mock-infected (left) and two NL-r-HSAS-infected (center and right) Thy/Liv implants 4.5 weeks postinfection from experiment 1. Before sorting, the CD3-depleted cells were stained with anti-CD34-PE, anti-CD38-APC, and anti-CD24 (HSA)-FITC monoclonal antibodies. Following sorting, due to the relatively low number of CD34+ cells in the implants, approximately 50% of the sorted cells expressed CD34. The entire population shown in the top row is referred to in the text as CD34 enriched, and the true CD34+ cells are represented in the upper right quadrants of the upper panels. Totals of 7 and 9% of these CD34-enriched cells from the two infected implants were positive for HSA expression (middle and right) as indicated. Backgating on these CD34+ cells revealed that these cells were actually HSA (CD24) negative (bottom row). Numbers in the quadrants (top row) or denoted above the gates (middle row) indicate the percentage of cells in the particular region. The numbers in the lower panels indicate percentages of true CD34+ cells expressing HSA, as determined by the backgating analyses. Similar data from experiment 2 are summarized in Tables 2 and 3. (C) Quantitative DNA PCR analyses of NL-r-HSAS infection. Total or CD34-enriched Thy/Liv cells from the two NL-r-HSAS-infected animals from experiment 1 were analyzed at 4.5 weeks postinfection for HIV proviral sequences and for cellular (β-globin) sequences in parallel with control standards. Relative proviral burden, as determined by radioanalytic imaging, is shown below each sample band. PCR data from experiment 2 are stated in the text.
FIG. 3
FIG. 3
(A) HSA expression in cells derived from NL-r-HSAS-infected SCID-hu Thy/Liv implants compared to mock-infected implants from experiment 1 (4.5 weeks postinfection). Each panel depicts the proportion of infected cells either before (left) or after (right) CD3 depletion. The data suggest that most of the HSA expression lies in the depleted thymocytes. The dark line in each of the two histograms represents the NL-r-HSAS-infected cells, and the dashed line represents the mock-infected cells. (B) Analysis of HSA expression in the CD34-enriched population. The top row represents the CD34-enriched cell populations following sorting from a mock-infected (left) and two NL-r-HSAS-infected (center and right) Thy/Liv implants 4.5 weeks postinfection from experiment 1. Before sorting, the CD3-depleted cells were stained with anti-CD34-PE, anti-CD38-APC, and anti-CD24 (HSA)-FITC monoclonal antibodies. Following sorting, due to the relatively low number of CD34+ cells in the implants, approximately 50% of the sorted cells expressed CD34. The entire population shown in the top row is referred to in the text as CD34 enriched, and the true CD34+ cells are represented in the upper right quadrants of the upper panels. Totals of 7 and 9% of these CD34-enriched cells from the two infected implants were positive for HSA expression (middle and right) as indicated. Backgating on these CD34+ cells revealed that these cells were actually HSA (CD24) negative (bottom row). Numbers in the quadrants (top row) or denoted above the gates (middle row) indicate the percentage of cells in the particular region. The numbers in the lower panels indicate percentages of true CD34+ cells expressing HSA, as determined by the backgating analyses. Similar data from experiment 2 are summarized in Tables 2 and 3. (C) Quantitative DNA PCR analyses of NL-r-HSAS infection. Total or CD34-enriched Thy/Liv cells from the two NL-r-HSAS-infected animals from experiment 1 were analyzed at 4.5 weeks postinfection for HIV proviral sequences and for cellular (β-globin) sequences in parallel with control standards. Relative proviral burden, as determined by radioanalytic imaging, is shown below each sample band. PCR data from experiment 2 are stated in the text.

Similar articles

Cited by

References

    1. Aldrovandi G M, Feuer G, Gao L, Kristeva M, Chen I S Y, Jamieson B, Zack J A. HIV-1 infection of the SCID-hu mouse: an animal model for virus pathogenesis. Nature. 1993;363:732–736. - PubMed
    1. Aldrovandi G M, Zack J A. Replication and pathogenicity of human immunodeficiency virus type 1 accessory gene mutants in SCID-hu mice. J Virol. 1996;70:1505–1511. - PMC - PubMed
    1. Bijl J, van Oostveen J W, Kreike M, Rieger E, van der Raaij-Helmer L M, Walboomers J M, Corte G, Boncinelli E, van den Brule A J, Meijer C J. Expression of HOXC4, HOXC5, and HOXC6 in human lymphoid cell lines, leukemias, and benign and malignant lymphoid tissue. Blood. 1996;87:1737–1745. - PubMed
    1. Bonyhadi M L, Rabin L, Salimi S, Brown D A, Kosek J, McCune J M, Kaneshima H. HIV induces thymus depletion in vivo. Nature. 1993;363:728–732. - PubMed
    1. Burstein Y, Rashbaum W K, Hatch W C, Calvelli T, Golodner M, Soeiro R, Lyman W D. Alterations in human fetal hematopoiesis are associated with maternal HIV infection. Pediatr Res. 1992;32:155–159. - PubMed

Publication types

Substances