. 1999 Nov;73(11):8999-9010.
doi: 10.1128/JVI.73.11.8999-9010.1999.

SPI-1-dependent host range of rabbitpox virus and complex formation with cathepsin G is associated with serpin motifs

Affiliations

SPI-1-dependent host range of rabbitpox virus and complex formation with cathepsin G is associated with serpin motifs

K B Moon et al. J Virol. 1999 Nov.

Abstract

Serpins are a superfamily of serine proteinase inhibitors which function to regulate a number of key biological processes including fibrinolysis, inflammation, and cell migration. Poxviruses are the only viruses known to encode functional serpins. While some poxvirus serpins regulate inflammation (myxoma virus SERP1 and cowpox virus [CPV] crmA/SPI-2) or apoptosis (myxoma virus SERP2 and CPV crmA/SPI-2), the function of other poxvirus serpins remains unknown. The rabbitpox virus (RPV) SPI-1 protein is 47% identical to crmA and shares all of the serpin structural motifs. However, no serpin-like activity has been demonstrated for SPI-1 to date. Earlier we showed that RPV with the SPI-1 gene deleted, unlike wild-type virus, fails to grow on A549 or PK15 cells (A. Ali, P. C. Turner, M. A. Brooks, and R. W. Moyer, Virology 202:306-314, 1994). Here we demonstrate that in the absence of a functional SPI-1 protein, infected nonpermissive cells which exhibit the morphological features of apoptosis fail to activate terminal caspases or cleave the death substrates PARP or lamin A. We show that SPI-1 forms a stable complex in vitro with cathepsin G, a member of the chymotrypsin family of serine proteinases, consistent with serpin activity. SPI-1 reactive-site loop (RSL) mutations of the critical P1 and P14 residues abolish this activity. Viruses containing the SPI-1 RSL P1 or P14 mutations also fail to grow on A549 or PK15 cells. These results suggest that the full virus host range depends on the serpin activity of SPI-1 and that in restrictive cells SPI-1 inhibits a proteinase with chymotrypsin-like activity and may function to inhibit a caspase-independent pathway of apoptosis.


Figures

FIG. 1
FIG. 1
Construction of the SPI-1 shuttle vector. (A) Source of the primers used to amplify the left and right flanks of SPI-1 for construction of the shuttle vector pKMSPI-1. This plasmid was used to replace the wt SPI-1 gene with the selectable marker eco-gpt or each of the three SPI-1 site-directed mutant genes in the RPV genome. The SPI-1 ORF beginning with nucleotide 1 and ending with nucleotide 1074 is designated by a black box. The left flanking sequence of the SPI-1 gene begins at nucleotide −235 and extends to nucleotide 1 of the SPI-1 ORF. The right flanking sequence of SPI-1 begins at the first nucleotide following the SPI-1 ORF and extends to nucleotide +522. SPI-1 left and right flanks are designated by hatched boxes. (B) Schematic of the SPI-1 shuttle vector, pKMSPI-1. A removable cassette containing either the E. coli gpt gene driven by the vaccinia virus P7.5 promoter, the wt SPI-1 gene, or each of the SPI-1 site-directed mutant genes was cloned between the left and right flanks of SPI-1. The locations of the relevant restriction sites are shown.
FIG. 2
FIG. 2
Caspase 3 activity and cleavage of PARP and lamin A in infected cell extracts (A) 35S-labeled PARP was expressed in the TNT system and incubated with extracts prepared from infected A549 or LLC-PK1 cells 14 h postinfection for 90 min at 37°C. The proteins were resolved by SDS-PAGE, and radiolabeled proteins were visualized by autoradiography. The solid arrow indicates the intact molecule, and the dashed arrows indicate the 85- and 30-kDa cleavage products. (B) Extracts prepared from A549 or LLC-PK1 cells at 14 h postinfection were mixed with 35S-labeled human lamin A prepared in the TNT system and incubated for 90 min at 37°C. Proteins were separated on SDS–10% polyacrylamide gels, and radiolabeled proteins were visualized by autoradiography. The solid arrow indicates the intact molecule, and the dashed arrow indicates the 30-kDa cleavage product. (C) LLC-PK1 cells were mock infected or infected with wtCPV or CPVΔcrmA and A549 cells were mock infected or infected with wtRPV or RPVΔSPI-1. Extracts prepared from infected cells harvested at 14 h postinfection were incubated with a fluorogenic caspase 3 substrate (Ac-DEVD-AMC). Fluorescence readings were taken at the indicated times and plotted as relative fluorescence units.
FIG. 2
FIG. 2
Caspase 3 activity and cleavage of PARP and lamin A in infected cell extracts (A) 35S-labeled PARP was expressed in the TNT system and incubated with extracts prepared from infected A549 or LLC-PK1 cells 14 h postinfection for 90 min at 37°C. The proteins were resolved by SDS-PAGE, and radiolabeled proteins were visualized by autoradiography. The solid arrow indicates the intact molecule, and the dashed arrows indicate the 85- and 30-kDa cleavage products. (B) Extracts prepared from A549 or LLC-PK1 cells at 14 h postinfection were mixed with 35S-labeled human lamin A prepared in the TNT system and incubated for 90 min at 37°C. Proteins were separated on SDS–10% polyacrylamide gels, and radiolabeled proteins were visualized by autoradiography. The solid arrow indicates the intact molecule, and the dashed arrow indicates the 30-kDa cleavage product. (C) LLC-PK1 cells were mock infected or infected with wtCPV or CPVΔcrmA and A549 cells were mock infected or infected with wtRPV or RPVΔSPI-1. Extracts prepared from infected cells harvested at 14 h postinfection were incubated with a fluorogenic caspase 3 substrate (Ac-DEVD-AMC). Fluorescence readings were taken at the indicated times and plotted as relative fluorescence units.
FIG. 3
FIG. 3
Comparison of the SPI-1 RSL with inhibitory and noninhibitory serpins. A diagram of a typical serpin showing the location of the RSL is shown at the bottom of the figure. An alignment of the reactive site loops of selected cellular or viral serpins is shown, along with the proteinase(s) targeted by each serpin. Sequences begin with the P14 residue of each serpin and terminate with the conserved PF residues at the end of the motif. P1 residues are shown in bold and underlined. Serpin PI-6 is known to have two P1 residues. The predicted P1 amino acid of SPI-1 is also shown. Critical amino acid motif regions among serpins are boxed. Abbreviations: MYX, myxoma virus; ACT, antichymotrypsin; AT, antitrypsin; OVAL, ovalbumin; ANG, Angiotensinogen; tPA, tissue plasminogen activator. Of the serpins shown, only OVAL and ANG are noninhibitory serpins.
FIG. 4
FIG. 4
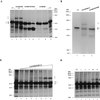
Target proteinase specificity of SPI-1. (A) 35S-labeled SPI-1 (prepared by in vitro transcription and translation with the TNT system) was incubated with buffer alone (lanes 1 and 9), 200 nM cathepsin G (lane 2), 600 nM cathepsin G (lane 3), 60 nM chymotrypsin (lane 4), 200 nM chymotrypsin (lane 5), 600 nM chymotrypsin (lane 6), 200 nM mast cell chymase (lane 7), or 600 nM mast cell chymase (lane 8). Reaction mixtures were incubated at 37°C for 90 min. Radiolabeled proteins were visualized following SDS-PAGE and autoradiography. (B) 35S-labeled His-tagged SPI-1 prepared in the TNT system was incubated with buffer alone (lane 1) or with 200 nM cathepsin G (lane 2) or chymotrypsin (lane 3) for 15 min at 37°C. His-tagged products were purified by binding to His-Bind resin, and purified products were detected following SDS-PAGE and autoradiography. (C) 35S-labeled SPI-1 (1 μl of a 50-μl TNT reaction mixture) was incubated with buffer alone (lane 1) or with threefold-increasing concentrations of cathepsin G ranging from 2 nM (lane 2) to 2 μM (lane 8) for 90 min at 37°C. (D) 35S-labeled SPI-1 (1 μl of a 50-μl TNT reaction mixture) was incubated with buffer alone (lane 1) or with 200 nM cathepsin G for 1 (lane 2), 2 (lane 3), 5 (lane 4), 10 (lane 5), 15 (lane 6), 30 (lane 7), or 60 (lane 8) min at 37°C. Proteins were resolved on SDS–10% polyacrylamide gels, and radiolabeled proteins were visualized by autoradiography. Uncleaved SPI-1 and SPI-1 cleaved within the RSL are indicated by solid and dashed arrows, respectively. High-molecular-mass bands indicating the formation of SDS-stable complexes between SPI-1 and cathepsin G are designated by brackets.
FIG. 5
FIG. 5
Reaction of SPI-1 with cathepsin G in the presence of the competing serpin antichymotrypsin 35S-labeled SPI-1 prepared in the TNT system was incubated with buffer (lane 1) or with 200 nM cathepsin G in the absence (lane 2) or presence of 3-fold increasing concentrations of antichymotrypsin ranging from 20 nM (lane 3) to 20 μM (lane 9). Reactions were performed at 37°C for 90 min. Proteins were resolved on SDS–10% polyacrylamide gels, and radiolabeled proteins were visualized by autoradiography. Uncleaved SPI-1 is visible as a ∼45-kDa band in lane 1 (solid arrow). SPI-1 cleaved within the RSL appears as a ∼40-kDa band (dashed arrow), while higher-molecular-mass bands representing SDS-stable complexes with cathepsin G (brackets) are present in lanes 2 to 4.
FIG. 6
FIG. 6
Stability of the SPI-1–cathepsin G complex 35S-labeled SPI-1 prepared in the TNT system (lane 1) was preincubated in the presence of 200 nM cathepsin G for 60 min at 37°C (P.I., lane 2) to allow complex formation. Following the 1-h preincubation, antichymotrypsin was added in excess to a final concentration of 2 μM to quench any unreacted cathepsin G and the reaction mixture was incubated for another 24 h at 37°C. Samples were removed at 1 (lane 3), 2 (lane 4), 3 (lane 5), 4 (lane 6), 5 (lane 7), 6 (lane 8), 7 (lane 9), 8 (lane 10), 9 (lane 11), and 24 (lane 12) h after the addition of antichymotrypsin, and the proteins were resolved on an SDS–10% polyacrylamide gel. Radiolabeled proteins were visualized by autoradiography. High-molecular-mass bands representing the complex between SPI-1 and cathepsin G are indicated by brackets. After exposure to film, the counts in the high-molecular-mass bands representing the complex between SPI-1 and cathepsin G in lanes 3 to 12 of the gel were measured with a PhosphorImager. PhosphorImager measurements from three separate experiments were averaged and are expressed graphically in log units versus time (inset).
FIG. 7
FIG. 7
Site-directed mutagenesis of the SPI-1 RSL and effect on complex formation 35S-labeled wt SPI-1 (A), N321A/F322A/S323A (B), F322A (C), and T309R (D) were prepared in the TNT system and assayed alone (lanes 1) or with threefold-increasing concentrations of cathepsin G ranging from 2 nM (lanes 2) to 6 μM (lanes 9). Reaction mixtures were incubated at 37°C for 90 min. The proteins were separated on SDS–10% polyacrylamide gels, and radiolabeled proteins were visualized by autoradiography. High-molecular-mass complexes between wt SPI-1 and cathepsin G are indicated by brackets. Intact and cleaved forms of wt or mutant SPI-1 are designated by a solid arrow and a dashed arrow, respectively.
FIG. 8
FIG. 8
Host range of wtRPV and RPV SPI-1 mutants. Plaque formation of wt RPV and RPV recombinants on RK13, A549, and PK15 cell lines is shown. The plaque assays were performed as described in Materials and Methods.
FIG. 9
FIG. 9
DAPI staining of cells infected with wtRPV and RPV SPI-1 mutants. A549 cells were mock infected with medium alone or infected with wtRPV, RPVΔSPI-1, RPV SPI-1 N321A/F322A/S323A, RPV SPI-1 N322A, or RPV SPI-1 T309R at an MOI of 10. Cells were stained with DAPI 18 h after infection to display the cellular DNA and nuclear morphology. Arrowheads indicate condensed nuclei.

Similar articles

Cited by

References

    1. Ali A N, Turner P C, Brooks M A, Moyer R W. The SPI-1 gene of rabbitpox virus determines host range and is required for hemorrhagic pock formation. Virology. 1994;202:306–314. - PubMed
    1. Boyle D B, Coupar B E. A dominant selectable marker for the construction of recombinant poxviruses. Gene. 1988;65:123–128. - PubMed
    1. Brooks M A, Ali A N, Turner P C, Moyer R W. A rabbitpox virus serpin gene controls host range by inhibiting apoptosis in restrictive cells. J Virol. 1995;69:7688–7698. - PMC - PubMed
    1. Buller R M, Palumbo G J. Poxvirus pathogenesis. Microbiol Rev. 1991;55:80–122. - PMC - PubMed
    1. Bump N J, Hackett M, Hugunin M, Seshagriri S, Brady K, Chen P, Ferenz C, Franklin S, Ghayur T, Licari L P P, Mankovich J, Shi L, Greenberg A H, Miller L K, Wong W W. Inhibition of the ICE family proteases by baculovirus antiapoptotic protein p35. Science. 1995;269:1885–1888. - PubMed

Publication types

MeSH terms