

DNA copy number losses in human neoplasms
- PMID: 10487825
- PMCID: PMC1866903
- DOI: 10.1016/S0002-9440(10)65166-8
DNA copy number losses in human neoplasms
Abstract
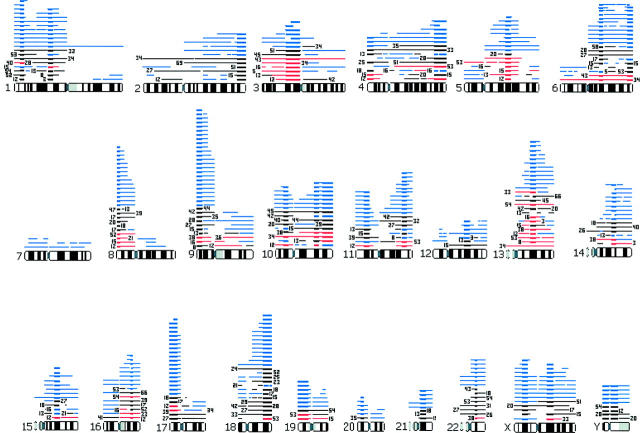
This review summarizes reports of recurrent DNA sequence copy number losses in human neoplasms detected by comparative genomic hybridization. Recurrent losses that affect each of the chromosome arms in 73 tumor types are tabulated from 169 reports. The tables are available online at http://www.amjpathol.org and http://www. helsinki.fi/ approximately lglvwww/CMG.html. The genes relevant to the lost regions are discussed for each of the chromosomes. The review is supplemented also by a list of known and putative tumor suppressor genes and DNA repair genes (see Table 1, online). Losses are found in all chromosome arms, but they seem to be relatively rare at 1q, 2p, 3q, 5p, 6p, 7p, 7q, 8q, 12p, and 20q. Losses and their minimal common overlapping areas that were present in a great proportion of the 73 tumor entities reported in Table 2 (see online) are (in descending order of frequency): 9p23-p24 (48%), 13q21 (47%), 6q16 (44%), 6q26-q27 (44%), 8p23 (37%), 18q22-q23 (37%), 17p12-p13 (34%), 1p36.1 (34%), 11q23 (33%), 1p22 (32%), 4q32-qter (31%), 14q22-q23 (25%), 10q23 (25%), 10q25-qter (25%),15q21 (23%), 16q22 (23%), 5q21 (23%), 3p12-p14 (22%), 22q12 (22%), Xp21 (21%), Xq21 (21%), and 10p12 (20%). The frequency of losses at chromosomes 7 and 20 was less than 10% in all tumors. The chromosomal regions in which the most frequent losses are found implicate locations of essential tumor suppressor genes and DNA repair genes that may be involved in the pathogenesis of several tumor types.
Figures
Comment in
-
Online access to CGH data of DNA sequence copy number changes.Am J Pathol. 2000 Aug;157(2):689. doi: 10.1016/S0002-9440(10)64579-8. Am J Pathol. 2000. PMID: 10934171 Free PMC article. No abstract available.
Similar articles
-
DNA copy number amplifications in human neoplasms: review of comparative genomic hybridization studies.Am J Pathol. 1998 May;152(5):1107-23. Am J Pathol. 1998. PMID: 9588877 Free PMC article. Review.
-
Genomic aberrations in carcinomas of the uterine corpus.Genes Chromosomes Cancer. 2004 Jul;40(3):229-46. doi: 10.1002/gcc.20038. Genes Chromosomes Cancer. 2004. PMID: 15139002
-
Overrepresentation of 3q and 8q material and loss of 18q material are recurrent findings in advanced human ovarian cancer.Genes Chromosomes Cancer. 1996 May;16(1):46-54. doi: 10.1002/(SICI)1098-2264(199605)16:1<46::AID-GCC7>3.0.CO;2-3. Genes Chromosomes Cancer. 1996. PMID: 9162197
-
Array CGH identifies distinct DNA copy number profiles of oncogenes and tumor suppressor genes in chromosomal- and microsatellite-unstable sporadic colorectal carcinomas.J Mol Med (Berl). 2007 Mar;85(3):293-304. doi: 10.1007/s00109-006-0126-5. Epub 2006 Dec 2. J Mol Med (Berl). 2007. PMID: 17143621
-
Chromosomal basis of adenocarcinoma of the prostate.Cancer Invest. 1999;17(6):441-7. doi: 10.3109/07357909909021436. Cancer Invest. 1999. PMID: 10434955 Review.
Cited by
-
SSX2IP promotes metastasis and chemotherapeutic resistance of hepatocellular carcinoma.J Transl Med. 2013 Mar 1;11:52. doi: 10.1186/1479-5876-11-52. J Transl Med. 2013. PMID: 23452395 Free PMC article.
-
Digital karyotyping.Proc Natl Acad Sci U S A. 2002 Dec 10;99(25):16156-61. doi: 10.1073/pnas.202610899. Epub 2002 Dec 2. Proc Natl Acad Sci U S A. 2002. PMID: 12461184 Free PMC article.
-
Constitutional aneuploidy and cancer predisposition.Hum Mol Genet. 2009 Apr 15;18(R1):R84-93. doi: 10.1093/hmg/ddp084. Hum Mol Genet. 2009. PMID: 19297405 Free PMC article. Review.
-
Loss of RAB25 Cooperates with Oncogenes in the Transformation of Human Mammary Epithelial Cells (HMECs) to Give Rise to Claudin-Low Tumors.Biomed Res Int. 2024 May 20;2024:8544837. doi: 10.1155/2024/8544837. eCollection 2024. Biomed Res Int. 2024. PMID: 38803515 Free PMC article.
-
Oncogenes and tumor suppressor genes: functions and roles in cancers.MedComm (2020). 2024 May 31;5(6):e582. doi: 10.1002/mco2.582. eCollection 2024 Jun. MedComm (2020). 2024. PMID: 38827026 Free PMC article. Review.
References
-
- Heim S, Mitelman F: Cancer Cytogenetics. 2nd ed. 1995, John Wiley & Sons, Inc. New York,
-
- Kallioniemi A, Kallioniemi O-P, Sudar D, Rutovitz D, Gray JW, Waldman F, Pinkel D: Comparative genomic hybridization for molecular cytogenetic analysis of solid tumors. Science 1992, 258:818-821 - PubMed
-
- Hemminki A, Markie D, Tomlinson I, Avizienyte E, Roth S, Loukola A, Bignell G, Warren W, Aminoff M, Höglund P, Järvinen H, Kristo P, Pelin K, Ridanpää M, Salovaara R, Toro T, Bodmer W, Olschwang S, Olsen AS, Stratton MR, de la Chapelle A, Aaltonen LA: A serine/threonine kinase gene defective in Peutz-Jeghers syndrome. Nature 1998, 391:184-187 - PubMed
-
- El-Rifai W, Larramendy ML, Björkqvist A-M, Hemmer S, Knuutila S: Optimization of comparative genomic hybridization using fluorochrome conjugated to dCTP and dUTP nucleotides. Lab Invest 1997, 77:699-700 - PubMed
Publication types
MeSH terms
Substances
LinkOut - more resources
Full Text Sources
Other Literature Sources
Research Materials
