. 1999 Aug 9;146(3):543-58.
doi: 10.1083/jcb.146.3.543.

Three-dimensional visualization of transcription sites and their association with splicing factor-rich nuclear speckles

Affiliations

Three-dimensional visualization of transcription sites and their association with splicing factor-rich nuclear speckles

X Wei et al. J Cell Biol. .

Abstract

Transcription sites are detected by labeling nascent transcripts with BrUTP in permeabilized 3T3 mouse fibroblasts followed by laser scanning confocal microscopy. Inhibition and enzyme digestion studies confirm that the labeled sites are from RNA transcripts and that RNA polymerase I (RP I) and II (RP II) are responsible for nucleolar and extranucleolar transcription, respectively. An average of 2,000 sites are detected per nucleus with over 90% in the extranucleolar compartment where they are arranged in clusters and three-dimensional networklike arrays. The number of transcription sites, their three-dimensional organization and arrangement into functional zones (Wei et al. 1998) is strikingly maintained after extraction for nuclear matrix. Significant levels of total RP II mediated transcription sites (45%) were associated with splicing factor-rich nuclear speckles even though the speckles occupied <10% of the total extranucleolar space. Moreover, the vast majority of nuclear speckles (>90%) had moderate to high levels of associated transcription activity. Transcription sites were found along the periphery as well as inside the speckles themselves. These spatial relations were confirmed in optical sections through individual speckles and after in vivo labeling of nascent transcripts. Our results demonstrate that nuclear speckles and their surrounding regions are major sites of RP II-mediated transcription in the cell nucleus, and support the view that both speckle- and nonspeckle-associated regions of the nucleus contain sites for the coordination of transcription and splicing processes.


Figures
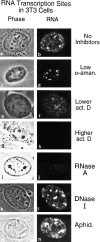
Figure 1
Figure 1
Transcription occurs at discrete sites throughout the cell nucleus. Mouse 3T3 cells were permeabilized with 0.025% Triton X-100, and then incubated with RNA synthesis buffer to label nascent transcripts with BrUTP, which was later immunodetected with anti-BrdU antibody. On the left are phase-contrast images of cells. On the right are conventional epifluorescent images of transcription sites. (a and b) Transcription sites are distributed throughout the cell nucleus. Both extranucleolar and nucleolar transcription sites are detected, with nucleolar transcription sites being more intense and discrete. (c and d) The extranucleolar transcription signal is completely abolished when 1 μg/ml of α-amanitin was included in the synthesis buffer. (e and f) Low concentration of actinomycin D (0.8 μg/ml) preferentially inhibits nucleolar transcription. (g and h) Higher concentration of actinomycin D (3.2 μg/ml) abolished all transcription sites in the cell nucleus. (i and j) Transcription signals were greatly reduced by treatment with RNase A (250 U/ml). (k and l) In contrast, DNase I digestion (50 U/ml) had no visible effects on the transcription sites. (m and n) The lack of effect of the specific DNA replication inhibitor aphidicolin (20 μg/ml) confirmed that the fluorescence labeled sites were not due to DNA synthesis.
Figure 9
Figure 9
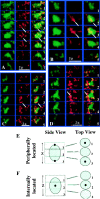
Optical section series through individual nuclear speckles. (A and B) Arrows indicate interior located transcription sites that are present in the middle sections (0.3 μm) of the series, but not in sections above or below. (C and D) Whereas the vast majority of speckles showed both internally and peripherally located transcription sites, a small population (<10%) showed only peripherally associated transcription sites (arrows). Section number for each speckle are labeled on the right. (E and F) Schematic illustration of optical sectioning method to distinguish peripheral from internal locations of transcription sites in the speckle regions. Large shadowed spheres indicate speckles. Small solid dots indicate transcription sites.
Figure 2
Figure 2
Laser scanning confocal microscopy of transcription sites, their segmentation, and spatial relationship with the nuclear lamina in permeabilized 3T3 cells. (A) Nucleolar transcription sites are encircled (yellow dashed lines). A cluster of transcription sites is indicated by red arrows. Regions with no transcription activity were indicated with green arrows. (B) A segmentation algorithm is applied to the image in A. Every site counted is contoured with a green line. (C) Higher magnification of a portion of A. (D) Higher magnification of a portion of B. (E–G) Double labeling of transcription sites and nuclear lamina. (E) Transcription sites are stained with FITC (green). (F) Nuclear lamina is detected with antilamin B antibodies and Texas red–conjugated secondary antibodies (red). (G) Merged image of transcription sites and nuclear lamina shows that transcription is occurring inside the region confined by nuclear lamina, and transcription sites are not associated with lamin B either on the lamina or with internal lamin B positive spots. (H–J) A portion of the image, indicated with a box in the merged image, is further enlarged. All images are 0.5-μm midplane optical sections.
Figure 3
Figure 3
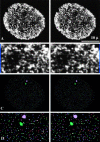
Three-dimensional visualization of transcription sites in permeabilized 3T3 cells. (A) 0.3-μm optical sections were reconstructed to form a three-dimensional image. Transcription sites are clustered in some regions of the cell nucleus, whereas others have no transcription activity. (B) A portion of A is further enlarged. Three-dimensional observations reveal clustering of individual sites into separate higher order domains. These separate higher order domains, in turn, are arranged in a pattern that resembles a networklike organization. (C) The centers of gravity (x, y, z) of transcription sites were determined by an algorithm after segmentation and displayed in three dimensions. Two specific transcription sites were pinpointed by their x, y, z coordinates and highlighted in purple and green. (D) A portion of the image of the centers of gravity is further enlarged.
Figure 4
Figure 4
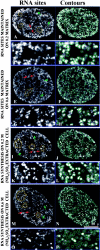
Transcription sites are maintained after preparation for nuclear matrix and the transcription activity is also preserved in salt-extracted 3T3 cells. On the left are the optical midplane images; on the right are the results after the images were subjected to the segmentation algorithm. Yellow dotted lines indicate nucleolar transcription sites. Examples of clustered transcription sites are indicated by red arrows. Nuclear regions with no transcription activity are indicated with green arrows. For all conditions, a portion of the images was further enlarged and displayed underneath. All sites that are counted are contoured with green lines. (A–D) Transcription sites are maintained after DNase I digestion followed by 0.2-M AS (ammonium sulfate) extraction for nuclear matrix. (E–H) Transcription sites are maintained after DNase I digestion followed by 0.6-M AS extraction for nuclear matrix. (I–L) Cells were first extracted with 0.2-M AS, and then subjected to RNA synthesis (M–P). Cells were first extracted with 0.6-M AS, and then subjected to RNA synthesis.
Figure 5
Figure 5
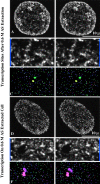
Three-dimensional visualization of transcription sites maintained on nuclear matrix and transcription activity of salt-extracted cells. 0.3-μm optical sections through 3T3 cells were reconstructed to form three-dimensional images. These results demonstrate that not only transcription sites, but also transcription activity is maintained on the nuclear matrix. (A) Transcription sites after 0.6-M AS extraction for nuclear matrix. (B) A portion of A is further enlarged. (C) Three-dimensional image of the centers of gravity of a region of A. (D) Three-dimensional visualization of transcription sites when synthesis was performed on 0.6-M AS extracted cells. (E) A portion of D is further enlarged. (F) Three-dimensional image of the centers of gravity of a region of D.
Figure 6
Figure 6
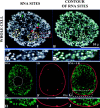
Maintenance of DNA replication and transcription sites and their organization into higher order zones on the nuclear matrix. Replication and transcription sites were simultaneously labeled in permeabilized 3T3 cells as described in Materials and Methods, and then extracted for nuclear matrix using 0.6 M AS (Belgrader et al. 1991). Contours were drawn around regions in the nuclear matrix that contained exclusively replication (green contours lines) or transcription sites (red contour lines), respectively. Top row are the original optical sections. Bottom row are the derived contour maps. As previously demonstrated for permeabilized cells (Wei et al. 1998), the great majority of replication and transcription sites that are maintained after extraction for nuclear matrix are arranged in clusters of spatially separate zones.
Figure 7
Figure 7
Quantification of snRNP in the nuclear speckle versus other nuclear regions. snRNP was detected with mAb Y12. A typical nuclear speckle and its surroundings were selected (insert) and the fluorescent intensity was measured across 16 consecutive x-axes through this region in 3T3 cells. The average intensity of these 16 separate determinations is plotted as a function of the pixel distance in the x-plane. The pixel distances across the x- and y-axes are labeled on the insert.
Figure 8
Figure 8
Transcription but not replication sites are associated with nuclear speckles. (A) Y12 decorates regions where splicing factors are concentrated in nuclear speckles and more diffuse nonspeckled regions (green). (B) Transcription sites scattered throughout the cell nucleus (red). (C) Merger of A and B shows significant association of transcription sites with nuclear speckles (yellow to orange staining). (D) Replication sites (green) are not associated with splicing factors (red). (E) Coiled bodies (red) do not have transcription activity (green). (F, G, I, and J) Enlarged areas as indicated by boxes F, G, I, and J in C, with Y12 on the left, transcription sites in the middle, and merged images on the right. Some transcription sites are in the interior region of the speckles (F, arrows), whereas other sites are located along the periphery (G, arrows) or with the more diffusely stained regions of Y12 (J, arrows). Nucleolar transcription sites are not associated with splicing factors (I, encircled by a dotted line). (H) Enlarged area of D shows that replication sites are present in the regions between splicing factor speckles and do not colocalize with the more diffusely distributed splicing factors.
Figure 10
Figure 10
In vivo labeled nascent RNA transcripts are associated with splicing factors. (A) Nuclear speckles are detected with the Y12 antibody (green). (B) Transcription sites are detected by incorporating BrU (2-min pulse) into nascent transcripts in vivo (red). (C) Merged image of A and B. (D–F) Enlarged portions of A–C, respectively. The thin arrow indicates a transcription site inside of a nuclear speckle. Nucleolar transcription sites are not associated with splicing factors (see hollow arrow). Transcription sites that are associated with diffusely distributed splicing factors are indicated with a short arrow.

Similar articles

Cited by

References

    1. Bauren G., Wieslander E. Splicing of Balbiani ring 1 gene pre-mRNA occurs simultaneously with transcription. Cell. 1994;76:183–192. - PubMed
    1. Belgrader, P., A.J. Siegel, and R. Berezney. 1991. A comprehensive study on the isolation and characterization of the HeLa S3 nuclear matrix. 98:281–291. - PubMed
    1. Ben-Arie N., Lancet D., Taylor C., Khen M., Walker N., Ledbetter D.H., Carrozzo R., Patel K., Sheer D., Lehrach H., North M.A. Olfactory receptor gene cluster on human chromosome17possible duplication of an ancestral receptor repertoire. Hum. Mol. Genet. 1994;3:229–235. - PubMed
    1. Berezney R. Visualizing DNA replication sites in the cell nucleus. Semin. Cell Biol. 1991;2:103–115. - PubMed
    1. Berezney R., Jeon K.W. Nuclear MatrixStructural and Functional Organization 1995. Academic Press, Inc; Orlando, FL: pp. 1,047

Publication types

MeSH terms