. 1999 Sep;73(9):7474-88.
doi: 10.1128/JVI.73.9.7474-7488.1999.

Roles for the E4 orf6, orf3, and E1B 55-kilodalton proteins in cell cycle-independent adenovirus replication

Affiliations

Roles for the E4 orf6, orf3, and E1B 55-kilodalton proteins in cell cycle-independent adenovirus replication

F D Goodrum et al. J Virol. 1999 Sep.

Abstract

Adenoviruses bearing lesions in the E1B 55-kDa protein (E1B 55-kDa) gene are restricted by the cell cycle such that mutant virus growth is most impaired in cells infected during G(1) and least restricted in cells infected during S phase (F. D. Goodrum and D. A. Ornelles, J. Virol. 71:548-561, 1997). A similar defect is reported here for E4 orf6-mutant viruses. An E4 orf3-mutant virus was not restricted for growth by the cell cycle. However, orf3 was required for enhanced growth of an E4 orf6-mutant virus in cells infected during S phase. The cell cycle restriction may be linked to virus-mediated mRNA transport because both E1B 55-kDa- and E4 orf6-mutant viruses are defective at regulating mRNA transport at late times of infection. Accordingly, the cytoplasmic-to-nuclear ratio of late viral mRNA was reduced in G(1) cells infected with the mutant viruses compared to that in G(1) cells infected with the wild-type virus. By contrast, this ratio was equivalent among cells infected during S phase with the wild-type or mutant viruses. Furthermore, cells infected during S phase with the E1B 55-kDa- or E4 orf6-mutant viruses synthesized more late viral protein than did cells infected during G(1). However, the total amount of cytoplasmic late viral mRNA was greater in cells infected during G(1) than in cells infected during S phase with either the wild-type or mutant viruses, indicating that enhanced transport of viral mRNA in cells infected during S phase cannot account for the difference in yields in cells infected during S phase and in cells infected during G(1). Thus, additional factors affect the cell cycle restriction. These results indicate that the E4 orf6 and orf3 proteins, in addition to the E1B 55-kDa protein, may cooperate to promote cell cycle-independent adenovirus growth.


Figures

FIG. 1
FIG. 1
E1B 55-kDa- and E4 orf6-mutant viruses, but not an E4 orf3-mutant virus, produce virus in only a fraction of infected cells. Monolayers of HeLa cells were infected with the wild-type virus dl309 (A to D), the E1B 55-kDa mutant virus dl1520 (E to H), the E4 Orf3-mutant inorf3 (I to L), or the E4 orf6-mutant virus dl355 (M to P), at a multiplicity of 20 PFU/cell. At 24 h postinfection, cells were fixed in 2.5% glutaraldehyde, embedded, and sectioned for transmission electron microscopy. Nearly all (>95%) of the cells infected with the wild-type virus contained electron-dense viral particles in the nucleus. Four representative wild-type virus-infected cells are shown in panels A through D. Virions can be easily seen in the high-magnification images, representing a fivefold magnification of the boxed region of the nucleus from the low-magnification image. Of the four representative cells infected with the E1B-mutant virus (E to H), only the cell shown in panel H contains virus particles in the nucleus. Nearly all (>95%) cells infected with the E4 orf3-mutant virus produced virus, as can be seen in the four representative cells shown in panels I through L. Of the five E4 orf6-mutant virus-infected cells (M to P), only the cell in panel P and one of the cells in panel O (marked by an asterisk) contained virus particles in their nuclei, although all cells were infected. Representative viral inclusions are marked VI. A crystalline array of virus particles in panel J is marked by an arrowhead, and crystalline aggregates of viral proteins in panels C and L are marked by dagger (†). Bars, 2 μm.
FIG. 1
FIG. 1
E1B 55-kDa- and E4 orf6-mutant viruses, but not an E4 orf3-mutant virus, produce virus in only a fraction of infected cells. Monolayers of HeLa cells were infected with the wild-type virus dl309 (A to D), the E1B 55-kDa mutant virus dl1520 (E to H), the E4 Orf3-mutant inorf3 (I to L), or the E4 orf6-mutant virus dl355 (M to P), at a multiplicity of 20 PFU/cell. At 24 h postinfection, cells were fixed in 2.5% glutaraldehyde, embedded, and sectioned for transmission electron microscopy. Nearly all (>95%) of the cells infected with the wild-type virus contained electron-dense viral particles in the nucleus. Four representative wild-type virus-infected cells are shown in panels A through D. Virions can be easily seen in the high-magnification images, representing a fivefold magnification of the boxed region of the nucleus from the low-magnification image. Of the four representative cells infected with the E1B-mutant virus (E to H), only the cell shown in panel H contains virus particles in the nucleus. Nearly all (>95%) cells infected with the E4 orf3-mutant virus produced virus, as can be seen in the four representative cells shown in panels I through L. Of the five E4 orf6-mutant virus-infected cells (M to P), only the cell in panel P and one of the cells in panel O (marked by an asterisk) contained virus particles in their nuclei, although all cells were infected. Representative viral inclusions are marked VI. A crystalline array of virus particles in panel J is marked by an arrowhead, and crystalline aggregates of viral proteins in panels C and L are marked by dagger (†). Bars, 2 μm.
FIG. 2
FIG. 2
HeLa cells infected during S phase produce greater yields of E4 orf6-mutant virus, but not E4 orf3-mutant virus, than do cells infected during G1. HeLa cells were synchronized to S phase or G1. Cells were infected with the wild-type virus (dl309), the E4-mutant viruses lacking orf6 (dl355*, inorf6/inorf6/7, and dl366*+orf3), the E4 orf3-mutant virus (inorf3), or the E4-mutant viruses lacking orf3 and orf6 (inorf3/inorf6, dl355*/inorf3, dl366*+or4, and dl366*±orf1-2) at a multiplicity of 3 to 10 PFU per cell. Cells were lysed 48 to 72 h postinfection, and virus yields were measured by plaque assays with W162 cells. For the wild-type virus, 1 PFU measured with W162 cells corresponds to approximately 100 infectious units in HeLa cells. The results shown are averages of three to nine independent infections performed in four independent experiments. Yields are expressed as PFU per cell. Viruses that produced significantly different yields between cells infected during S phase and cells infected during G1 are identified by the associated P values derived from the two-tailed Student t test. All other comparisons of S with G1 were not statistically different, with P values of >0.5. The status of the E4 orf3 and orf6 genes in each mutant virus is indicated, where a plus sign indicates a wild-type gene and a minus sign indicates a functionally null gene.
FIG. 3
FIG. 3
E1B 55-kDa-mutant viruses defective for late gene expression produce greater yields of virus in S-phase cells than in asynchronous cells. Asynchronous or S-phase HeLa cells were infected with either the wild-type virus (dl309), and E1B 55-kDa-mutant virus (dl338, A143, R443, or S380), or an E1B 19-kDa-mutant virus (dl337) at a multiplicity of 3 PFU per cell. Cells were lysed 48 h postinfection, and virus yields were measured by plaque assays with 293 cells. Yields are averages from multiple experiments and are expressed as PFU per cell. Asynchronous values are derived from five experiments, and S-phase values were derived from three experiments, except for dl337. Both asynchronous and S-phase values for dl337 were derived from three experiments. The standard errors of the means are shown. The probabilities indicated above each set of bars derived from a two-tailed Student t test and represent the probabilities that the two averages are from the same population.
FIG. 4
FIG. 4
The E1B 55-kDa-mutant and E4 orf6-mutant viruses synthesize greater levels of viral late proteins in HeLa cells infected during S phase than in asynchronous (Async) cells. Asynchronous or S-phase HeLa cells were mock infected or infected with the wild-type virus dl309, the E1B 55-kDa-mutant virus dl1520, the E4 orf6-mutant virus dl355, or the E4 orf3-mutant virus inorf3 at a multiplicity of 20 PFU per cell. At 32 h postinfection, cells were labeled with 35S-labeled amino acids for 1 h. Proteins from 105 cells (per lane) were separated by SDS-PAGE. Proteins were visualized and quantified by phosphorescence imaging. The migrations and masses (in kilodaltons) or molecular weight standards are indicated to the right of the gel. The positions of six Ad late proteins were determined with Ad virion standards labeled with 14C-amino acids and are indicated to the left of the gel. The positions of the E2A 72-kDA protein and the cellular actin protein are also indicated. The gel shown is representative of four independent experiments.
FIG. 5
FIG. 5
Relative levels of cytoplasmic (Cyt) and nuclear (Nuc) L3 and L5 late viral transcripts determined by RNase protection assays. S-phase or G1 HeLa cells were mock infected or infected with the wild-type virus dl309 or the E1B 55-kDa-mutant virus dl338 at a multiplicity of 10 PFU per cell. At 16 h postinfection, cells were fractionated, and total RNA was isolated from both cytoplasmic and nuclear fractions. L3 and L5 transcript levels were determined by RNase protection assays with RNA probes that span the polyadenylation site of the L3 and L5 families of transcripts, respectively. Protected hybrids were resolved on polyacrylamide-urea minigels. Results of a representative protection assay for S-phase and G1 cells infected with dl309 or dl338 are shown. The positions of readthrough transcripts that extended beyond the L3 (filled arrowhead) and L5 (open arrowhead) polyadenylation sites and the mature transcripts (L3 or L5) are indicated to the left of the gel. The nucleotide length (bases) of each product is indicated to the right of the gel. Duplicate RNase protection results are in adjacent lanes.
FIG. 6
FIG. 6
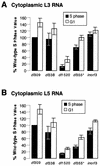
Cytoplasmic fractions from cells infected during G1 contain greater levels of L3 and L5 viral transcripts than do those from cells infected during S phase. S-phase or G1 HeLa cells were infected with the wild-type virus dl309, the E1B 55-kDa-mutant virus dl338 or dl1520, the E4 orf6-mutant virus dl355, or the E4 orf3-mutant virus inorf3. Total RNA was isolated from cytoplasmic fractions at 16 h postinfection. L3 and L5 transcript levels were determined by RNase protection assay as described in Fig. 5. The cytoplasmic levels of L3 and L5 transcripts from S-phase cells infected with dl309 were normalized to 100 to determine the relative percentages of L3 (A) and L5 (B) transcripts in cytoplasmic fractions from cells infected during S phase with the mutant viruses or infected during G1 with the wild-type or mutant viruses. The results summarized in panels A and B are averages obtained from 10 experiments for dl309, 5 experiments for dl338, 8 experiments for dl1520, 6 experiments for dl355, and 2 experiments for inorf3. The standard errors of the means for each experiment are shown.
FIG. 7
FIG. 7
S-phase cells infected with the E1B 55-kDa-mutant or the E4 orf6-mutant virus yield greater cytoplasmic (Cyt)-to-nuclear (Nuc) ratios for L3 and L5 transcripts than do G1 cells. S-phase or G1 HeLa cells were mock infected or infected with the wild-type virus dl309, the E1B 55-kDa-mutant virus dl338 or dl1520, or the E4 orf6-mutant virus dl355 at a multiplicity of 10 PFU per cell. At 16 h postinfection, cells were fractionated and total RNA was isolated from both cytoplasmic and nuclear fractions. L3 and L5 transcript levels were determined by RNase protection assays with RNA probes that span the polyadenylation sites of the L3 and L5 families of transcripts, respectively. Relative levels of cytoplasmic and nuclear L3 and L5 mRNAs were determined by phosphorescence imaging and were normalized to total RNA to account for inconsistencies in RNA recovery. The cytoplasmic-to-nuclear ratios from representative S-phase (A) and G1 (B) infections are expressed as percentages of the ratios for the wild-type infections. The standard errors of the means are shown.

Similar articles

Cited by

References

    1. Ahn J H, Hayward G S. The major immediate-early proteins IE1 and IE2 of human cytomegalovirus colocalize with and disrupt PML-associated nuclear bodies at very early times in infected permissive cells. J Virol. 1997;71:4599–4613. - PMC - PubMed
    1. Ascoli C A, Maul G G. Identification of a novel nuclear domain. J Cell Biol. 1991;112:785–795. - PMC - PubMed
    1. Ausubel F M, Brent R, Kingston R E, Moore D D, Seidman J G, Smith J A, Struhl K S, editors. Current protocols in molecular biology. Vol. 2. New York, N.Y: Greene Publishing Associates and John Wiley and Sons, Inc.; 1993.
    1. Babiss L E, Ginsberg H S, Darnell J E. Adenovirus E1B proteins are required for accumulation of late viral mRNA and for effects on cellular mRNA translation and transport. Mol Cell Biol. 1985;5:2552–2558. - PMC - PubMed
    1. Barker D D, Berk A J. Adenovirus proteins from both E1B reading frames are required for transformation of rodent cells by viral infection and DNA transfection. Virology. 1987;156:107–121. - PubMed

Publication types

MeSH terms

LinkOut - more resources