. 1999 Aug 2;190(3):399-410.
doi: 10.1084/jem.190.3.399.

Relaxed negative selection in germinal centers and impaired affinity maturation in bcl-xL transgenic mice

Affiliations

Relaxed negative selection in germinal centers and impaired affinity maturation in bcl-xL transgenic mice

Y Takahashi et al. J Exp Med. .

Abstract

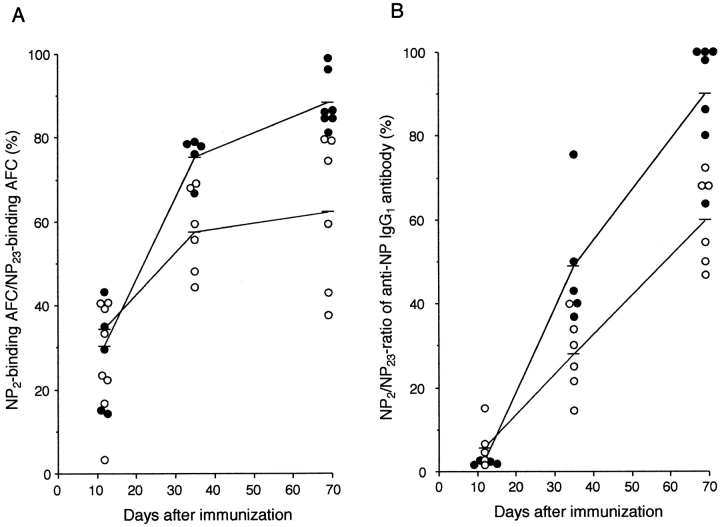
The role of apoptosis in affinity maturation was investigated by determining the affinity of (4-hydroxy-3-nitrophenyl)acetyl (NP)-specific antibody-forming cells (AFCs) and serum antibody in transgenic mice that overexpress a suppressor of apoptosis, Bcl-xL, in the B cell compartment. Although transgenic animals briefly expressed higher numbers of splenic AFCs after immunization, the bcl-xL transgene did not increase the number or size of germinal centers (GCs), alter the levels of serum antibody, or change the frequency of NP-specific, long-lived AFCs. Nonetheless, the bcl-xL transgene product, in addition to endogenous Bcl-xL, reduced apoptosis in GC B cells and resulted in the expansion of B lymphocytes bearing VDJ rearrangements that are usually rare in primary anti-NP responses. Long-lived AFCs bearing these noncanonical rearrangements were frequent in the bone marrow and secreted immunoglobulin G(1) antibodies with low affinity for NP. The abundance of noncanonical cells lowered the average affinity of long-lived AFCs and serum antibody, demonstrating that Bcl-xL and apoptosis influence clonal selection/maintenance for affinity maturation.


Figures

Figure 1
Figure 1
B cells from bcl-x L transgenic mice are resistant to passive cell death and proliferate in vitro in response to activated helper T cell clones or recombinant CD40L. (A) The bcl-x L transgene expands the peripheral B cell compartment. Transgenic animals exhibit increased splenic cellularity that reflects a near doubling of naive IgM+ B lymphocytes. In contrast, thymic weight and cellularity are unchanged. Values represent mean ± SEM of six to nine bcl-x L transgenic mice or wild-type littermate controls. Splenic weight, cellularity, and B cell number are significantly (P < 0.01) greater in transgenic mice than in normal controls. (B) Splenic B cells were purified from control (filled symbols) or transgenic (open symbols) mice and cultured in medium containing 1% FCS for 96 h. Viable cells present in triplicate cultures were enumerated by trypan blue exclusion at the indicated times; each point represents the mean number (± SD) of viable B lymphocytes. (C) Purified control and transgenic B cells (1.5 × 10⁵ cells/well) were cultured for 48 h in the presence of helper T cells activated by immobilized CD3-specific antibody (squares) or rCD40L (circles). [3H]Thymidine uptake by the cultured cells was then determined to estimate cellular proliferation. Stimulating T cells were diluted threefold from 3 × 10⁴ cells/well, and medium enriched for rCD40L was serially diluted in threefold steps from 0.3%.
Figure 1
Figure 1
B cells from bcl-x L transgenic mice are resistant to passive cell death and proliferate in vitro in response to activated helper T cell clones or recombinant CD40L. (A) The bcl-x L transgene expands the peripheral B cell compartment. Transgenic animals exhibit increased splenic cellularity that reflects a near doubling of naive IgM+ B lymphocytes. In contrast, thymic weight and cellularity are unchanged. Values represent mean ± SEM of six to nine bcl-x L transgenic mice or wild-type littermate controls. Splenic weight, cellularity, and B cell number are significantly (P < 0.01) greater in transgenic mice than in normal controls. (B) Splenic B cells were purified from control (filled symbols) or transgenic (open symbols) mice and cultured in medium containing 1% FCS for 96 h. Viable cells present in triplicate cultures were enumerated by trypan blue exclusion at the indicated times; each point represents the mean number (± SD) of viable B lymphocytes. (C) Purified control and transgenic B cells (1.5 × 10⁵ cells/well) were cultured for 48 h in the presence of helper T cells activated by immobilized CD3-specific antibody (squares) or rCD40L (circles). [3H]Thymidine uptake by the cultured cells was then determined to estimate cellular proliferation. Stimulating T cells were diluted threefold from 3 × 10⁴ cells/well, and medium enriched for rCD40L was serially diluted in threefold steps from 0.3%.
Figure 2
Figure 2
Expression of endogenous and transgenic Bcl-xL in splenocytes. Expression patterns of Bcl-xL and Bcl-2 were determined by Western blotting of splenocytes from bcl-x L transgenic mice or wild-type littermate controls. (A) Unselected (total spenocytes [Total spl], lane 1), lymphoid gate (lane 2), and sorted (B220+CD3, lane 3; B220CD3+, lane 4) splenocytes were recovered from naive transgenic mice. Most, if not all, transgenic Bcl-xL protein detected in these populations is confined to splenic B lymphocytes. (B) Spleen cells from four immunized transgenic or wild-type mice were pooled at day 12 after immunization. 10 μg of cell lysate protein was immunoblotted using anti–Bcl-x (upper panel) or anti–Bcl-2 (lower panel) mAbs. Molecular masses: transgenic Bcl-xL, 33 kD; endogenous Bcl-xL, 31, 32 kD; Bcl-2, 26 kD. Transgenic Bcl-xL protein is abundant in follicular (GL-7B220+) B cells, but only modest amounts are present in GC B lymphocytes (GL-7+B220+). Endogenous Bcl-xL is expressed at low levels in follicular B cells but is upregulated in the GC. In contrast, Bcl-2 is present in quantity in the follicular population but undetectable in GC B cells.
Figure 3
Figure 3
bcl-x L transgenic mice produce GC and IgG1 antibody responses that are similar to control animals. Splenocytes were recovered from transgenic mice or wild-type controls at various times after immunization with NP-CG. (A) The numbers of λ1+ GCs were determined by histological staining with anti-λ1 antibody and PNA. Each point represents the average number of λ1+ GCs per histologic section (≥3 sections representing ≈2/3 splenic area) in single transgenic (open circles) or wild-type (filled circles) mice. (B) The percentage of GC B cells in live lymphocytes was assessed by flow cytometry using anti-B220 and anti–GL-7 antibodies. Each point represents the frequency mean (± SD) of GC B cells (percentage of total lymphoid gate) in single transgenic (open circles) and control (filled circles) mice 8, 12, and 35 d after immunization. (C) Numbers of NP-specific AFCs from BM (circles) and spleen (squares) of bcl-x L transgenic (open) or littermate control mice (filled) were determined by ELISPOT using NP23-BSA as the capture antigen. Frequencies of AFCs in naive mice (day 0) from both groups were <0.2 × 10⁻⁵. (D) NP-specific serum antibody from transgenic (open) or wild-type control mice (filled) was determined by ELISA using NP23-BSA. The average values (± SD) for serum antibody concentrations from five to seven individual mice per time point are presented.
Figure 3
Figure 3
bcl-x L transgenic mice produce GC and IgG1 antibody responses that are similar to control animals. Splenocytes were recovered from transgenic mice or wild-type controls at various times after immunization with NP-CG. (A) The numbers of λ1+ GCs were determined by histological staining with anti-λ1 antibody and PNA. Each point represents the average number of λ1+ GCs per histologic section (≥3 sections representing ≈2/3 splenic area) in single transgenic (open circles) or wild-type (filled circles) mice. (B) The percentage of GC B cells in live lymphocytes was assessed by flow cytometry using anti-B220 and anti–GL-7 antibodies. Each point represents the frequency mean (± SD) of GC B cells (percentage of total lymphoid gate) in single transgenic (open circles) and control (filled circles) mice 8, 12, and 35 d after immunization. (C) Numbers of NP-specific AFCs from BM (circles) and spleen (squares) of bcl-x L transgenic (open) or littermate control mice (filled) were determined by ELISPOT using NP23-BSA as the capture antigen. Frequencies of AFCs in naive mice (day 0) from both groups were <0.2 × 10⁻⁵. (D) NP-specific serum antibody from transgenic (open) or wild-type control mice (filled) was determined by ELISA using NP23-BSA. The average values (± SD) for serum antibody concentrations from five to seven individual mice per time point are presented.
Figure 4
Figure 4
bcl-x L transgenic mice show reduced numbers of TUNEL+ cells in GCs. Spleen sections were prepared from transgenic mice (white bars) and wild-type control mice (black bars) at day 12 after immunization. TUNEL assays were performed with staining by PNA to identify GCs. The number of TUNEL+ cells present and the area of each GC were determined under 200× magnification from >500 GCs. Frequencies of TUNEL+ GC cells/area were then calculated, and each frequency was placed into 1 of 12 categories. The distributions of categories for transgenic and wild-type controls are plotted.
Figure 5
Figure 5
bcl-x L transgenic mice show relaxed affinity maturation of NP-specific IgG1 BM AFCs and serum antibody. The average affinities of BM AFCs (A) and serum antibodies (B) produced by transgenic (open circles) and control (filled circles) mice at different time points were estimated. (A) The frequencies of NP2- and NP23-specific IgG1 AFCs from BM were determined by ELISPOT. Ratios of NP2 versus NP23-specific AFCs were then calculated and plotted. AFC affinities are significantly (P < 0.05) lower in transgenic animals at 35 and 69 d after immunization. (B) Concentrations of NP2- and NP23-specific IgG1 antibody were determined by ELISA, and the ratios of NP2- versus NP23-specific IgG1 antibody were plotted. Each point represents the ratio determined in a single mouse. The average affinity of serum antibody in transgenic mice is significantly (P < 0.05) lower than that of controls at 69 d after immunization.

Similar articles

Cited by

References

    1. Eisen H.N., Siskind G.W. Variations in affinities of antibodies during the immune response. Biochemistry. 1964;3:996–1008. - PubMed
    1. Siskind G.W., Benacerraf B. Cell selection by antigen in the immune response. Adv. Immunol. 1969;10:1–50. - PubMed
    1. Griffiths G.M., Berek C., Kaartinen M., Milstein C. Somatic mutation and the maturation of the immune response. Nature. 1984;312:271–275. - PubMed
    1. French D.L., R.Laskov, Scharff M.D. The role of somatic hypermutation in the generation of antibody diversity. Science. 1989;244:1152–1157. - PubMed
    1. Nossal G.J.V., Ada G.L., Austin C.M. Antigens in immunity. IV. Cellular localization of 125I and 131I labeled flagella in lymph nodes. Aust. J. Exp. Biol. Med. Sci. 1964;42:311–330. - PubMed

Publication types

MeSH terms

Associated data