. 1999 Jul 15;13(14):1884-97.
doi: 10.1101/gad.13.14.1884.

Unraveling a cytoplasmic role for hnRNP D in the in vivo mRNA destabilization directed by the AU-rich element

Affiliations

Unraveling a cytoplasmic role for hnRNP D in the in vivo mRNA destabilization directed by the AU-rich element

P Loflin et al. Genes Dev. .

Abstract

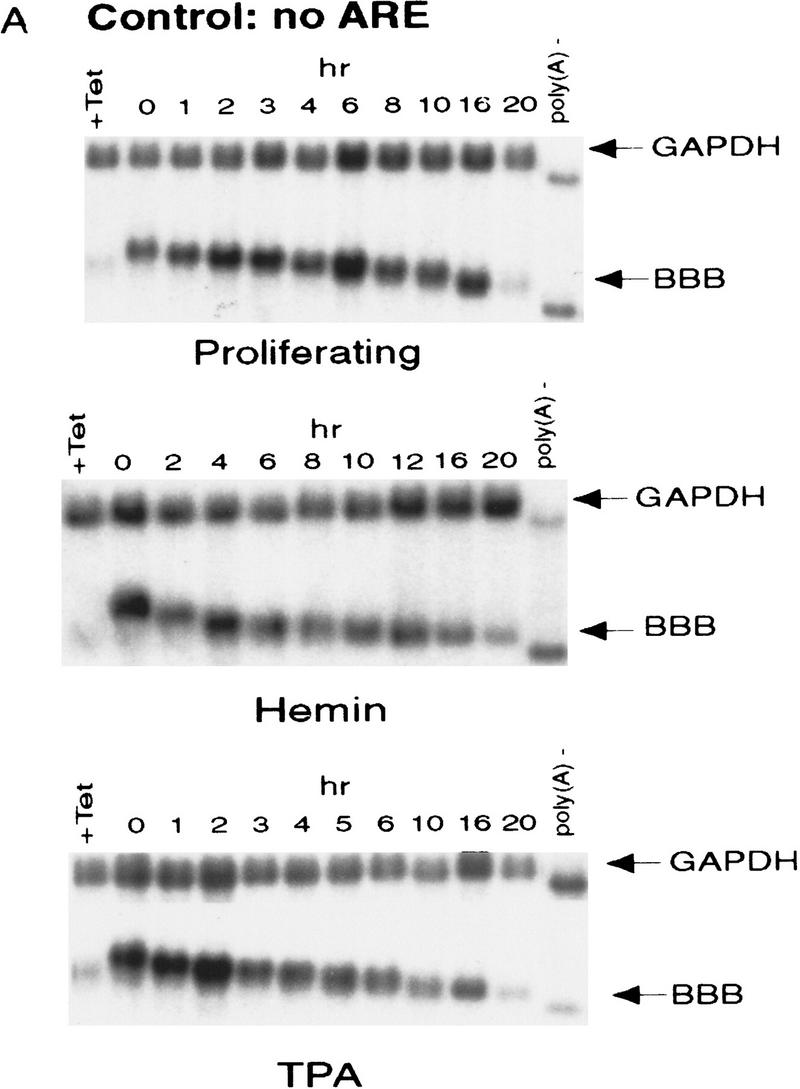
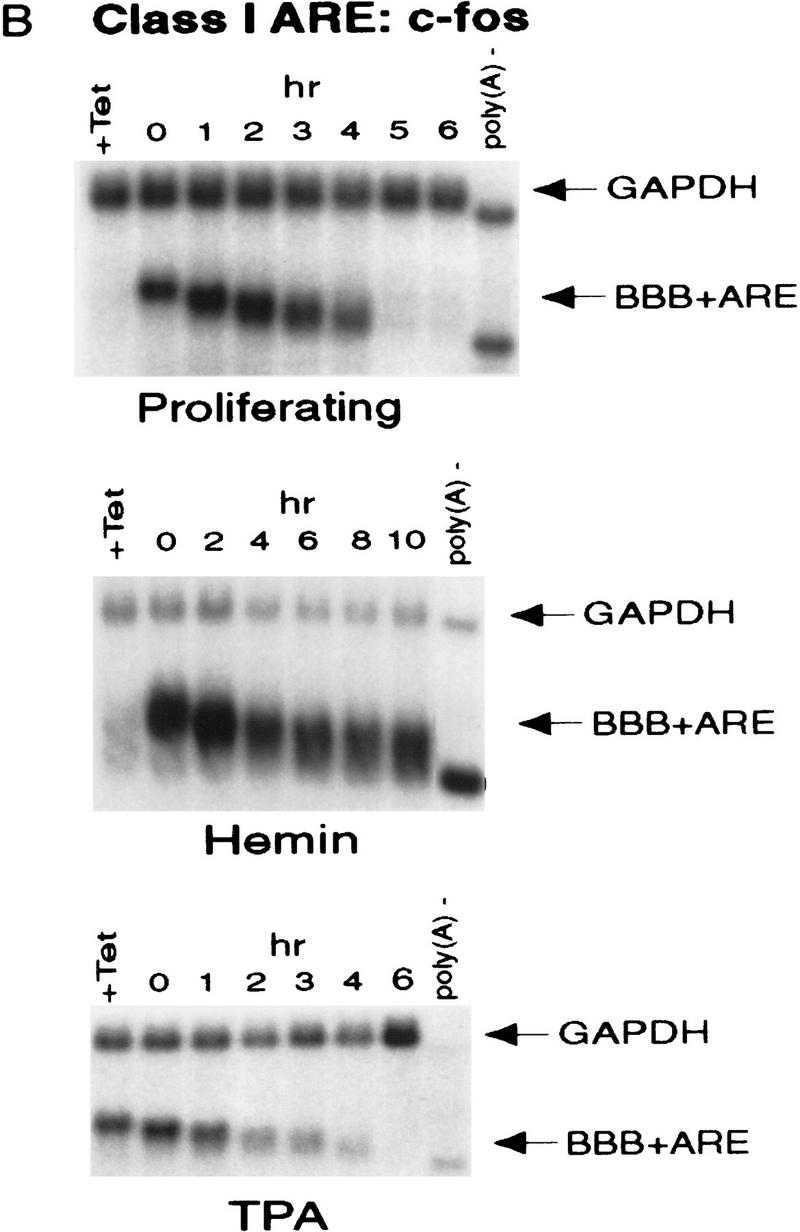
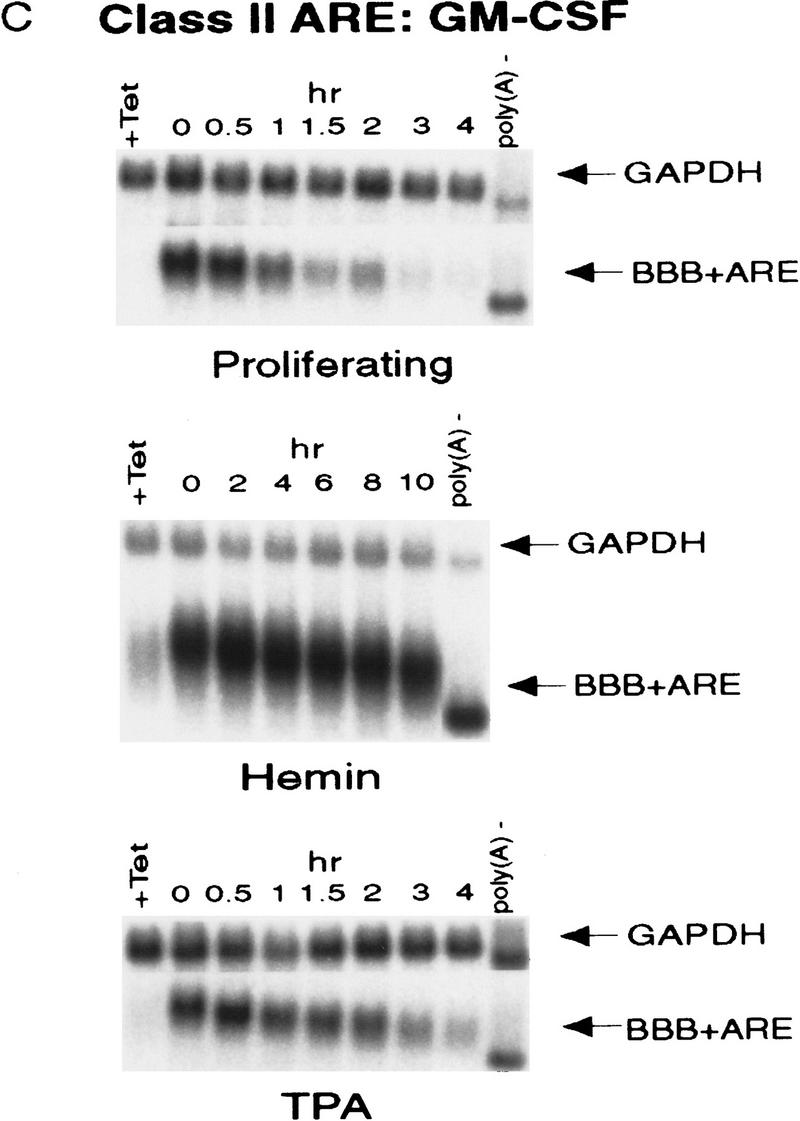
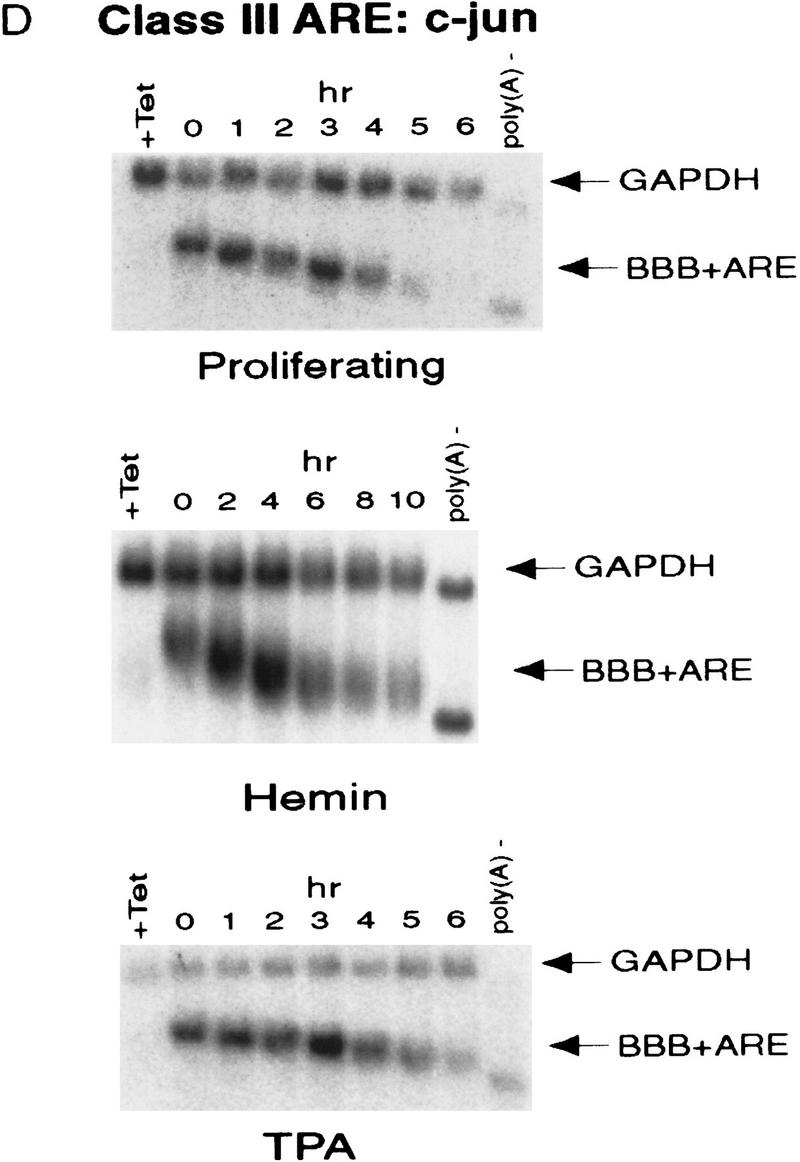
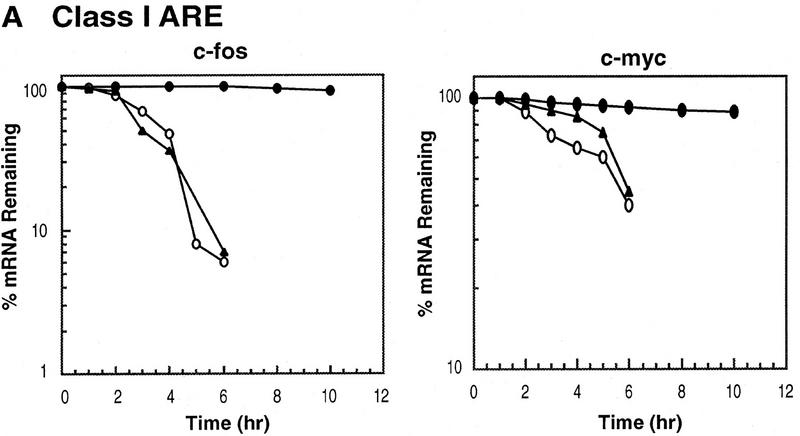
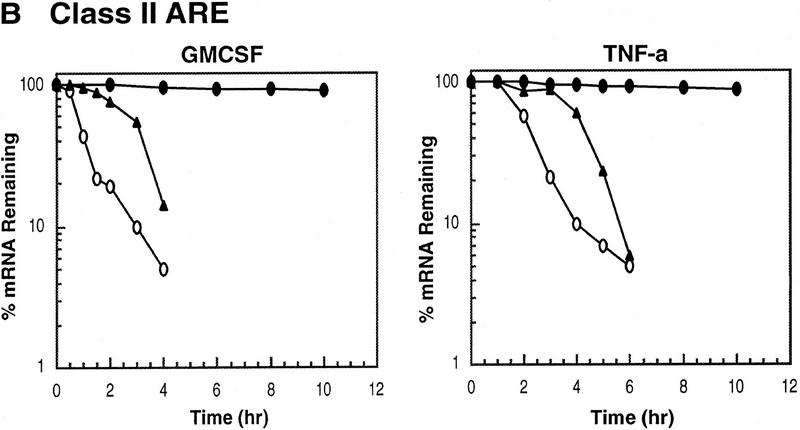
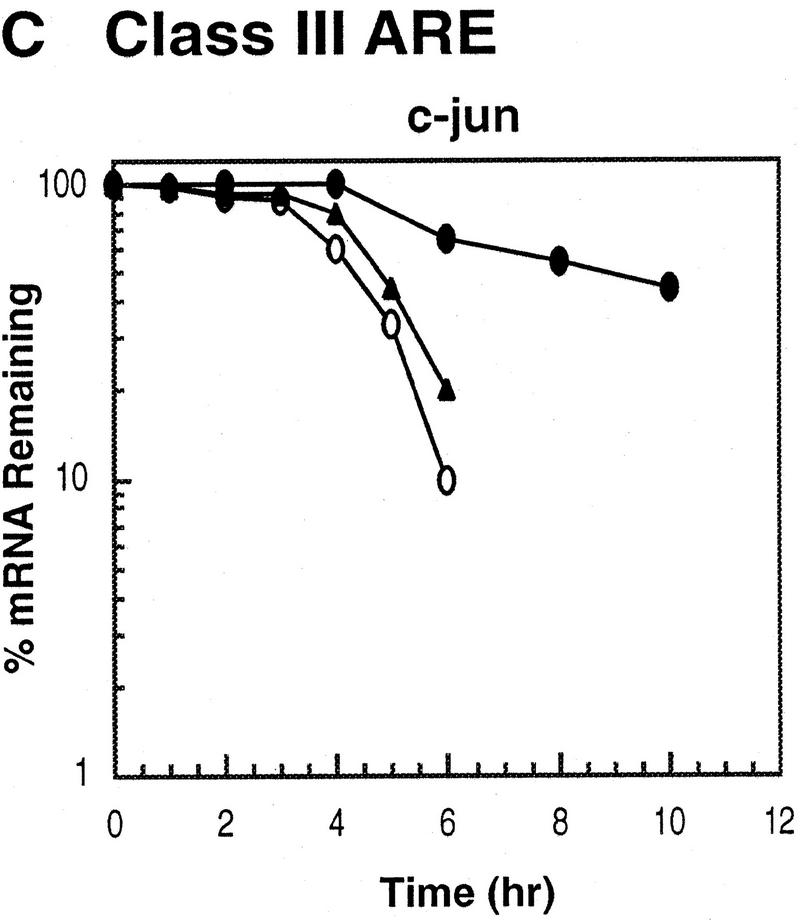
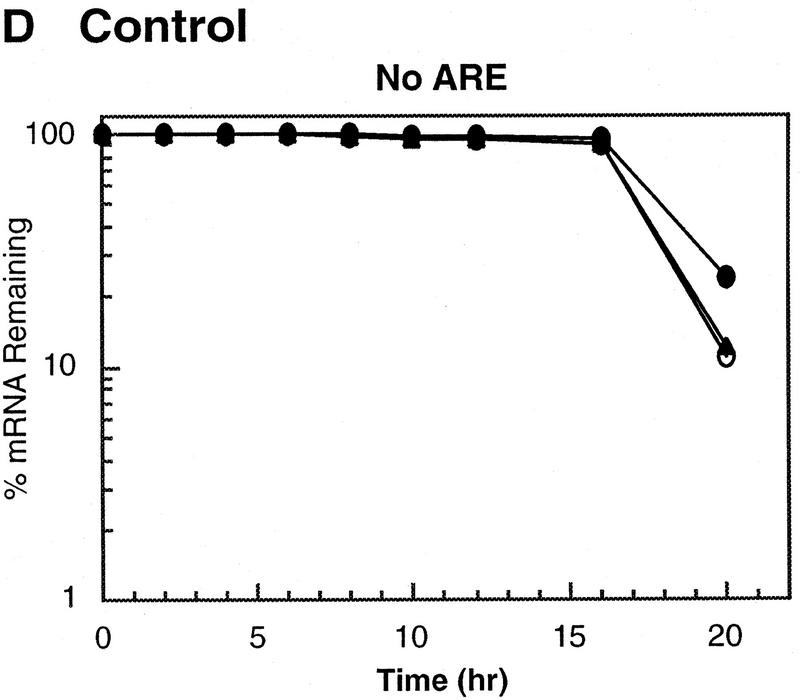
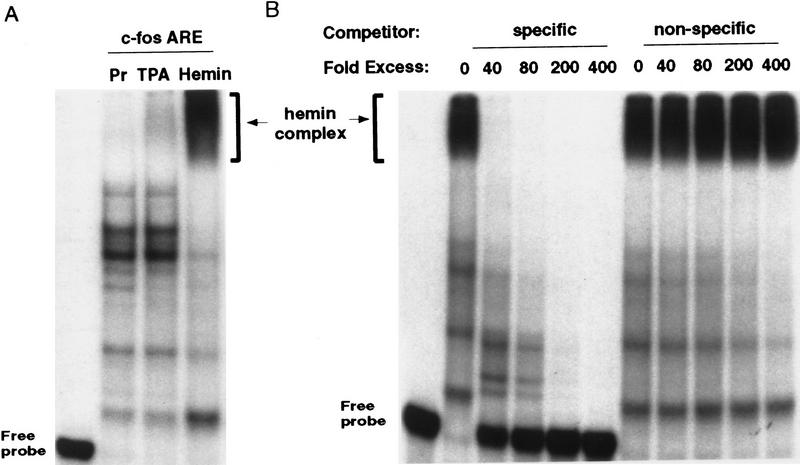
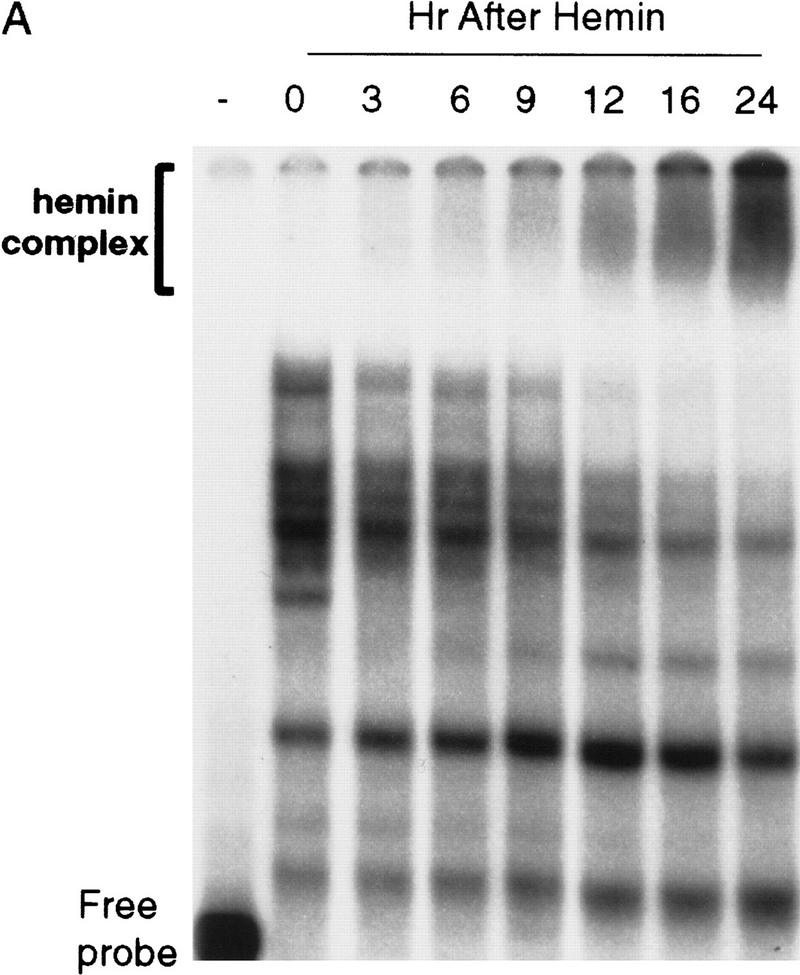
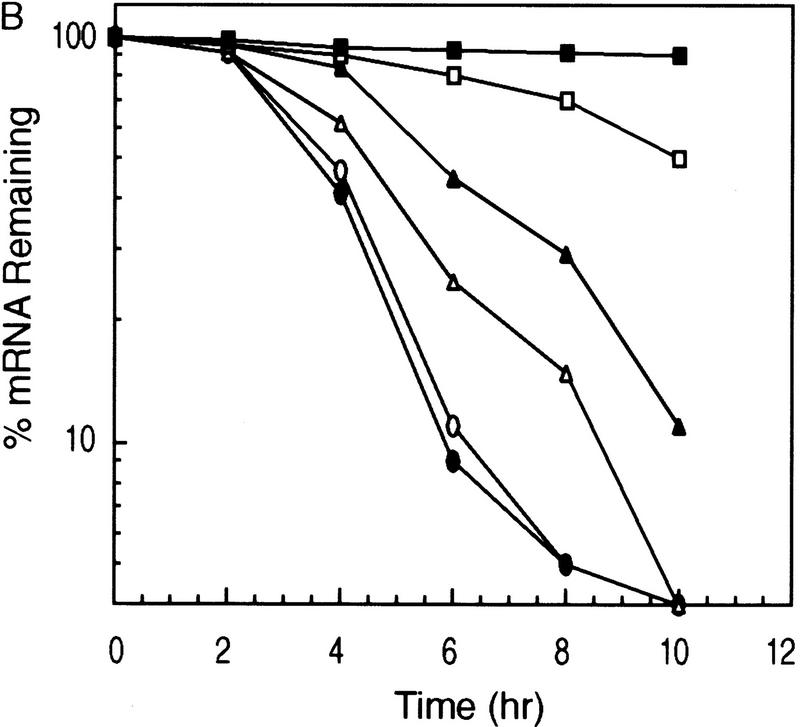
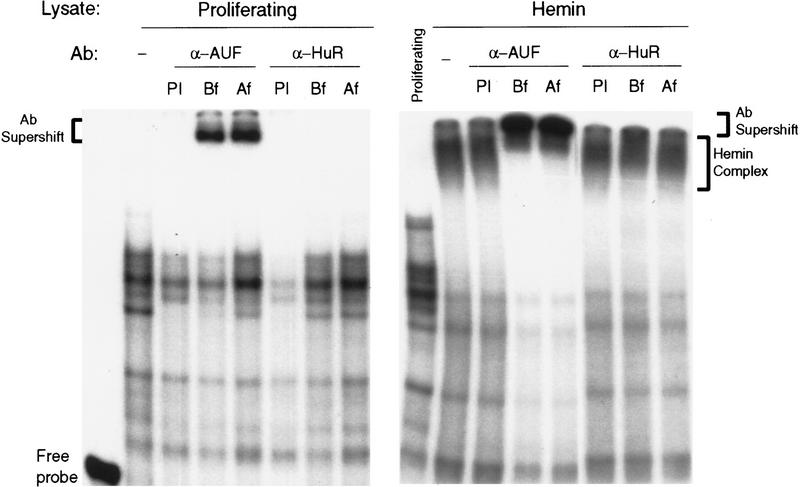
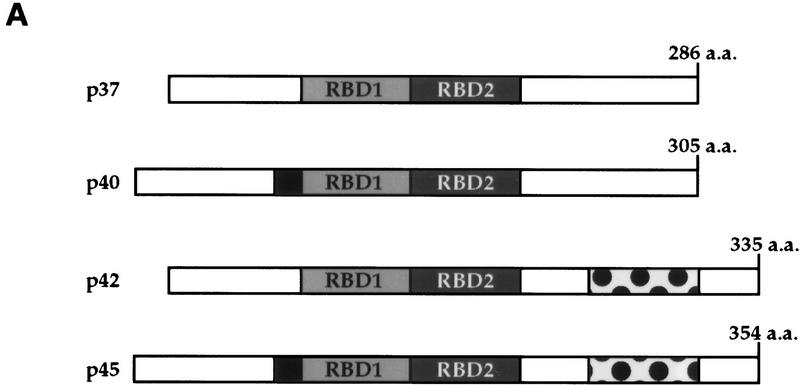
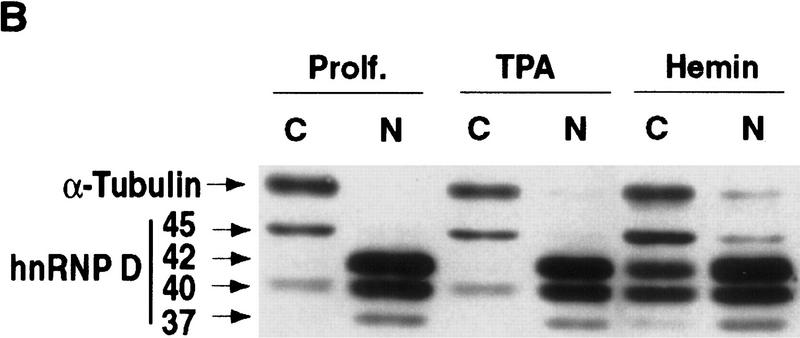
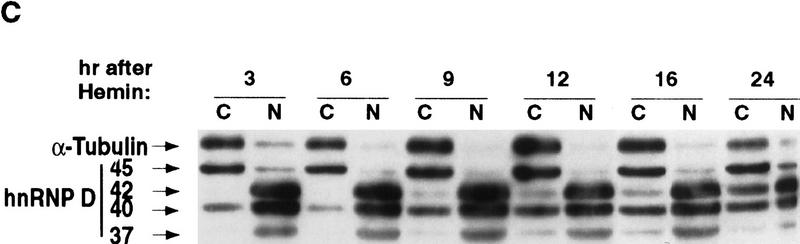
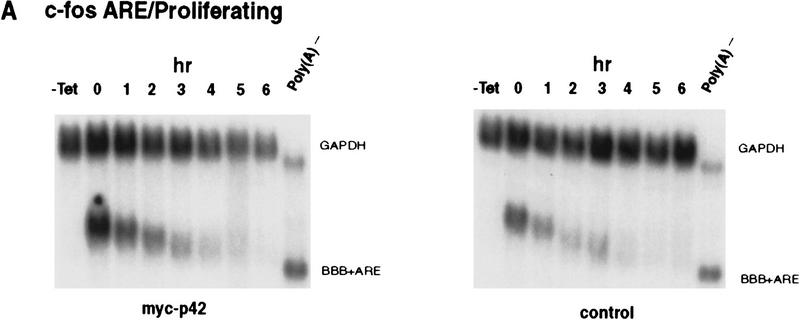
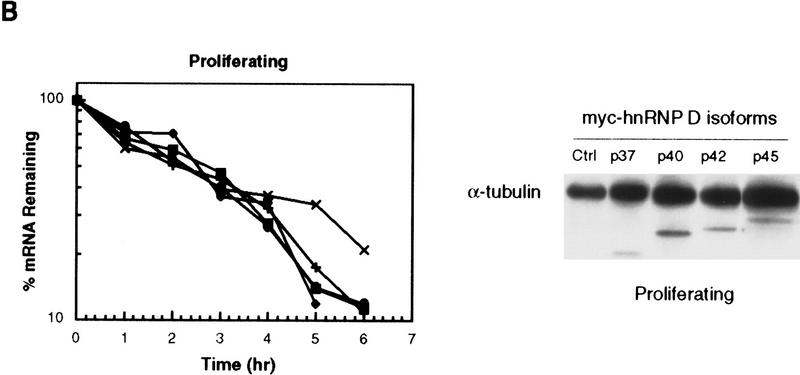
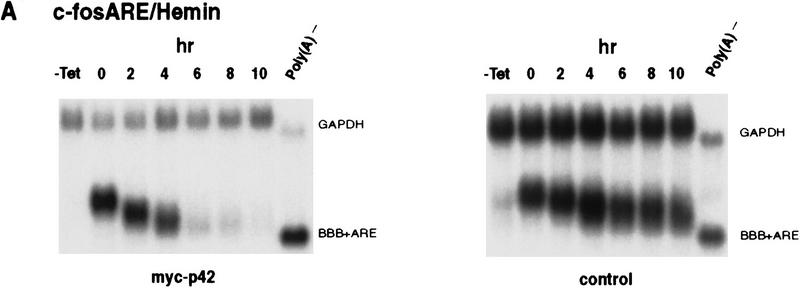
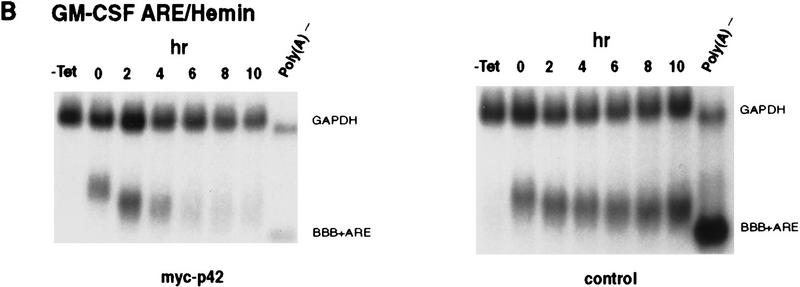
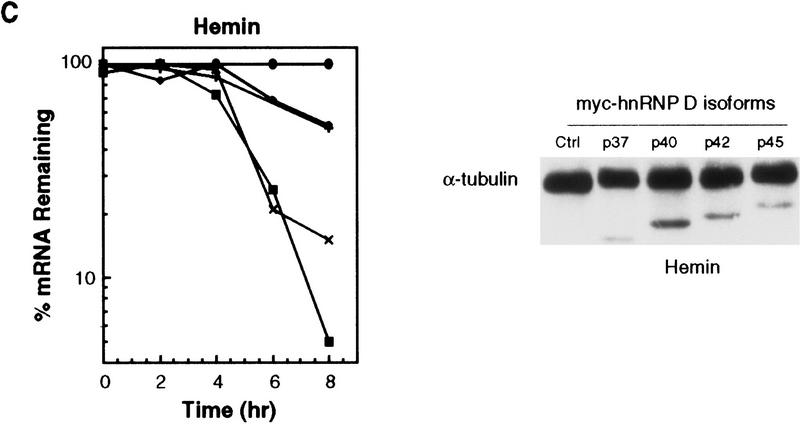
AU-rich RNA-destabilizing elements (AREs) have become a paradigm for studying cytoplasmic mRNA turnover in mammalian cells. Though many RNA-binding proteins have been shown to bind to AREs in vitro, trans-acting factors that participate in the in vivo destabilization of cytoplasmic RNA by AREs remains unknown. Experiments were performed to investigate the cellular mechanisms and to identify potential trans-acting factors for ARE-directed mRNA decay. These experiments identified hnRNP D, a heterogeneous nuclear ribonucleoprotein (hnRNP) capable of shuttling between the nucleus and cytoplasm, as an RNA destabilizing protein in vivo in ARE-mediated rapid mRNA decay. Our results show that the ARE destabilizing function is dramatically impeded during hemin-induced erythroid differentiation and not in TPA-induced megakaryocytic differentiation of human erythroleukemic K562 cells. A sequestration of hnRNP D into a hemin-induced protein complex, termed hemin-regulated factor or HRF, correlates well with the loss of ARE-destabilizing function in the cytoplasm. Further experiments show that in hemin-treated cells, ectopic expression of hnRNP D restores the rapid decay directed by the ARE. The extent of destabilizing effect varies among the four isoforms of hnRNP D, with p37 and p42 displaying the most profound effect. These results demonstrate a specific cytoplasmic function for hnRNP D as an RNA-destabilizing protein in ARE-mediated decay pathway. These in vivo findings support an emerging idea that shuttling hnRNP proteins have not only a nuclear but also a cytoplasmic function in mRNA metabolism. The data further imply that shuttling hnRNP proteins define, at least in part, the nuclear history of individual mRNAs and thereby influence their cytoplasmic fate.


Figures

Figure 1
Figure 1
ARE-mediated RNA destabilization in proliferating K562 cells is inhibited during hemin-induced erythroid differentiation. K562 III-2 cells were electroporated with pTetBBB (A) or pTetBBB+ARE bearing various 3′-UTR ARE’s (BD). Cells were kept in medium with 45 ng/ml tetracycline for 22 hr followed by treatment with no drug (proliferating), with 50 μm hemin (erythrocytic differentiation), or with 20 nm TPA (megakaryocytic differentiation) for an additional 24 hr in the presence of 45 ng/ml of tetracycline (+Tet). After transcriptional pulsing (see Materials and Methods), cytoplasmic RNA was isolated immediately for the zero time point or 500 ng/ml Tet was added for the various time intervals as indicated before cytoplasmic RNA was extracted. RNA samples were analyzed by Northern blotting. Poly(A) RNA was prepared in vitro by treating the zero time point sample with oligo(dT) and RNase H. (BBB) β-Globin mRNA; (BBB+ARE) β-globin mRNA bearing an ARE; (GAPDH) glyceraldehyde-3-phosphate dehydrogenase mRNA served as an internal control.
Figure 1
Figure 1
ARE-mediated RNA destabilization in proliferating K562 cells is inhibited during hemin-induced erythroid differentiation. K562 III-2 cells were electroporated with pTetBBB (A) or pTetBBB+ARE bearing various 3′-UTR ARE’s (BD). Cells were kept in medium with 45 ng/ml tetracycline for 22 hr followed by treatment with no drug (proliferating), with 50 μm hemin (erythrocytic differentiation), or with 20 nm TPA (megakaryocytic differentiation) for an additional 24 hr in the presence of 45 ng/ml of tetracycline (+Tet). After transcriptional pulsing (see Materials and Methods), cytoplasmic RNA was isolated immediately for the zero time point or 500 ng/ml Tet was added for the various time intervals as indicated before cytoplasmic RNA was extracted. RNA samples were analyzed by Northern blotting. Poly(A) RNA was prepared in vitro by treating the zero time point sample with oligo(dT) and RNase H. (BBB) β-Globin mRNA; (BBB+ARE) β-globin mRNA bearing an ARE; (GAPDH) glyceraldehyde-3-phosphate dehydrogenase mRNA served as an internal control.
Figure 2
Figure 2
Kinetic analysis of the decay of β-globin mRNA with or without an ARE. Northern blot analysis depicted in the legend to Fig. 1 was analyzed on a digital scanner. The corresponding signals for β-globin mRNA were normalized against the corresponding signals observed for GAPDH. The identities of the AREs tested are indicated at the top of each graph. Symbols correspond to the following treatments: (open oval) proliferating; (solid triangle) 20 nm TPA; (solid oval) 50 μm hemin.
Figure 2
Figure 2
Kinetic analysis of the decay of β-globin mRNA with or without an ARE. Northern blot analysis depicted in the legend to Fig. 1 was analyzed on a digital scanner. The corresponding signals for β-globin mRNA were normalized against the corresponding signals observed for GAPDH. The identities of the AREs tested are indicated at the top of each graph. Symbols correspond to the following treatments: (open oval) proliferating; (solid triangle) 20 nm TPA; (solid oval) 50 μm hemin.
Figure 3
Figure 3
Formation of a specific cytoplasmic ARE/protein super complex in response to hemin-induced erythroid differentiation. (A) Cytoplasmic lysates prepared from proliferating cells (Pr), from cells treated with 20 nm TPA for 24 hr (TPA), or from cells treated with 50 μm hemin for 24 hr were incubated for 15 min with the fos ARE RNA substrate labeled with [32P]UTP. The samples were then treated with RNase T1 for 20 min and the RNA–protein complexes were separated on a nondenaturing 6% polyacrylamide gel. (B) Competition analysis was carried out by incubating cytoplasmic lysate from hemin-treated cells with [32P]UTP-labeled fos–ARE RNA substrate in the presence of increasing amounts of nonlabeled fos ARE RNA (specific) or a β-globin coding region RNA (nonspecific) at the various molar excess as indicated.
Figure 4
Figure 4
The time frame for hemin-induced super complex formation correlates with that of hemin-induced stabilization of the ARE-containing mRNA. (A) Gel mobility shift analyses of cytoplasmic lysates prepared from K562 cells treated with 50 μm hemin for the various time intervals indicated. Cytoplasmic lysates were incubated with a [32P]UTP-labeled fos–ARE RNA, after which RNase T1 digestion was performed. Complexes were then analyzed by electrophoresis through a 6% polyacrylamide nondenaturing gel. (B) Kinetic analysis of Northern blots preformed on K562 III-2 cells transfected with pTetBBB+AREfos and treated with 50 μm hemin for various time intervals. The results were normalized and plotted as described in the legend to Fig. 2 and are depicted as no hemin (open oval), 3 hr hemin treatment (solid oval), 9 hr hemin treatment (open triangle), 12 hr hemin treatment (solid triangle), 16 hr hemin treatment (open square) and 24 hr hemin treatment (solid square).
Figure 4
Figure 4
The time frame for hemin-induced super complex formation correlates with that of hemin-induced stabilization of the ARE-containing mRNA. (A) Gel mobility shift analyses of cytoplasmic lysates prepared from K562 cells treated with 50 μm hemin for the various time intervals indicated. Cytoplasmic lysates were incubated with a [32P]UTP-labeled fos–ARE RNA, after which RNase T1 digestion was performed. Complexes were then analyzed by electrophoresis through a 6% polyacrylamide nondenaturing gel. (B) Kinetic analysis of Northern blots preformed on K562 III-2 cells transfected with pTetBBB+AREfos and treated with 50 μm hemin for various time intervals. The results were normalized and plotted as described in the legend to Fig. 2 and are depicted as no hemin (open oval), 3 hr hemin treatment (solid oval), 9 hr hemin treatment (open triangle), 12 hr hemin treatment (solid triangle), 16 hr hemin treatment (open square) and 24 hr hemin treatment (solid square).
Figure 5
Figure 5
hnRNP D is part of ARE–protein complexes detected in proliferating lysate and becomes an integral part of a hemin super complex induced by hemin. Gel mobility shift assays with a [32P]UTP-labeled fos–ARE probe were performed as described in the legend to Fig. 2. Antibodies against hnRNP D/AUF (α-AUF) or HuR (α-HuR) were added in two ways for antibody super-shift assays, either before (Bf) or after (Af) RNA substrate was mixed with lysate. Cytoplasmic lysates from proliferating K562 III-2 cells (left) or cells treated with 50 μm hemin (right) were as indicated. RNA/lysate/antibody mixtures were then analyzed by nondenaturing 6% polyacrylamide gel electrophoresis. (PI) Preimmune serum.
Figure 6
Figure 6
Hemin induces changes of the subcellular localization of hnRNP D isoforms. (A) Schematic diagram of the four hnRNP D isoforms. The two RNA-binding domains (RBD1 and RBD2) are depicted as the central two gray-shaded regions. The four proteins are identical except for a 19-amino-acid exon present at the amino terminus of p40 and p45 (denoted by the filled square region) and a carboxy-terminal 49-amino-acid region present in p42 and p45 (represented by the dotted region). (B) Cytoplasmic (C) and nuclear (N) proteins of K562 III-2 cells from either proliferation cells (Prolf), cells treated with 20 nm TPA for 24 hr (TPA), or cells treated with 50 μm hemin for 24 hr (Hemin) were separated on a 12% SDS–polyacrylamide gel and transferred to nitrocellulose membranes for Western blot analysis. The blots were probed with a monoclonal antibody (5B9) for endogenous hnRNP D and a monoclonal antibody for α-tubulin simultaneously followed by chemilumenescent detection with an anti-mouse IgG antibody. Molecular weights of the four hnRNP D isoforms as well as α-tubulin are indicated. (C) The time frame for hemin-induced changes of localization of hnRNP D isoforms was analyzed with lysates from K562 III-2 cells treated with 50 μm Hemin for the various time intervals indicated. Equal amounts of cytoplasmic and nuclear protein were used for all experiments.
Figure 6
Figure 6
Hemin induces changes of the subcellular localization of hnRNP D isoforms. (A) Schematic diagram of the four hnRNP D isoforms. The two RNA-binding domains (RBD1 and RBD2) are depicted as the central two gray-shaded regions. The four proteins are identical except for a 19-amino-acid exon present at the amino terminus of p40 and p45 (denoted by the filled square region) and a carboxy-terminal 49-amino-acid region present in p42 and p45 (represented by the dotted region). (B) Cytoplasmic (C) and nuclear (N) proteins of K562 III-2 cells from either proliferation cells (Prolf), cells treated with 20 nm TPA for 24 hr (TPA), or cells treated with 50 μm hemin for 24 hr (Hemin) were separated on a 12% SDS–polyacrylamide gel and transferred to nitrocellulose membranes for Western blot analysis. The blots were probed with a monoclonal antibody (5B9) for endogenous hnRNP D and a monoclonal antibody for α-tubulin simultaneously followed by chemilumenescent detection with an anti-mouse IgG antibody. Molecular weights of the four hnRNP D isoforms as well as α-tubulin are indicated. (C) The time frame for hemin-induced changes of localization of hnRNP D isoforms was analyzed with lysates from K562 III-2 cells treated with 50 μm Hemin for the various time intervals indicated. Equal amounts of cytoplasmic and nuclear protein were used for all experiments.
Figure 7
Figure 7
Ectopic expression of hnRNP D in proliferating K562 cells has little effect on decay of the ARE-containing mRNA. Transfection of K562 III-2 cells, RNA extraction, and RNA blot analysis were carried out as described in the legend to Fig. 1. (A) RNA blots showing decay of the β-globin (BBB) mRNA bearing the fos ARE in the presence (left) or absence (right) of the p42 isoforms in proliferating cells. (B) (Left) Graph showing kinetics of decay of the BBB+AREfos mRNA in proliferating cells overexpressing individual isoforms of hnRNP D. Data collection and analysis are as described in Fig. 2. Symbols are depicted as follows: (Solid oval) Vector alone or control; (solid square) p37; (solid diamond) p40; (x) p42; (+) p45. (Right) Western blot analysis for exogenously expressed myc-tagged hnRNP D was performed as described in the legend to Fig. 6. Cytoplasmic lysates were prepared from proliferating cells transfected with cDNAs for individual isoforms of hnRNP D.
Figure 7
Figure 7
Ectopic expression of hnRNP D in proliferating K562 cells has little effect on decay of the ARE-containing mRNA. Transfection of K562 III-2 cells, RNA extraction, and RNA blot analysis were carried out as described in the legend to Fig. 1. (A) RNA blots showing decay of the β-globin (BBB) mRNA bearing the fos ARE in the presence (left) or absence (right) of the p42 isoforms in proliferating cells. (B) (Left) Graph showing kinetics of decay of the BBB+AREfos mRNA in proliferating cells overexpressing individual isoforms of hnRNP D. Data collection and analysis are as described in Fig. 2. Symbols are depicted as follows: (Solid oval) Vector alone or control; (solid square) p37; (solid diamond) p40; (x) p42; (+) p45. (Right) Western blot analysis for exogenously expressed myc-tagged hnRNP D was performed as described in the legend to Fig. 6. Cytoplasmic lysates were prepared from proliferating cells transfected with cDNAs for individual isoforms of hnRNP D.
Figure 8
Figure 8
Ectopic expression of hnRNP D in hemin-treated K562 cells restore the rapid decay of ARE-containing transcripts. Transfection of K562III-2 cells, RNA extraction, and RNA blot analysis were carried out as described in the legend to Fig. 1. RNA blots showing decay of the β-globin (BBB) mRNA bearing the fos ARE (A) or the GM-CSF ARE (B) in the presence (left) or absence (right) of the p42 isoforms in K562 cells treated with hemin for 24 hr. (C) (Left) Graph showing kinetics of decay of the BBB+AREfos mRNA in hemin-treated cells overexpressing individual isoforms of hnRNP D. Data collection and analysis are as described in the legend to Fig. 2. Symbols are depicted as follows: (Solid oval) Vector alone; (solid square) p37; (solid diamond) p40; (x) p42; (+) p45. (Right) Western blot analysis for exogenously expressed myc-tagged hnRNP D was performed as described in the legend to Fig. 6. Cytoplasmic lysates were prepared from hemin-treated cells transfected with cDNAs for individual isoforms of hnRNP D.
Figure 8
Figure 8
Ectopic expression of hnRNP D in hemin-treated K562 cells restore the rapid decay of ARE-containing transcripts. Transfection of K562III-2 cells, RNA extraction, and RNA blot analysis were carried out as described in the legend to Fig. 1. RNA blots showing decay of the β-globin (BBB) mRNA bearing the fos ARE (A) or the GM-CSF ARE (B) in the presence (left) or absence (right) of the p42 isoforms in K562 cells treated with hemin for 24 hr. (C) (Left) Graph showing kinetics of decay of the BBB+AREfos mRNA in hemin-treated cells overexpressing individual isoforms of hnRNP D. Data collection and analysis are as described in the legend to Fig. 2. Symbols are depicted as follows: (Solid oval) Vector alone; (solid square) p37; (solid diamond) p40; (x) p42; (+) p45. (Right) Western blot analysis for exogenously expressed myc-tagged hnRNP D was performed as described in the legend to Fig. 6. Cytoplasmic lysates were prepared from hemin-treated cells transfected with cDNAs for individual isoforms of hnRNP D.

Similar articles

Cited by

References

    1. Alitalo R. Induced differentiation of K562 leukemia cells: A model for studies of gene expression in early megakaryoblasts. Leuk Res. 1990;14:501–514. - PubMed
    1. Alitalo R, Andersson LC, Betsholtz C, Nilsson K, Westermark B, Heldin CH, Alitalo K. Induction of platelet-derived growth factor gene expression during megakaryoblastic and monocytic differentiation of human leukemia cell lines. EMBO J. 1987;6:1213–1218. - PMC - PubMed
    1. Alitalo R, Mäkelä TP, Koskinen P, Andersson LC, Alitalo K. Enhanced expression of transforming growth factor beta during megakaryoblastic differentiation of K562 leukemia cells. Blood. 1988;71:899–906. - PubMed
    1. Antic D, Keene JD. Insights from model systems-Embryonic lethal abnormal visual RNA-binding proteins involved in growth, differentiation, and posttranscriptional gene expression. Am J Hum Genet. 1997;61:273–278. - PMC - PubMed
    1. Baliga BS, Mankad M, Shah AK, Mankad VN. Mechanism of differentiation of human erythroleukaemic cell line K562 by hemin. Cell Prolif. 1993;26:519–529. - PubMed

Publication types

LinkOut - more resources