. 1999 May 17;189(10):1649-58.
doi: 10.1084/jem.189.10.1649.

Synaptotagmin II negatively regulates Ca2+-triggered exocytosis of lysosomes in mast cells

Affiliations

Synaptotagmin II negatively regulates Ca2+-triggered exocytosis of lysosomes in mast cells

D Baram et al. J Exp Med. .

Abstract

Synaptotagmins (Syts) I and II are believed to act as Ca2+ sensors in the control of neurotransmission. Here we demonstrate that mast cells express Syt II in their lysosomal fraction. We further show that activation of mast cells by either aggregation of FcepsilonRI or by Ca2+ ionophores results in exocytosis of lysosomes, in addition to the well documented exocytosis of their secretory granules. Syt II directly regulates lysosomal exocytosis, whereby overexpression of Syt II inhibited Ca2+-triggered release of the lysosomal processed form of cathepsin D, whereas suppression of Syt II expression markedly potentiated this release. These findings provide evidence for a novel function of Syt II in negatively regulating Ca2+-triggered exocytosis of lysosomes, and suggest that Syt II-regulated secretion from lysosomes may play an important role in mast cell biology.


Figures
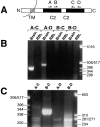
Figure 1
Figure 1
PCR amplification of Syt isoforms. (A) Schematic portrayal of a representative Syt protein and the four primers for the PCR reactions. (B) An agarose gel of electrophoretically separated products of an initial round of PCR performed as described in Materials and Methods, then stained with ethidium bromide. Primer pairs and the source of cDNA for each reaction are shown above the gel, and size markers are shown on the right side. (C) An agarose gel of the products of a second round of PCR, using for a template of the PCR product of RBL cell cDNA with primers A and D. Primer pairs for the second-round reactions are shown above the gel, and size markers are shown on both sides.
Figure 2
Figure 2
RNase protection assay of RBL cell transcripts. Autoradiogram of the products of an RNase protection assay after PAGE. The riboprobes used for hybridization are listed in the top row, the amount of mRNA loaded in each lane is listed in the second row, and a size marker is shown on the left side. This figure is a representative example of an experiment that was repeated four times.
Figure 3
Figure 3
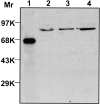
Expression of Syt II protein in mast cells. Whole lysates (106 cell equivalents) derived from RBL-2H3 cells (lane 2), RPMCs (lane 3), BMMCs (lane 4), and a crude brain homogenate (lane 1, 10 μg protein), were resolved by SDS-PAGE and immunoblotted using the mAb 8G2B directed against the NH2 terminus of Syt II.
Figure 4
Figure 4
Overexpression of Syt II in RBL cells. Whole lysates derived from G418-resistant RBL clones (1.5 × 10⁶ cell equivalents), transfected with either the pcDNA3-Syt II recombinant vector (Syt II+, lanes 1–3) or with the empty pcDNA3 vector (control, lanes 4–6) were resolved by SDS-PAGE and immunoblotted using monoclonal 8G2B anti–Syt II antibodies.
Figure 5
Figure 5
Modulation of exocytosis by Syt II. Control (○), Syt II+ (•), and Syt II (▪) cells were incubated for 30 min at 37°C with the indicated concentrations of the Ca2+ ionophore A23187, alone (A) or together with 50 nM TPA (B). The extent of release is presented as percentage of total β-hexosaminidase activity. The results presented in A are from one experiment, which included single clones stably transfected with the empty pcDNA3 vector, the pcDNA3–Syt II recombinant vector, or the pcDNA3–Syt II recombinant vector in the antisense orientation. Similar results were obtained on five occasions and using two additional clones. The data points presented in B are means ± SEM of four determinations and include two independent clones stably transfected with the empty pcDNA3 vector, one clone stably transfected with the pcDNA3-Syt II recombinant vector, and two independent clones stably transfected with pcDNA3-Syt II in the antisense orientation. Similar results were obtained on five occasions. Inset: β-hexosaminidase release of individual clones (1–3 stably transfected with the empty pcDNA3 vector and 4–6 stably transfected with pcDNA3-Syt II in the antisense orientation) at a representative concentration of agonist: A, 10 μM A23187; B, 1 μM A23187 and 50 nM TPA.
Figure 5
Figure 5
Modulation of exocytosis by Syt II. Control (○), Syt II+ (•), and Syt II (▪) cells were incubated for 30 min at 37°C with the indicated concentrations of the Ca2+ ionophore A23187, alone (A) or together with 50 nM TPA (B). The extent of release is presented as percentage of total β-hexosaminidase activity. The results presented in A are from one experiment, which included single clones stably transfected with the empty pcDNA3 vector, the pcDNA3–Syt II recombinant vector, or the pcDNA3–Syt II recombinant vector in the antisense orientation. Similar results were obtained on five occasions and using two additional clones. The data points presented in B are means ± SEM of four determinations and include two independent clones stably transfected with the empty pcDNA3 vector, one clone stably transfected with the pcDNA3-Syt II recombinant vector, and two independent clones stably transfected with pcDNA3-Syt II in the antisense orientation. Similar results were obtained on five occasions. Inset: β-hexosaminidase release of individual clones (1–3 stably transfected with the empty pcDNA3 vector and 4–6 stably transfected with pcDNA3-Syt II in the antisense orientation) at a representative concentration of agonist: A, 10 μM A23187; B, 1 μM A23187 and 50 nM TPA.
Figure 6
Figure 6
Suppression of Syt II expression. Whole lysates derived from G418-resistant RBL clones (1.5 × 10⁶ cell equivalents), transfected with either the pcDNA3-Syt II antisense orientation (Syt II, lanes 1–4) or with the empty pcDNA3 vector (control, lanes 5–7) were resolved by SDS-PAGE and immunoblotted as in Fig. 3.
Figure 7
Figure 7
Modulation of FcεRI-dependent release by Syt II. Passively sensitized control (○), Syt II+ (•), and Syt II (▪) cells were incubated for 30 min at 37°C with the indicated concentrations of the corresponding antigen, DNP-BSA. The extent of release is presented as percentage of total β-hexosaminidase activity. The results presented are of a representative experiment, that included three independent clones, stably transfected with the empty pcDNA3 vector, three independent clones stably transfected with the pcDNA3-Syt II recombinant vector and three independent clones stably transfected with pcDNA3-Syt II in the antisense orientation. The data points are means ± SEM of six determinations. Similar results were obtained on five occasions. Inset: β-hexosaminidase release of individual clones (1–3 stably transfected with the empty pcDNA3 vector and 4–6 stably transfected with pcDNA3-Syt II in the antisense orientation) at a representative concentration of antigen (10 ng/ml DNP-BSA).
Figure 8
Figure 8
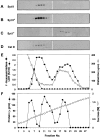
Subcellular fractionation of control and Syt II–transfected RBL cell lysates. Fractions from a continuous sucrose gradient were collected from the top, and assayed for: A, Syt II immunoreactivity in control cells; B, Syt II immunoreactivity in Syt II+ cells; C, Syt I immunoreactivity in Syt I+ cells; D, pro-cathepsin D immunoreactivity; E, β-hexosaminidase activity (presented as OD read at 405 nm) (▪); histamine content (□) and LDH activity (•); (F) protein (•) and sucrose density (○). The data presented in panels E and F is the average of three sucrose gradients performed on control, Syt II+, and Syt I+ cells.
Figure 9
Figure 9
Release of Cathepsin D. (A) Control RBL cells (lanes 1–3), Syt II+ cells (lanes 4–6), and Syt II cells (lanes 7–9) were incubated for 30 min at 37°C with buffer (lanes 1, 4, and 7), 50 ng/ml of the DNP-BSA antigen (lanes 2, 5, and 8), or 10 μM of the Ca2+ ionophore A23187 (lanes 3, 6, and 9). The concentrated cell supernatants were resolved by SDS-PAGE and immunoblotted using anti–cathepsin D (Cat D) antibodies. (B) The intensity of the band corresponding to mature cathepsin D was quantitated by densitometry (using a B.I.S. 202D densitometer, Dinco & Rhenium, Israel) and is presented as fold stimulation of the level in control, nonstimulated cells.
Figure 10
Figure 10
Release of serotonin. Control (○), Syt II+ (•) and Syt II (▪) cells, loaded with [3H]5-hydroxytryptamine (serotonin), were stimulated for 30 min at 37°C with the indicated concentrations of the Ca2+ ionophore A23187 alone (A), together with 50 nM TPA (B), or with the antigen DNP-BSA (C). The extent of serotonin release is presented as percentage of the total radioactivity in the cells. The data points presented are means ± SEM of 8–12 determinations and include three independent clones stably transfected with the empty pcDNA3 vector, three independent clones stably transfected with the pcDNA3-Syt II recombinant vector, and three independent clones stably transfected with pcDNA3-Syt II in the antisense orientation. Statistical analysis was performed using two-tailed student's t test. *P < 0.05; **P < 0.01. Inset: serotonin release of individual clones (1–3 stably transfected with the empty pcDNA3 vector and 4–6 stably transfected with pcDNA3-Syt II in the antisense orientation) at a representative concentration of agonist: A, 10 μM A23187; B, 1 μM A23187 and 50 nM TPA; and C, 10 ng/ml DNP-BSA.
Figure 10
Figure 10
Release of serotonin. Control (○), Syt II+ (•) and Syt II (▪) cells, loaded with [3H]5-hydroxytryptamine (serotonin), were stimulated for 30 min at 37°C with the indicated concentrations of the Ca2+ ionophore A23187 alone (A), together with 50 nM TPA (B), or with the antigen DNP-BSA (C). The extent of serotonin release is presented as percentage of the total radioactivity in the cells. The data points presented are means ± SEM of 8–12 determinations and include three independent clones stably transfected with the empty pcDNA3 vector, three independent clones stably transfected with the pcDNA3-Syt II recombinant vector, and three independent clones stably transfected with pcDNA3-Syt II in the antisense orientation. Statistical analysis was performed using two-tailed student's t test. *P < 0.05; **P < 0.01. Inset: serotonin release of individual clones (1–3 stably transfected with the empty pcDNA3 vector and 4–6 stably transfected with pcDNA3-Syt II in the antisense orientation) at a representative concentration of agonist: A, 10 μM A23187; B, 1 μM A23187 and 50 nM TPA; and C, 10 ng/ml DNP-BSA.
Figure 11
Figure 11
Model of regulation of lysosomal exocytosis by Syt II. According to this model, Syt II is localized to lysosomes (L), where it acts to inhibit fusion with SGs and the plasma membrane, at Ca2+ concentrations that already support SG exocytosis. External signals are predicted to downregulate Syt II and thereby remove this inhibition and facilitate lysosomal exocytosis as well as fusion with SGs.

Similar articles

Cited by

References

    1. Stevens RL, Austen KF. Recent advance in the cellular and molecular biology of mast cells. Immunol Today. 1989;10:381–385. - PubMed
    1. Galli SJ, Gordon JR, Wershil BK. Cytokine production by mast cells and basophils. Curr Opin Immunol. 1991;3:865–872. - PubMed
    1. Metcalfe DD, Kaliner M, Donlon MA. The mast cell. Crit Rev Immunol. 1981;3:23–74. - PubMed
    1. Malaviya R, Ikeda T, Ross E, Abraham SN. Mast cell modulation of neutrophil influx and bacterial clearance at sites of infection through TNF-alpha. Nature. 1996;381:77–80. - PubMed
    1. Prodeus AP, Zhou X, Maurer M, Galli SJ, Carroll MC. Impaired mast cell-dependent natural immunity in complement C3-deficient mice. Nature. 1997;390:172–175. - PubMed

Publication types

MeSH terms