

Role of the mitogen-activated protein kinase Hog1p in morphogenesis and virulence of Candida albicans
- PMID: 10322006
- PMCID: PMC93760
- DOI: 10.1128/JB.181.10.3058-3068.1999
Role of the mitogen-activated protein kinase Hog1p in morphogenesis and virulence of Candida albicans
Abstract
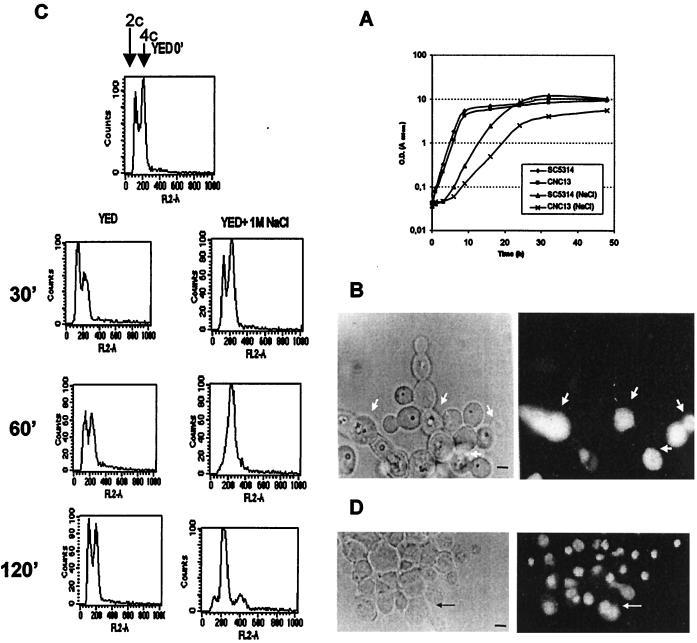
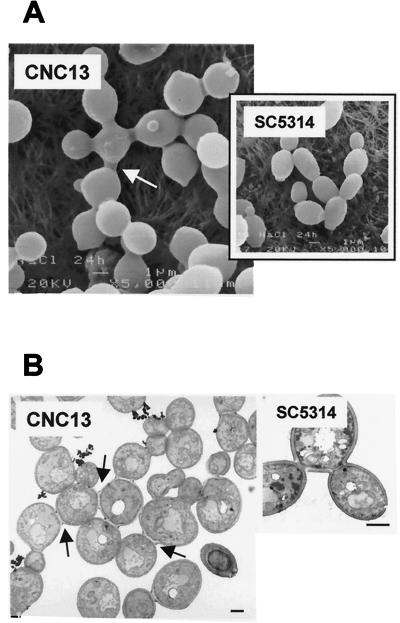
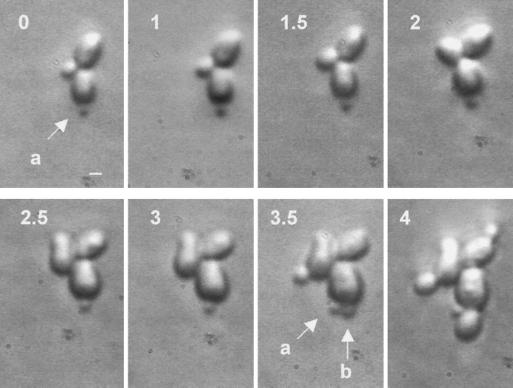
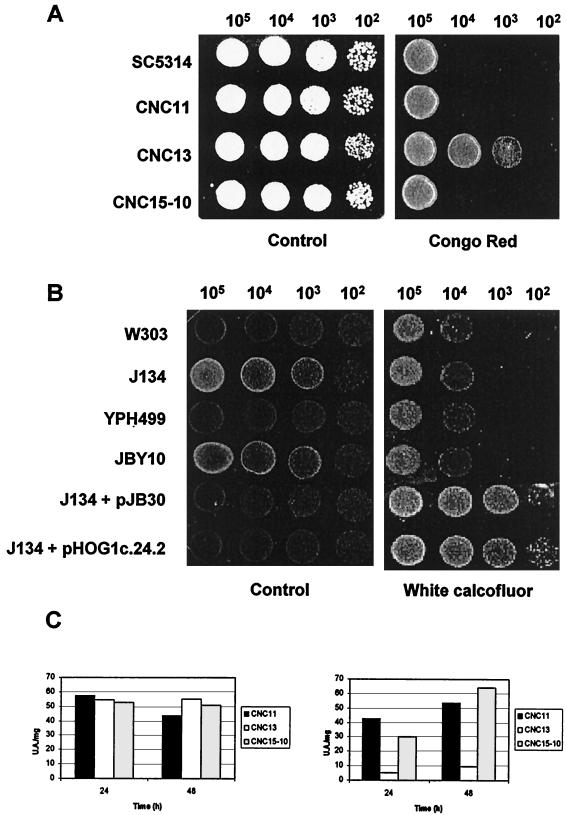
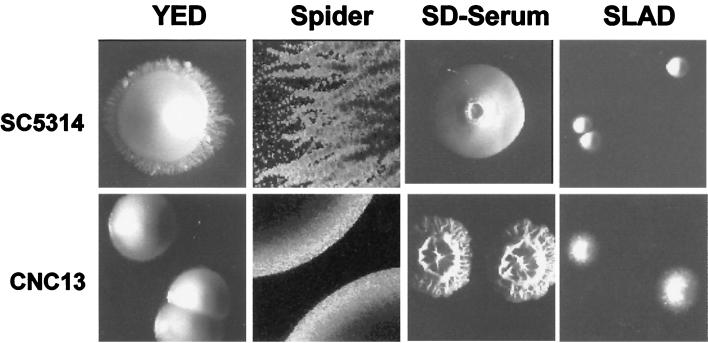
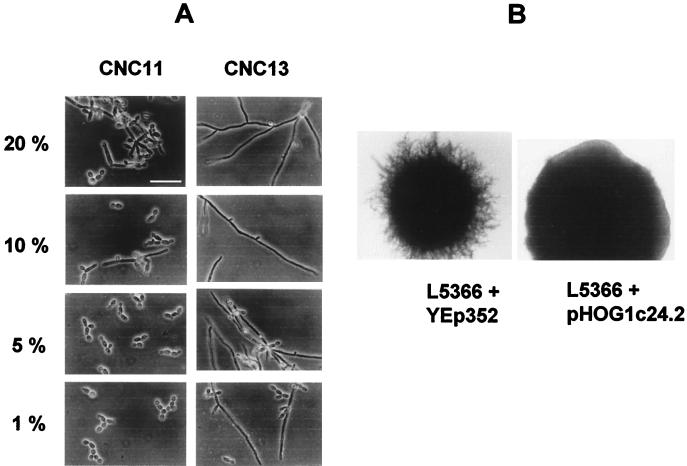
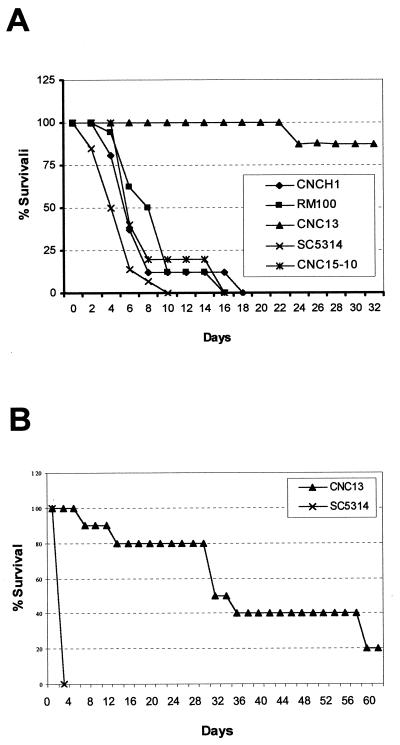
The relevance of the mitogen-activated protein (MAP) kinase Hog1p in Candida albicans was addressed through the characterization of C. albicans strains without a functional HOG1 gene. Analysis of the phenotype of hog1 mutants under osmostressing conditions revealed that this mutant displays a set of morphological alterations as the result of a failure to complete the final stages of cytokinesis, with parallel defects in the budding pattern. Even under permissive conditions, hog1 mutants displayed a different susceptibility to some compounds such as nikkomycin Z or Congo red, which interfere with cell wall functionality. In addition, the hog1 mutant displayed a colony morphology different from that of the wild-type strain on some media which promote morphological transitions in C. albicans. We show that C. albicans hog1 mutants are derepressed in the serum-induced hyphal formation and, consistently with this behavior, that HOG1 overexpression in Saccharomyces cerevisiae represses the pseudodimorphic transition. Most interestingly, deletion of HOG1 resulted in a drastic increase in the mean survival time of systemically infected mice, supporting a role for this MAP kinase pathway in virulence of pathogenic fungi. This finding has potential implications in antifungal therapy.
Figures
Similar articles
-
A role for the MAP kinase gene MKC1 in cell wall construction and morphological transitions in Candida albicans.Microbiology (Reading). 1998 Feb;144 ( Pt 2):411-424. doi: 10.1099/00221287-144-2-411. Microbiology (Reading). 1998. PMID: 9493378
-
Derepressed hyphal growth and reduced virulence in a VH1 family-related protein phosphatase mutant of the human pathogen Candida albicans.Mol Biol Cell. 1997 Dec;8(12):2539-51. doi: 10.1091/mbc.8.12.2539. Mol Biol Cell. 1997. PMID: 9398674 Free PMC article.
-
The mitogen-activated protein kinase homolog HOG1 gene controls glycerol accumulation in the pathogenic fungus Candida albicans.J Bacteriol. 1996 Oct;178(19):5850-2. doi: 10.1128/jb.178.19.5850-5852.1996. J Bacteriol. 1996. PMID: 8824643 Free PMC article.
-
Stress-Activated Protein Kinases in Human Fungal Pathogens.Front Cell Infect Microbiol. 2019 Jul 17;9:261. doi: 10.3389/fcimb.2019.00261. eCollection 2019. Front Cell Infect Microbiol. 2019. PMID: 31380304 Free PMC article. Review.
-
The HOG MAPK pathway in Candida albicans: more than an osmosensing pathway.Int Microbiol. 2020 Jan;23(1):23-29. doi: 10.1007/s10123-019-00069-1. Epub 2019 Mar 14. Int Microbiol. 2020. PMID: 30875035 Review.
Cited by
-
Oxidative stress responses in the human fungal pathogen, Candida albicans.Biomolecules. 2015 Feb 25;5(1):142-65. doi: 10.3390/biom5010142. Biomolecules. 2015. PMID: 25723552 Free PMC article. Review.
-
Fungal Hsp90: a biological transistor that tunes cellular outputs to thermal inputs.Nat Rev Microbiol. 2012 Oct;10(10):693-704. doi: 10.1038/nrmicro2875. Nat Rev Microbiol. 2012. PMID: 22976491 Free PMC article. Review.
-
Disordered cell integrity signaling caused by disruption of the kexB gene in Aspergillus oryzae.Eukaryot Cell. 2004 Aug;3(4):1036-48. doi: 10.1128/EC.3.4.1036-1048.2004. Eukaryot Cell. 2004. PMID: 15302836 Free PMC article.
-
The high-osmolarity glycerol response pathway in the human fungal pathogen Candida glabrata strain ATCC 2001 lacks a signaling branch that operates in baker's yeast.Eukaryot Cell. 2007 Sep;6(9):1635-45. doi: 10.1128/EC.00106-07. Epub 2007 Jul 6. Eukaryot Cell. 2007. PMID: 17616630 Free PMC article.
-
The Sho1 adaptor protein links oxidative stress to morphogenesis and cell wall biosynthesis in the fungal pathogen Candida albicans.Mol Cell Biol. 2005 Dec;25(23):10611-27. doi: 10.1128/MCB.25.23.10611-10627.2005. Mol Cell Biol. 2005. PMID: 16287872 Free PMC article.
References
-
- Ausubel F M, Kingston R E, Brent R, et al., editors. Current protocols in molecular biology. New York, N.Y: Wiley Interscience; 1993.
-
- Blomberg A, Adler L. Physiology of osmotolerance in fungi. Adv Microb Physiol. 1992;33:145–212. - PubMed
-
- Braun B R, Johnson A D. Control of filament formation in Candida albicans by the transcriptional repressor TUP1. Science. 1997;277:105–109. - PubMed
Publication types
MeSH terms
Substances
LinkOut - more resources
Full Text Sources
Other Literature Sources
Medical
Molecular Biology Databases
