. 1999 May 3;145(3):425-35.
doi: 10.1083/jcb.145.3.425.

The maize homologue of the cell cycle checkpoint protein MAD2 reveals kinetochore substructure and contrasting mitotic and meiotic localization patterns

Affiliations

The maize homologue of the cell cycle checkpoint protein MAD2 reveals kinetochore substructure and contrasting mitotic and meiotic localization patterns

H G Yu et al. J Cell Biol. .

Abstract

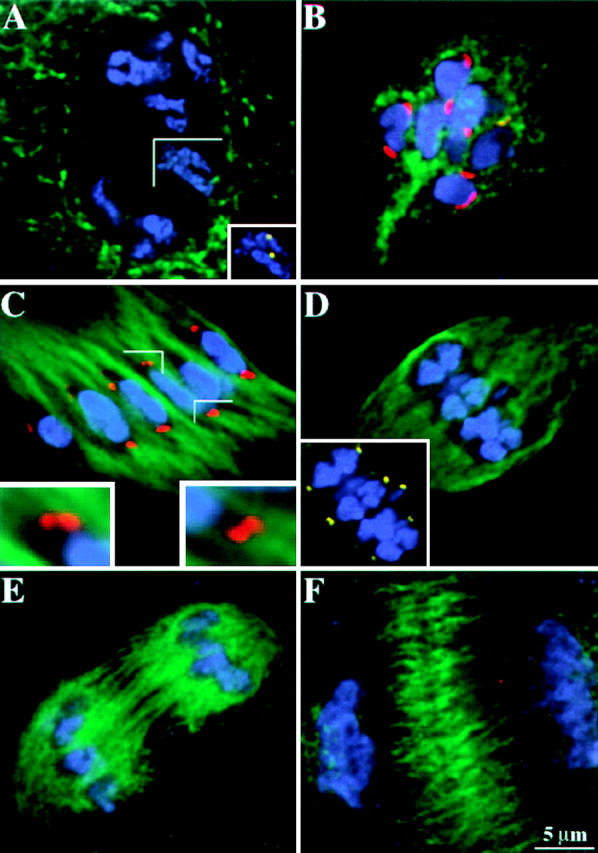
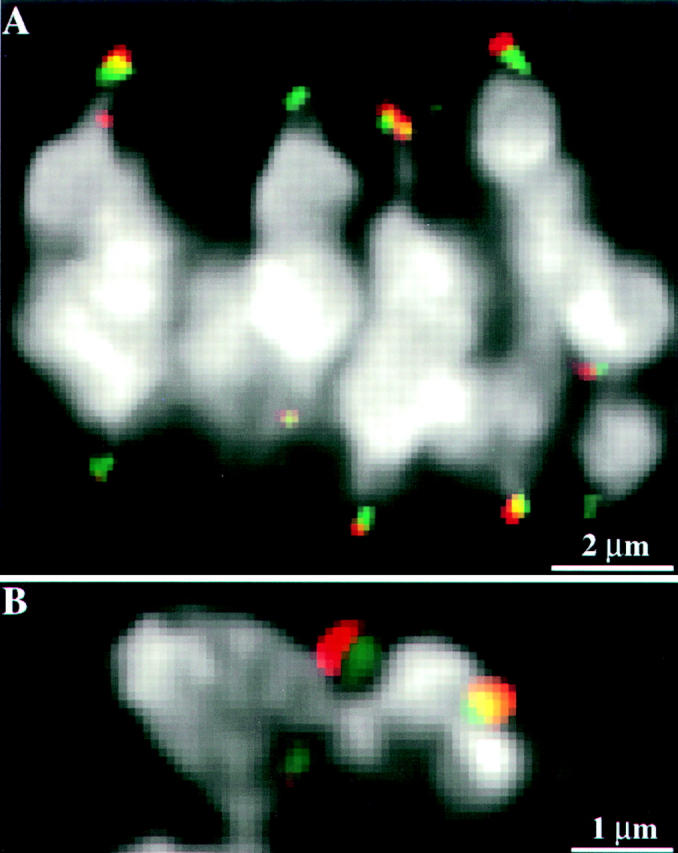
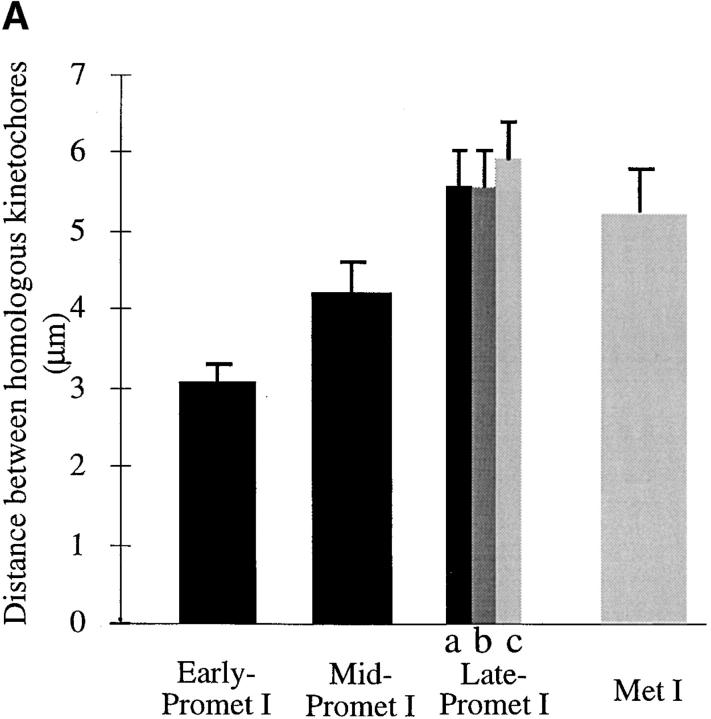
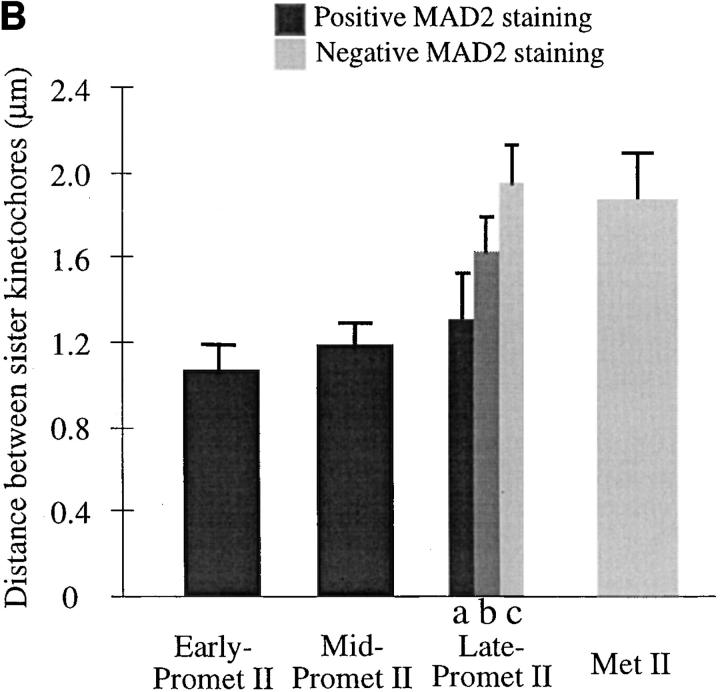
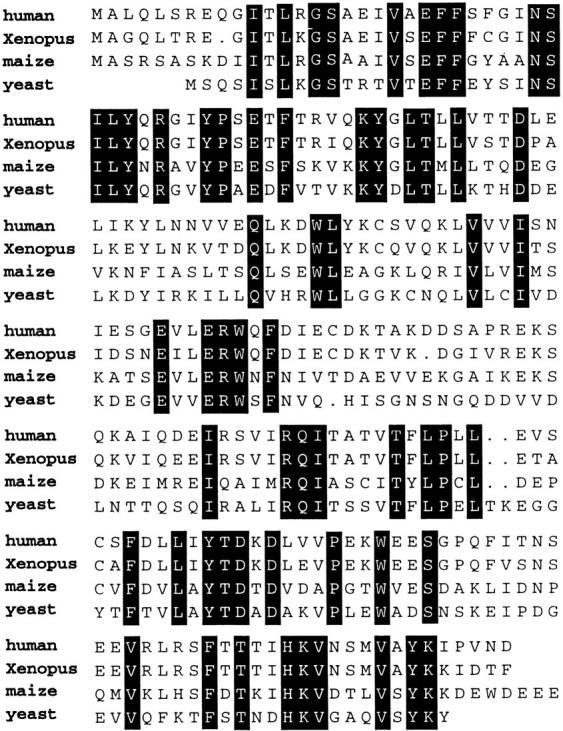
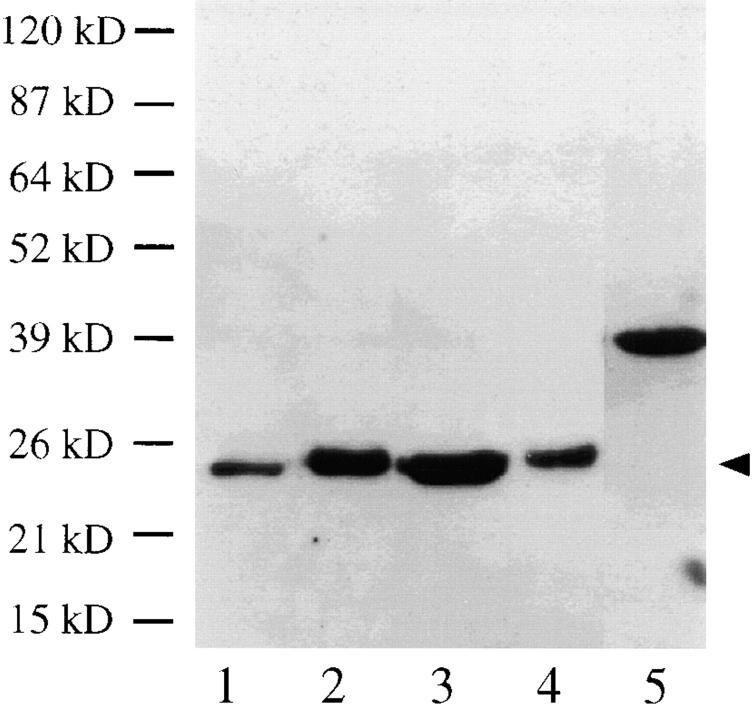
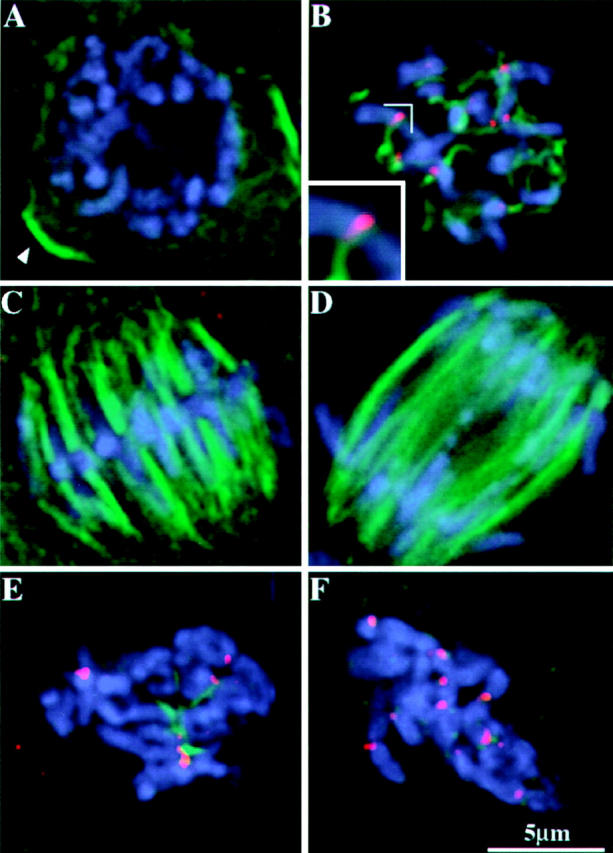
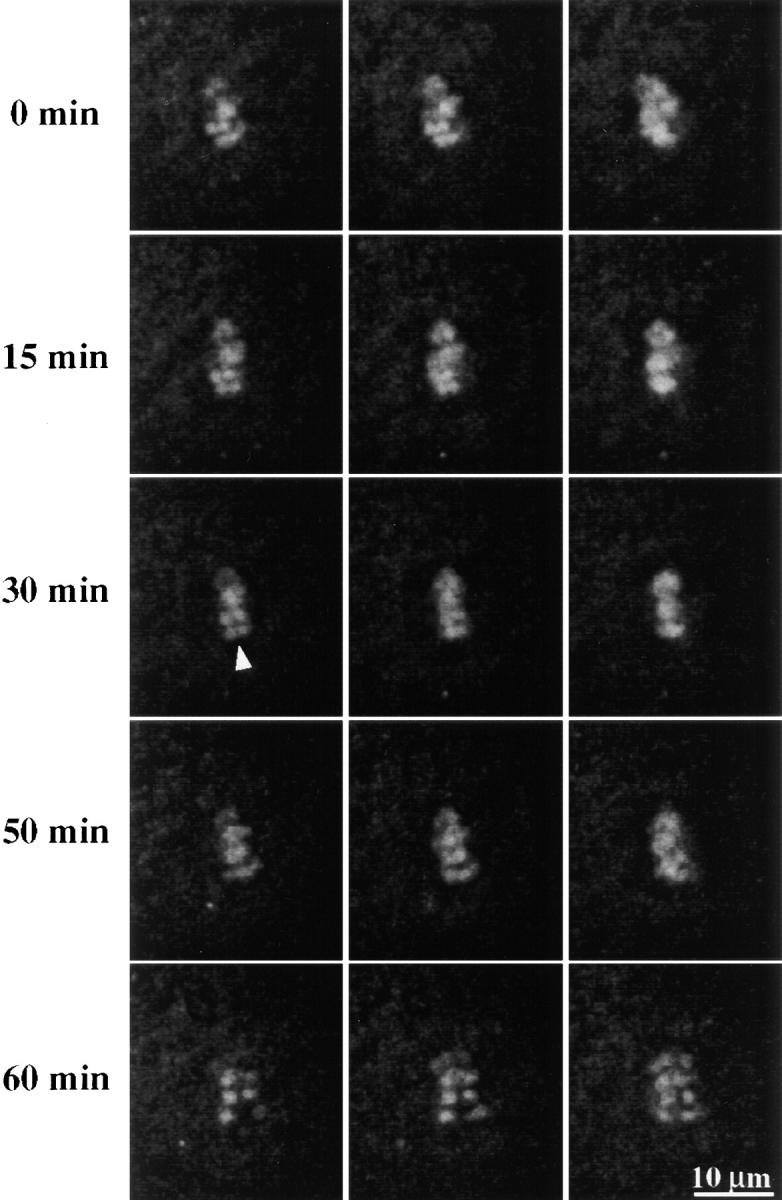
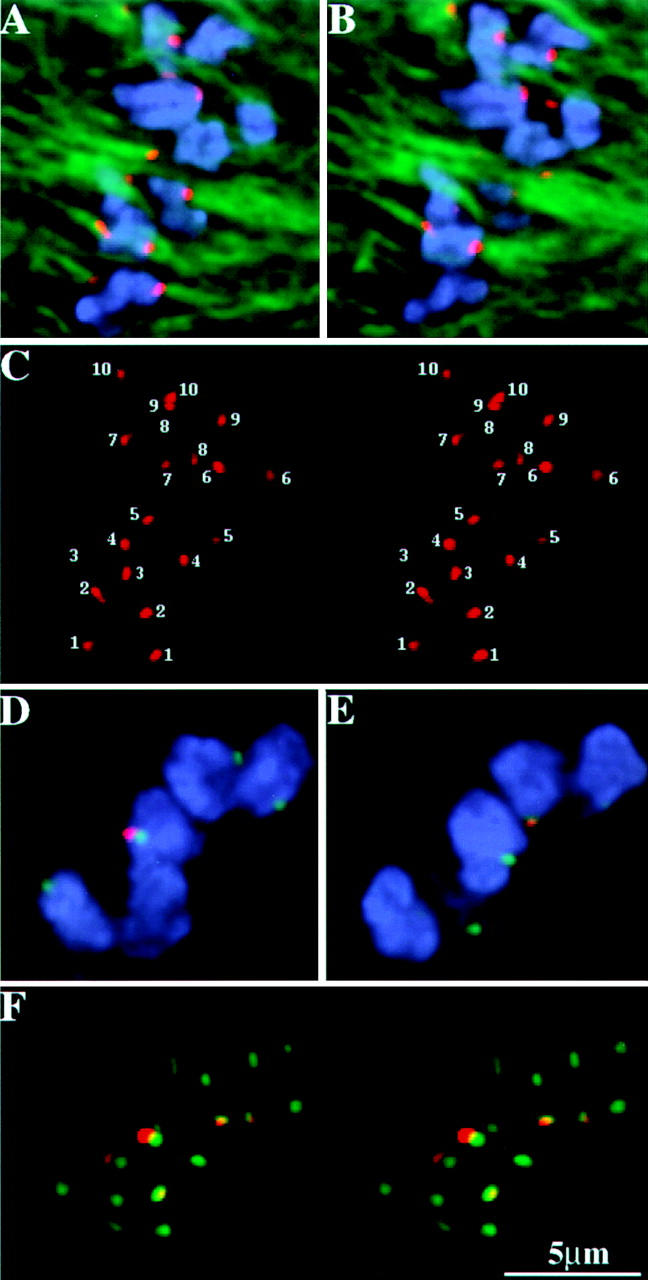
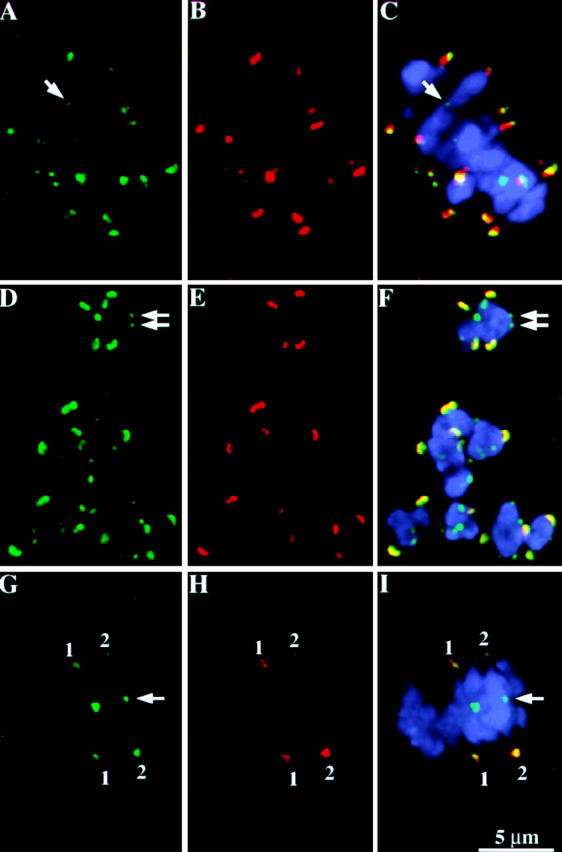
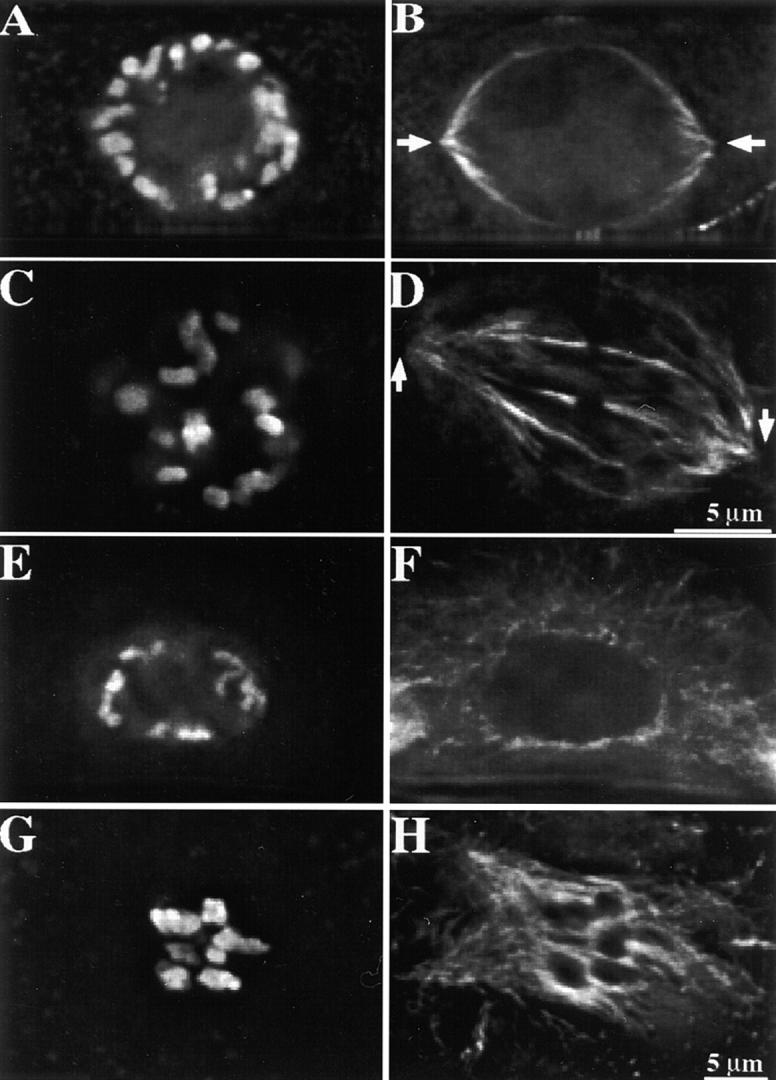
We have identified a maize homologue of yeast MAD2, an essential component in the spindle checkpoint pathway that ensures metaphase is complete before anaphase begins. Combined immunolocalization of MAD2 and a recently cloned maize CENPC homologue indicates that MAD2 localizes to an outer domain of the prometaphase kinetochore. MAD2 staining was primarily observed on mitotic kinetochores that lacked attached microtubules; i.e., at prometaphase or when the microtubules were depolymerized with oryzalin. In contrast, the loss of MAD2 staining in meiosis was not correlated with initial microtubule attachment but was correlated with a measure of tension: the distance between homologous or sister kinetochores (in meiosis I and II, respectively). Further, the tension-sensitive 3F3/2 phosphoepitope colocalized, and was lost concomitantly, with MAD2 staining at the meiotic kinetochore. The mechanism of spindle assembly (discussed here with respect to maize mitosis and meiosis) is likely to affect the relative contributions of attachment and tension. We support the idea that MAD2 is attachment-sensitive and that tension stabilizes microtubule attachments.


Figures

Figure 6
Figure 6
MAD2 localization in meiosis I. Chromosomes are shown in blue, microtubules are shown in green, MAD2 is shown in red, CENPC is shown in yellow. The MAD2 and CENPC antibodies were directly labeled in the cells presented in images A, D, and F. The images shown here are partial projections. (A) Prophase I. Note the absence of MAD2 staining. The inset shows CENPC staining in the same cell. (B) Early prometaphase I. MAD2 staining is apparent at kinetochores. (C) Late prometaphase I. MAD2 staining is conspicuous on extended kinetochores. The insets show enlarged views of strong MAD2 and associated microtubule staining. Under favorable conditions, sister kinetochores are visualized as doublets. (D) Metaphase I. Note the gaps between homologous chromosomes and the absence of MAD2 staining on kinetochores. The inset shows CENPC staining in the same cell. (E) Anaphase I. There is no MAD2 staining at anaphase. (F) Telophase I. There is no MAD2 staining at telophase.
Figure 3
Figure 3
MAD2 localizes to an outer domain of the meiotic kinetochore. Chromosome staining is in white, CENPC staining is in green: MAD2 staining is in red. (A) A single optical section from a three-dimensional data set showing the relative localization of CENPC and MAD2 on prometaphase I kinetochores. CENPC is localized close to the chromosomes while MAD2 is localized to an outer domain. (B) A single optical section from a prometaphase II cell showing a similar localization pattern of CENPC and MAD2 on kinetochores in meiosis II. In B, there is a noticeable ∼0.1-μm shift of the MAD2 signal (leftward relative to the chromatin) caused by the polychroic mirror system used in data acquisition. Apparently because image displacement varies slightly with sample preparation (Hiraoka et al., 1991), it is not as noticeable in A.
Figure 8
Figure 8
MAD2 staining at prometaphase-metaphase I and II is correlated with the distance between homologous/sister kinetochores. The stage definition in this figure is as follows: (Early prometaphase) The nuclear envelope has broken down but there is no bipolar spindle established. (Mid-prometaphase) A bipolar spindle has formed but the chromosomes are randomly dispersed in the cell. (Late-prometaphase) The chromosomes are located in the vicinity of the metaphase-plate but are not fully aligned (Metaphase) Chromosomes are perfectly aligned at the metaphase-plate. (A) Summary of MAD2 staining at prometaphase-metaphase I. (B) Summary of MAD2 staining at prometaphase-metaphase II. (a) Both homologous/sister kinetochores are positively stained by MAD2; (b) only one homologous/sister kinetochore is stained; (c) neither homologous/sister kinetochores are stained. A kinetochore was counted as positively stained when the fluorescence signal could be detected over background; by this method, even the most weakly stained kinetochores were counted as positive. This scoring method was used only as a means to categorize the data and is not meant to imply that MAD2 staining is an all or nothing event. Error bars indicate the standard deviation (n > 5 in each case).
Figure 8
Figure 8
MAD2 staining at prometaphase-metaphase I and II is correlated with the distance between homologous/sister kinetochores. The stage definition in this figure is as follows: (Early prometaphase) The nuclear envelope has broken down but there is no bipolar spindle established. (Mid-prometaphase) A bipolar spindle has formed but the chromosomes are randomly dispersed in the cell. (Late-prometaphase) The chromosomes are located in the vicinity of the metaphase-plate but are not fully aligned (Metaphase) Chromosomes are perfectly aligned at the metaphase-plate. (A) Summary of MAD2 staining at prometaphase-metaphase I. (B) Summary of MAD2 staining at prometaphase-metaphase II. (a) Both homologous/sister kinetochores are positively stained by MAD2; (b) only one homologous/sister kinetochore is stained; (c) neither homologous/sister kinetochores are stained. A kinetochore was counted as positively stained when the fluorescence signal could be detected over background; by this method, even the most weakly stained kinetochores were counted as positive. This scoring method was used only as a means to categorize the data and is not meant to imply that MAD2 staining is an all or nothing event. Error bars indicate the standard deviation (n > 5 in each case).
Figure 1
Figure 1
Protein sequence comparisons among human, Xenopus, maize, and budding yeast MAD2 homologues. Shaded amino acids are conserved. These sequence data are also available from GenBank under accession number AF143681.
Figure 2
Figure 2
MAD2 protein blot. Lane 1, root; lane 2, young leaf; lane 3, young ear; lane 4, tassel; lane 5, recombinant thioredoxin-MAD2 fusion protein. A single 24-kD protein (arrowhead) was identified in all maize tissues. Roughly equal amounts of protein were loaded in each lane. The relative intensity differences (and apparent slight mobility differences) were observed in two separate experiments. The thioredoxin-MAD2 fusion protein is 39 kD due to the added weight of the thioredoxin moiety.
Figure 4
Figure 4
MAD2 localization in mitotic root tip cells. Images shown here are partial projections. Chromosomes are shown in blue, microtubules are shown in green, MAD2 is shown in red. (A) Prophase. Note the absence of MAD2 staining. The remnant of a preprophase band is still visible in cross-section (see arrow; the preprophase band is a microtubule-containing structure that predicts the future division plane in plant mitosis). (B) Prometaphase. Short segments of spindle fiber are present, and MAD2 is evident at centromeric regions. Inset shows that the association of a spindle fiber reduces the intensity of MAD2 staining (this partial projection shows all the MAD2 staining on the chromosome). (C) Metaphase. MAD2 is not detectable on metaphase chromosomes. (D) Anaphase. MAD2 staining is not detectable on anaphase chromosomes. (E) Root meristematic cells treated for 4 h with oryzalin. A prometaphase-like stage is apparent with the most intense MAD2 staining on chromosomes that lack associated K-fiber remnants. (F) Root meristematic cells treated for 8 h with oryzalin. All microtubules are depolymerized and all kinetochores stain brightly for MAD2.
Figure 5
Figure 5
Time-lapse sequence showing a maize meiosis I cell undergoing prometaphase, metaphase, and metaphase/anaphase transition. Columns represent the same optical section at subsequent indicated time points. Note the gap between homologues is visible after chromosome alignment (arrowhead).
Figure 7
Figure 7
MAD2 localization in meiosis II. The chromosomes are shown in blue, microtubules (A and B) and CENPC (D–F) are shown in green, and MAD2 is shown in red. (A and B) Two optical sections from a prometaphase II cell showing MAD2 staining of roughly equal intensity on sister kinetochores. (C) A stereo-pair of all the kinetochores in the cell presented in A and B showing positive MAD2 staining (each pair of kinetochores is labeled with a different number). (D and E) Two optical sections from a late-prometaphase II cell. (F) A stereo-pair of all kinetochores in this cell presented in D and E. Note that MAD2 is only present on a few of the kinetochores.
Figure 9
Figure 9
MAD2 and the 3F3/2 antigen colocalize to an outer domain of the meiotic kinetochore. Each row represents data from a single cell, with single-wavelength images shown in the first two panels followed by a three-color overlay (including chromosomes) in the third panel. The 3F3/2 antigen is localized at kinetochores as well as non-kinetochore locations, which may represent chiasmata (noted by arrows). (A–C) Double labeling of the 3F3/2 antigen and CENPC at mid prometaphase I. 3F3/2 staining is shown in green; CENPC in red; and chromosomes in blue. Note that the 3F3/2 antigen and CENPC (like MAD2 and CENPC) do not colocalize; the 3F3/2 antigen lies in domain outside of the CENPC domain. (D–F) Double labeling of the 3F3/2 antigen and MAD2 at early prometaphase I. 3F3/2 staining is shown in green; MAD2 in red; and chromosomes in blue. This is a partial projection of a prometaphase I cell including eight optical sections (2.4 μm). (G–I) Double labeling of the 3F3/2 antigen and MAD2 at late prometaphase I. 3F3/2 staining is shown in green; MAD2 in red; and chromosomes in blue. This is a partial projection of a prometaphase I cell including 10 optical sections (3 μm). 3F3/2 staining is shown in green; MAD2 in red; and chromosomes in blue. Note that only two pairs of homologous kinetochores are positively stained by both antibodies (pairs 1 and 2). The lower kinetochore of pair 2 is strongly stained by both antibodies, while the upper kinetochore of this pair is weakly stained simultaneously by both antibodies.
Figure 10
Figure 10
Spindle formation in maize mitosis and meiosis. Partial projections from two to three optical sections are shown here. Chromosomes are shown in A, C, E, and G; microtubules in B, D, F, and H. (A and B) A mitotic cell at late prophase. Note the formation of the perinuclear spindle apparatus. Arrows indicate the defined spindle poles. (C and D) A mitotic cell at prometaphase. Note the tapered spindle poles at this stage (arrows). (E and F) A meiotic cell at prophase II. No spindle apparatus is visible at this stage. Note microtubules radiating from the nuclear envelope. (G and H) A meiotic cell at prometaphase II. An amorphous spindle is forming around the chromosome mass.

Similar articles

Cited by

References

    1. Anthony RG, Waldin TR, Ray JA, Bright SWJ, Hussey PJ. Herbicide resistance caused by spontaneous mutation of the cytoskeletal protein tubulin. Nature. 1998;393:260–263. - PubMed
    1. Asai DJ, Brokaw CJ, Thompson WC, Wilson L. Two different monoclonal antibodies to tubulin inhibit the bending of reactivated sea urchin spermatozoa. Cell Motil. 1982;2:599–614. - PubMed
    1. Atschul SF, Gish W, Miller W, Myers EW, Lipman DJ. Basic local alignment search tool. J Mol Biol. 1990;215:403–410. - PubMed
    1. Ault JG, Nicklas RB. Tension, microtubule rearrangements, and the proper distribution of chromosomes in mitosis. Chromosoma. 1989;98:33–39. - PubMed
    1. Bajer, A.S., and J. Molé-Bajer. 1972. Spindle Dynamics and Chromosome Movements. Academic Press, New York.

Publication types

MeSH terms

Associated data