

Phosphorylation-induced rearrangement of the histone H3 NH2-terminal domain during mitotic chromosome condensation
- PMID: 10209020
- PMCID: PMC2133119
- DOI: 10.1083/jcb.145.2.225
Phosphorylation-induced rearrangement of the histone H3 NH2-terminal domain during mitotic chromosome condensation
Abstract
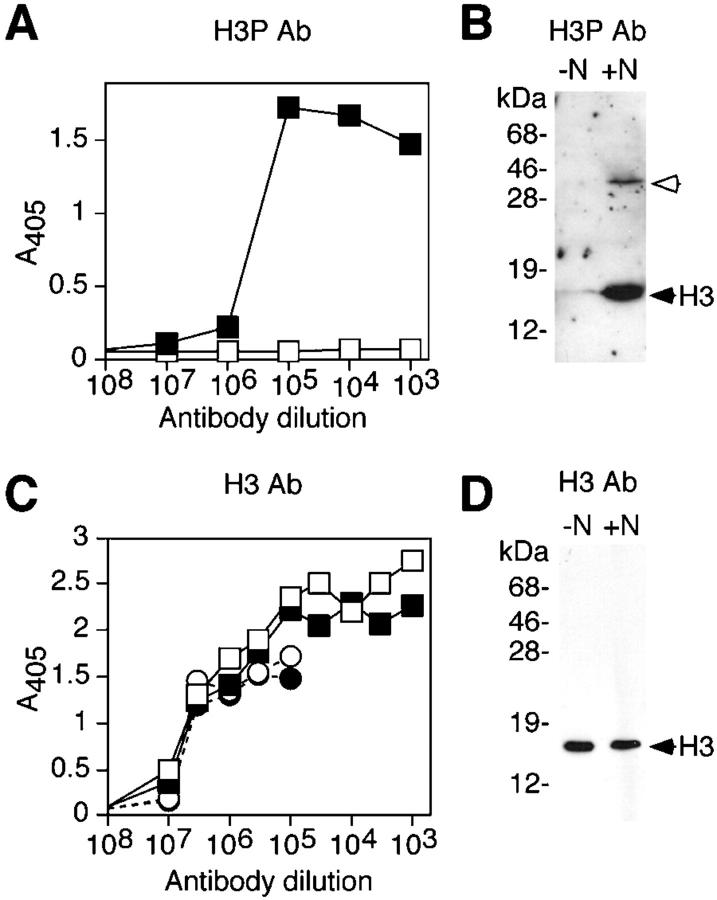
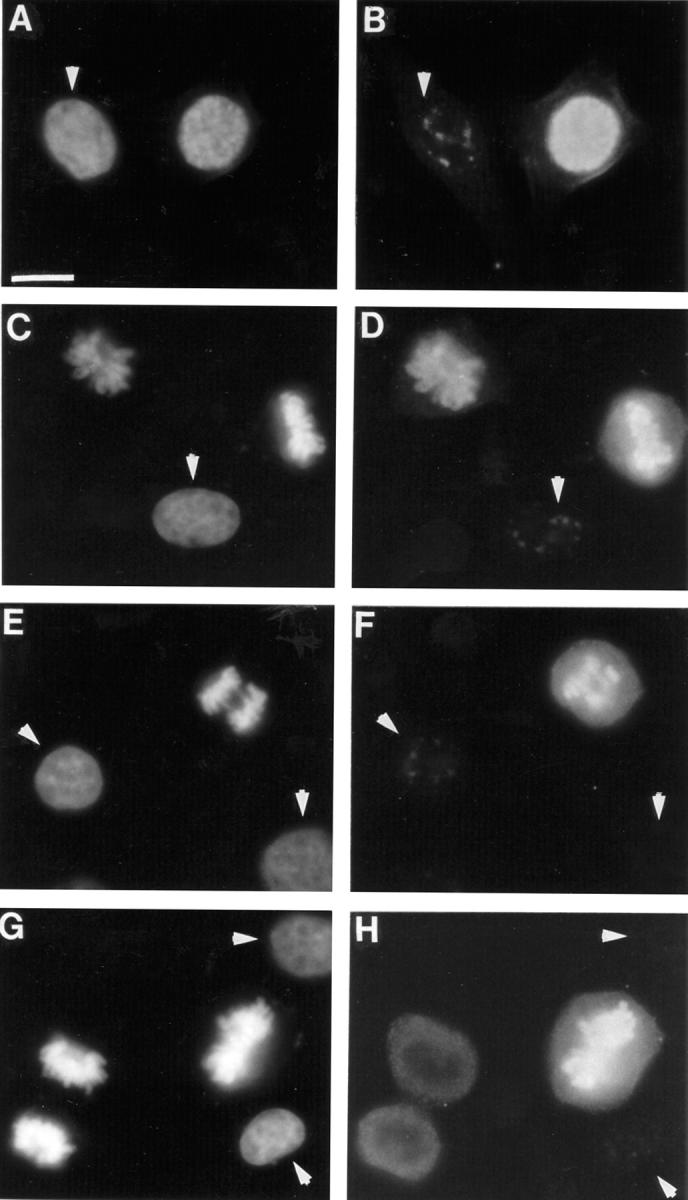
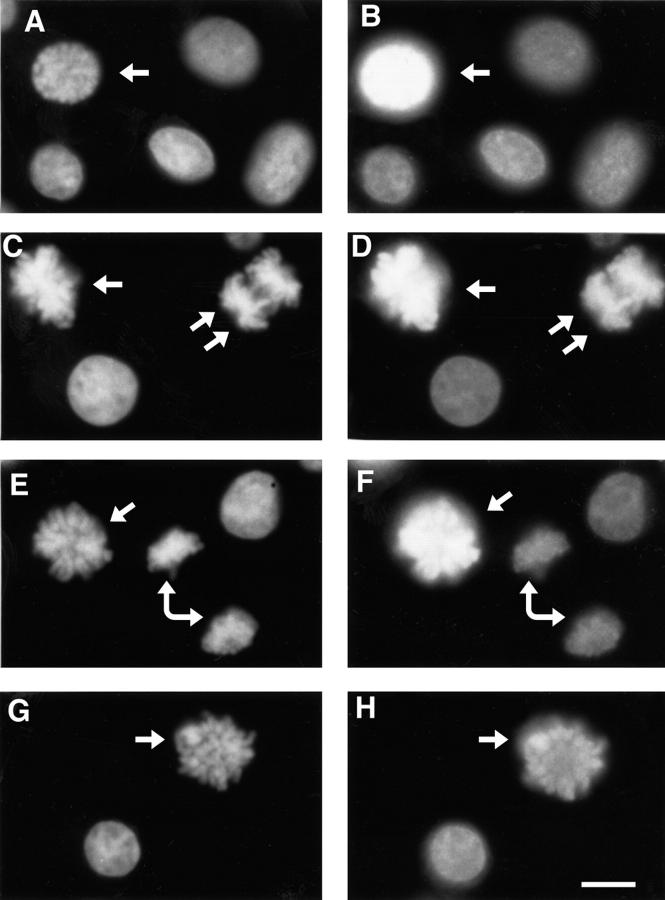
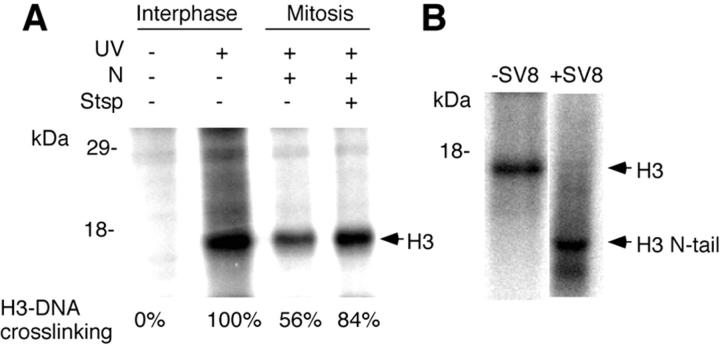
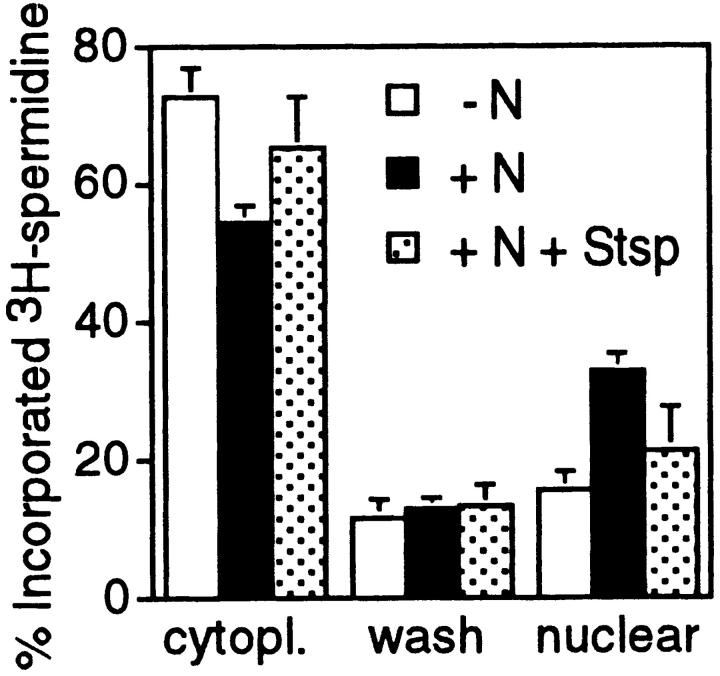
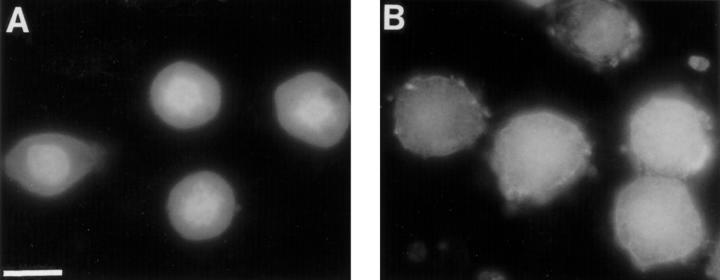
The NH2-terminal domain (N-tail) of histone H3 has been implicated in chromatin compaction and its phosphorylation at Ser10 is tightly correlated with mitotic chromosome condensation. We have developed one mAb that specifically recognizes histone H3 N-tails phosphorylated at Ser10 (H3P Ab) and another that recognizes phosphorylated and unphosphorylated H3 N-tails equally well (H3 Ab). Immunocytochemistry with the H3P Ab shows that Ser10 phosphorylation begins in early prophase, peaks before metaphase, and decreases during anaphase and telophase. Unexpectedly, the H3 Ab shows stronger immunofluorescence in mitosis than interphase, indicating that the H3 N-tail is more accessible in condensed mitotic chromatin than in decondensed interphase chromatin. In vivo ultraviolet laser cross-linking indicates that the H3 N-tail is bound to DNA in interphase cells and that binding is reduced in mitotic cells. Treatment of mitotic cells with the protein kinase inhibitor staurosporine causes histone H3 dephosphorylation and chromosome decondensation. It also decreases the accessibility of the H3 N-tail to H3 Ab and increases the binding of the N-tail to DNA. These results indicate that a phosphorylation-dependent weakening of the association between the H3 N-tail and DNA plays a role in mitotic chromosome condensation.
Figures


Similar articles
-
Histone H3 phosphorylation and expression of cyclins A and B1 measured in individual cells during their progression through G2 and mitosis.Cytometry. 1998 Jun 1;32(2):71-7. doi: 10.1002/(sici)1097-0320(19980601)32:2<71::aid-cyto1>3.0.co;2-h. Cytometry. 1998. PMID: 9627219
-
Relationship between histone phosphorylation and premature chromosome condensation.Exp Cell Res. 1983 Oct 15;148(2):293-302. doi: 10.1016/0014-4827(83)90153-2. Exp Cell Res. 1983. PMID: 6628559
-
H3 phosphorylation: dual role in mitosis and interphase.Biochem Cell Biol. 2009 Oct;87(5):695-709. doi: 10.1139/O09-053. Biochem Cell Biol. 2009. PMID: 19898522 Review.
-
[Studies of distribution of phosphorylated H3 in human MCF-7 cells by immunofluroescence labeling].Yi Chuan Xue Bao. 2002 Jun;29(6):471-5. Yi Chuan Xue Bao. 2002. PMID: 12096621 Chinese.
-
Phosphorylation of serine 10 in histone H3, what for?J Cell Sci. 2003 Sep 15;116(Pt 18):3677-85. doi: 10.1242/jcs.00735. J Cell Sci. 2003. PMID: 12917355 Review.
Cited by
-
Developmental exposure to 50 parts-per-billion arsenic influences histone modifications and associated epigenetic machinery in a region- and sex-specific manner in the adult mouse brain.Toxicol Appl Pharmacol. 2015 Oct 1;288(1):40-51. doi: 10.1016/j.taap.2015.07.013. Epub 2015 Jul 17. Toxicol Appl Pharmacol. 2015. PMID: 26193056 Free PMC article.
-
Histone H3 phosphorylation of mammalian chromosomes.Chromosome Res. 2001;9(6):487-94. doi: 10.1023/a:1011684613144. Chromosome Res. 2001. PMID: 11592483
-
Nickel compounds induce phosphorylation of histone H3 at serine 10 by activating JNK-MAPK pathway.Carcinogenesis. 2008 Jun;29(6):1276-81. doi: 10.1093/carcin/bgn084. Epub 2008 Mar 28. Carcinogenesis. 2008. PMID: 18375956 Free PMC article.
-
β-N-Acetylglucosamine (O-GlcNAc) is a novel regulator of mitosis-specific phosphorylations on histone H3.J Biol Chem. 2012 Apr 6;287(15):12195-203. doi: 10.1074/jbc.M111.315804. Epub 2012 Feb 27. J Biol Chem. 2012. PMID: 22371497 Free PMC article.
-
Core histone N-termini play an essential role in mitotic chromosome condensation.EMBO J. 2000 Feb 1;19(3):379-91. doi: 10.1093/emboj/19.3.379. EMBO J. 2000. PMID: 10654937 Free PMC article.
References
-
- Ajiro K, Yoda K, Utsumi K, Nishikawa Y. Alteration of cell cycle– dependent histone phosphorylations by okadaic acid. Induction of mitosis-specific H3 phosphorylation and chromatin condensation in mammalian interphase cells. J Biol Chem. 1996;271:13197–13201. - PubMed
-
- Anderson H, Roberge M. Topoisomerase II inhibitors affect entry into mitosis and chromosome condensation in BHK cells. Cell Growth Diff. 1996;7:83–90. - PubMed
-
- Anderson HJ, Coleman JE, Andersen RJ, Roberge M. Cytotoxic peptides hemiasterlin, hemiasterlin A, and hemiasterlin B induce mitotic arrest and abnormal spindle formation. Cancer Chemother Pharmacol. 1997;39:223–226. - PubMed
-
- Ausio J, Dong F, van Holde KE. Use of selectively trypsinized nucleosome core particles to analyze the role of the histone tails in the stabilization of the nucleosome. J Mol Biol. 1989;206:451–463. - PubMed
-
- Banéres J-L, Martin A, Parello J. The N tails of histones H3 and H4 adopt a highly structured conformation in the nucleosome. J Mol Biol. 1997;273:503–508. - PubMed
