High-efficiency gene transfer into skeletal muscle mediated by electric pulses
- PMID: 10200250
- PMCID: PMC16320
- DOI: 10.1073/pnas.96.8.4262
High-efficiency gene transfer into skeletal muscle mediated by electric pulses
Abstract
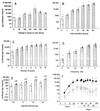
Gene delivery to skeletal muscle is a promising strategy for the treatment of muscle disorders and for the systemic secretion of therapeutic proteins. However, present DNA delivery technologies have to be improved with regard to both the level of expression and interindividual variability. We report very efficient plasmid DNA transfer in muscle fibers by using square-wave electric pulses of low field strength (less than 300 V/cm) and of long duration (more than 1 ms). Contrary to the electropermeabilization-induced uptake of small molecules into muscle fibers, plasmid DNA has to be present in the tissue during the electric pulses, suggesting a direct effect of the electric field on DNA during electrotransfer. This i.m. electrotransfer method increases reporter and therapeutic gene expression by several orders of magnitude in various muscles in mouse, rat, rabbit, and monkey. Moreover, i.m. electrotransfer strongly decreases variability. Stability of expression was observed for at least 9 months. With a pCMV-FGF1 plasmid coding for fibroblast growth factor 1, this protein was immunodetected in the majority of muscle fibers subjected to the electric pulses. DNA electrotransfer in muscle may have broad applications in gene therapy and in physiological, pharmacological, and developmental studies.
Figures


Similar articles
-
Long-term, high level in vivo gene expression after electric pulse-mediated gene transfer into skeletal muscle.C R Acad Sci III. 1998 Nov;321(11):893-9. doi: 10.1016/s0764-4469(99)80003-1. C R Acad Sci III. 1998. PMID: 9879468
-
Delivery of electric pulses for DNA electrotransfer to mouse muscle does not induce the expression of stress related genes.Cell Biol Toxicol. 2004 Feb;20(1):25-31. doi: 10.1023/b:cbto.0000021079.69089.4f. Cell Biol Toxicol. 2004. PMID: 15119845
-
Importance of association between permeabilization and electrophoretic forces for intramuscular DNA electrotransfer.Biochim Biophys Acta. 2000 May 1;1474(3):353-9. doi: 10.1016/s0304-4165(00)00028-3. Biochim Biophys Acta. 2000. PMID: 10779687
-
Basic principles and clinical advancements of muscle electrotransfer.Curr Gene Ther. 2010 Apr;10(2):128-38. doi: 10.2174/156652310791110994. Curr Gene Ther. 2010. PMID: 20222860 Review.
-
A Critical Review of Electroporation as A Plasmid Delivery System in Mouse Skeletal Muscle.Int J Mol Sci. 2019 Jun 6;20(11):2776. doi: 10.3390/ijms20112776. Int J Mol Sci. 2019. PMID: 31174257 Free PMC article. Review.
Cited by
-
Effects of APC De-targeting and GAr modification on the duration of luciferase expression from plasmid DNA delivered to skeletal muscle.Curr Gene Ther. 2015;15(1):3-14. doi: 10.2174/1566523214666141114204943. Curr Gene Ther. 2015. PMID: 25545919 Free PMC article.
-
In vivo muscle electroporation threshold determination: realistic numerical models and in vivo experiments.J Membr Biol. 2012 Sep;245(9):509-20. doi: 10.1007/s00232-012-9432-8. Epub 2012 May 24. J Membr Biol. 2012. PMID: 22622286
-
In vivo expressed biologics for infectious disease prophylaxis: rapid delivery of DNA-based antiviral antibodies.Emerg Microbes Infect. 2020 Dec;9(1):1523-1533. doi: 10.1080/22221751.2020.1787108. Emerg Microbes Infect. 2020. PMID: 32579067 Free PMC article.
-
Wound healing enhancement: electroporation to address a classic problem of military medicine.World J Surg. 2005;29 Suppl 1:S55-9. doi: 10.1007/s00268-004-2062-2. World J Surg. 2005. PMID: 15815830 Review.
-
Therapeutic restoration of dystrophin expression in Duchenne muscular dystrophy.J Muscle Res Cell Motil. 2006;27(5-7):387-98. doi: 10.1007/s10974-006-9081-6. Epub 2006 Jul 28. J Muscle Res Cell Motil. 2006. PMID: 16874449 Review.
References
-
- Ledley F D. Hum Gene Ther. 1995;6:1129–1144. - PubMed
-
- Lee R J, Huang L. Crit Rev Ther Drug Carrier Syst. 1997;14:173–206. - PubMed
-
- Smith J, Zhang Y, Niven R. Adv Drug Delivery Rev. 1997;26:135–150. - PubMed
-
- Ragot T, Vincent N, Chafey P, Vigne E, Gilgenkrantz H, Couton D, Cartaud J, Briand P, Kaplan J C, Perricaudet M. Nature (London) 1993;361:647–650. - PubMed
-
- Montgomery D L, Ulmer J B, Donnelly J J, Liu M A. Pharmacol Ther. 1997;74:195–205. - PubMed
Publication types
MeSH terms
Substances
LinkOut - more resources
Full Text Sources
Other Literature Sources

