Energetic and spatial parameters for gating of the bacterial large conductance mechanosensitive channel, MscL
- PMID: 10102934
- PMCID: PMC2217166
- DOI: 10.1085/jgp.113.4.525
Energetic and spatial parameters for gating of the bacterial large conductance mechanosensitive channel, MscL
Abstract
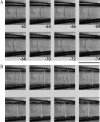
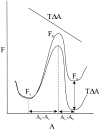
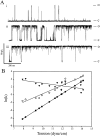
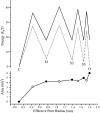
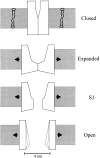
MscL is multimeric protein that forms a large conductance mechanosensitive channel in the inner membrane of Escherichia coli. Since MscL is gated by tension transmitted through the lipid bilayer, we have been able to measure its gating parameters as a function of absolute tension. Using purified MscL reconstituted in liposomes, we recorded single channel currents and varied the pressure gradient (P) to vary the tension (T). The tension was calculated from P and the radius of curvature was obtained using video microscopy of the patch. The probability of being open (Po) has a steep sigmoidal dependence on T, with a midpoint (T1/2) of 11.8 dyn/cm. The maximal slope sensitivity of Po/Pc was 0.63 dyn/cm per e-fold. Assuming a Boltzmann distribution, the energy difference between the closed and fully open states in the unstressed membrane was DeltaE = 18.6 kBT. If the mechanosensitivity arises from tension acting on a change of in-plane area (DeltaA), the free energy, TDeltaA, would correspond to DeltaA = 6.5 nm2. MscL is not a binary channel, but has four conducting states and a closed state. Most transition rates are independent of tension, but the rate-limiting step to opening is the transition between the closed state and the lowest conductance substate. This transition thus involves the greatest DeltaA. When summed over all transitions, the in-plane area change from closed to fully open was 6 nm2, agreeing with the value obtained in the two-state analysis. Assuming a cylindrical channel, the dimensions of the (fully open) pore were comparable to DeltaA. Thus, the tension dependence of channel gating is primarily one of increasing the external channel area to accommodate the pore of the smallest conducting state. The higher conducting states appear to involve conformational changes internal to the channel that don't involve changes in area.
Figures







Similar articles
-
Gating of the large mechanosensitive channel in situ: estimation of the spatial scale of the transition from channel population responses.Biophys J. 2004 May;86(5):2846-61. doi: 10.1016/S0006-3495(04)74337-4. Biophys J. 2004. PMID: 15111402 Free PMC article.
-
Mechanosensitive channels in bacteria as membrane tension reporters.FASEB J. 1999;13 Suppl:S55-61. doi: 10.1096/fasebj.13.9001.s55. FASEB J. 1999. PMID: 10352145 Review.
-
Purification of the small mechanosensitive channel of Escherichia coli (MscS): the subunit structure, conduction, and gating characteristics in liposomes.Biophys J. 2002 Jul;83(1):290-8. doi: 10.1016/S0006-3495(02)75169-2. Biophys J. 2002. PMID: 12080120 Free PMC article.
-
The gating mechanism of the bacterial mechanosensitive channel MscL revealed by molecular dynamics simulations: from tension sensing to channel opening.Channels (Austin). 2012 Jul-Aug;6(4):317-31. doi: 10.4161/chan.21895. Channels (Austin). 2012. PMID: 23146938 Free PMC article.
-
Mechanosensitive channels of Escherichia coli: the MscL gene, protein, and activities.Annu Rev Physiol. 1997;59:633-57. doi: 10.1146/annurev.physiol.59.1.633. Annu Rev Physiol. 1997. PMID: 9074781 Review.
Cited by
-
Photolipid excitation triggers depolarizing optocapacitive currents and action potentials.Nat Commun. 2024 Feb 7;15(1):1139. doi: 10.1038/s41467-024-45403-y. Nat Commun. 2024. PMID: 38326372 Free PMC article.
-
Xerocytosis is caused by mutations that alter the kinetics of the mechanosensitive channel PIEZO1.Proc Natl Acad Sci U S A. 2013 Mar 19;110(12):E1162-8. doi: 10.1073/pnas.1219777110. Epub 2013 Mar 4. Proc Natl Acad Sci U S A. 2013. PMID: 23487776 Free PMC article.
-
Activation of a bacterial mechanosensitive channel in mammalian cells by cytoskeletal stress.Cell Mol Bioeng. 2014 Sep;7(3):307-319. doi: 10.1007/s12195-014-0337-8. Cell Mol Bioeng. 2014. PMID: 25606062 Free PMC article.
-
A finite element framework for studying the mechanical response of macromolecules: application to the gating of the mechanosensitive channel MscL.Biophys J. 2006 Aug 15;91(4):1248-63. doi: 10.1529/biophysj.106.085985. Epub 2006 May 26. Biophys J. 2006. PMID: 16731564 Free PMC article.
-
Simulation of MscL gating in a bilayer under stress.Biophys J. 2003 Apr;84(4):2331-7. doi: 10.1016/S0006-3495(03)75038-3. Biophys J. 2003. PMID: 12668441 Free PMC article.
References
-
- Akinlaja, J. 1997. Electromechanical rupture of cell-attached patches. Physics. Thesis/Dissertation. SUNY at Buffalo, Buffalo, NY. 1–56.
-
- Arkin IT, Sukharev S, Blount P, Kung C, Brunger AT. Helicity, membrane incorporation, orientation and thermal stability of the large conductance mechano-sensitive ion channel from E. coli. . Biochim Biophys Acta. 1998;1369:131–140. - PubMed
-
- Awayda MS, Ismailov II, Berdiev BK, Benos DJ. A cloned renal epithelial Na+channel protein displays stretch activation in planar lipid bilayers. Am J Physiol. 1995;268:C1450–C1459. - PubMed
-
- Berrier C, Besnard M, Ajouz B, Coulombe A, Ghazi A. Multiple mechanosensitive ion channels from Escherichia coli,activated at different thresholds of applied pressure. J Membr Biol. 1996;151:175–187. - PubMed
-
- Bloom M, Evans E, Mouritsen OG. Physical properties of the fluid lipid-bilayer component of cell membranes: a perspective. Q Rev Biophys. 1991;24:293–397. - PubMed
Publication types
MeSH terms
Substances
LinkOut - more resources
Full Text Sources
Molecular Biology Databases

