. 1999 Feb;154(2):567-80.
doi: 10.1016/S0002-9440(10)65302-3.

Insulin-like growth factor-1 induces Mdm2 and down-regulates p53, attenuating the myocyte renin-angiotensin system and stretch-mediated apoptosis

Affiliations

Insulin-like growth factor-1 induces Mdm2 and down-regulates p53, attenuating the myocyte renin-angiotensin system and stretch-mediated apoptosis

A Leri et al. Am J Pathol. 1999 Feb.

Abstract

Insulin-like growth factor (IGF)-1 inhibits apoptosis, but its mechanism is unknown. Myocyte stretching activates p53 and p53-dependent genes, leading to the formation of angiotensin II (Ang II) and apoptosis. Therefore, this in vitro system was used to determine whether IGF-1 interfered with p53 function and the local renin-angiotensin system (RAS), decreasing stretch-induced cell death. A single dose of 200 ng/ml IGF-1 at the time of stretching decreased myocyte apoptosis 43% and 61% at 6 and 20 hours. Ang II concentration was reduced 52% at 20 hours. Additionally, p53 DNA binding to angiotensinogen (Aogen), AT1 receptor, and Bax was markedly down-regulated by IGF-1 via the induction of Mdm2 and the formation of Mdm2-p53 complexes. Concurrently, the quantity of p53, Aogen, renin, AT1 receptor, and Bax was reduced in stretched myocytes exposed to IGF-1. Conversely, Bcl-2 and the Bcl-2-to-Bax protein ratio increased. The effects of IGF-1 on cell death, Ang II synthesis, and Bax protein were the consequence of Mdm2-induced down-regulation of p53 function. In conclusion, the anti-apoptotic impact of IGF-1 on stretched myocytes was mediated by its capacity to depress p53 transcriptional activity, which limited Ang II formation and attenuated the susceptibility of myocytes to trigger their endogenous cell death pathway.


Figures

Figure 1.
Figure 1.
Effects of different doses of IGF-1 on stretch-mediated apoptosis at 20 hours. Results are presented as means ± SD. *P < 0.05, difference from stretched myocytes not exposed to IGF-1; n = 5 in each condition.
Figure 2.
Figure 2.
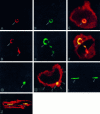
Four examples of apoptosis in mononucleated and binucleated myocytes after stretch at 6 (A to F) and 20 (G to J) hours. A to C: Mononucleated myocyte with chromatin margination and initial fragmentation, depicted by the red fluorescence of propidium iodide staining (A, arrow) and TdT labeling (B, arrow). The combination of these two stainings of the nucleus (arrow) with the red fluorescence of α-sarcomeric actin antibody labeling is shown in C. A horseshoe image of one nucleus (arrow) and fragmentation of the other (arrowhead) are illustrated by the same procedure in a binucleated myocyte (D to F). G and H: TdT labeling of a nucleus shown by green fluorescence (G, arrow) and the combination of TdT and propidium iodide staining of the same nucleus by yellow fluorescence (H, arrow). This latter image is associated with α-sarcomeric actin antibody labeling of the peripheral region of the myocyte, which exhibits loss of myofibrils in a large portion of the cytoplasm and blebbing of the sarcolemma (H, arrowhead)s. I and J: TdT labeling of two nuclei shown by green fluorescence (I, arrows) and the combination of TdT and propidium iodide staining of the same nuclei by yellow fluorescence (J, arrows). This latter image is associated with α-sarcomeric actin antibody labeling of portion of the cell mostly in the area adjacent to the sarcolemma. Note that TdT labeling of one of the two nuclei involves most of the chromatin but not the entire structure (arrowhead). Magnification, ×1500 (A to F) and ×1000 (G to J).
Figure 3.
Figure 3.
Effects of 200 ng/ml IGF-1 on stretch-mediated apoptosis at 6 and 20 hours after the imposition of the mechanical stimulus. *P < 0.05, difference from nonstretched myocytes (NS) and nonstretched myocytes exposed to IGF-1 (NS+IGF-1); P < 0.05, difference from stretched myocytes (S). S+IGF-1, stretched myocytes in the presence of IGF-1.
Figure 4.
Figure 4.
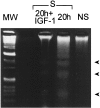
DNA gel electrophoresis of myocytes exposed to stretch for 20 hours in the presence of 200 ng/ml IGF-1 (S+IGF-1) or in the absence of the growth factor (S). DNA laddering is noted in stretched cells but is more apparent in the absence of IGF-1. MW, molecular weight markers; arrowheads indicate multiples of 200 bp.
Figure 5.
Figure 5.
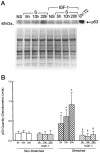
A: Effects of IGF-1 on the quantity of p53 protein measured by Western blot (top) in nonstretched myocytes at 20 hours (NS) and stretched myocytes (S) at 5, 10, and 20 hours (h). IGF-1 markedly attenuated the amount of p53 in stretched cells at all time points. SV-T2 was used as positive control. Loading of proteins is illustrated by Coomassie blue staining (bottom). B: Densitometric analysis of p53 protein in myocytes. Data are presented as means ± SD. *P < 0.05, difference from nonstretched myocytes and nonstretched myocytes exposed to IGF-1; P < 0.05, difference from stretched myocytes in the absence of the growth factor; n = 5 in each determination.
Figure 6.
Figure 6.
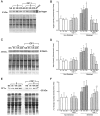
A: Effects of IGF-1 on the quantity of Bax protein measured by Western blot (top) in nonstretched (NS) and stretched (S) myocytes at 1, 5, 10, and 20 hours (h). IGF-1 markedly attenuated the amount of Bax in stretched cells at all time points. Loading of proteins is illustrated by Coomassie blue staining (bottom). B: Densitometric analysis of Bax protein in myocytes. Data are presented as means ± SD. *P < 0.05, difference from nonstretched myocytes and nonstretched myocytes exposed to IGF-1; P < 0.05, difference from stretched myocytes in the absence of the growth factor; n = 5 in each determination. C: Effects of IGF-1 on the quantity of Bcl-2 protein measured by Western blot (top) in nonstretched myocytes at 20 hours (NS) and stretched myocytes (S) at 5, 10, and 20 hours (h). IGF-1 significantly increased the amount of Bcl-2 in stretched cells at the time points examined. Loading of proteins is illustrated by Coomassie blue staining (bottom). D: Densitometric analysis of Bcl-2 protein in myocytes. Data are presented as means ± SD. *P < 0.05, difference from nonstretched myocytes and nonstretched myocytes exposed to IGF-1; P < 0.05, difference from stretched myocytes in the absence of the growth factor. n = 5 in each determination.
Figure 7.
Figure 7.
A: Effects of IGF-1 on the quantity of Aogen protein measured by Western blot (top) in nonstretched myocytes at 20 hours (NS) and stretched myocytes (S) at 5, 10, and 20 hours (h). IGF-1 markedly attenuated the amount of Aogen in stretched cells at all time points. Serum was used as positive control. Loading of proteins is illustrated by Coomassie blue staining (bottom). B: Densitometric analysis of Aogen protein in myocytes. Data are presented as means ± SD. *P < 0.05, difference from nonstretched myocytes and nonstretched myocytes exposed to IGF-1; P < 0.05, difference from stretched myocytes in the absence of the growth factor; n = 5 in each determination. C: Effects of IGF-1 on the quantity of renin protein measured by Western blot (top) in nonstretched myocytes at 20 hours (NS) and stretched myocytes (S) at 5, 10, and 20 hours (h). IGF-1 significantly decreased the amount of renin in stretched cells at 10 and 20 hours. Loading of proteins is illustrated by Coomassie blue staining (bottom). D: Densitometric analysis of renin protein in myocytes. Data are presented as means ± SD. *P < 0.05, difference from nonstretched myocytes and nonstretched myocytes exposed to IGF-1; P < 0.05, difference from stretched myocytes in the absence of the growth factor; n = 5 in each determination. E: Effects of IGF-1 on the quantity of AT1 protein measured by Western blot (top) in nonstretched myocytes at 20 hours (NS) and stretched myocytes (S) at 5, 10, and 20 hours (h). IGF-1 attenuated the amount of AT1 in stretched cells at the three time points examined. Loading of proteins is illustrated by Coomassie blue staining (bottom). F: Densitometric analysis of AT1 protein in myocytes. Data are presented as means ± SD. *P < 0.05, difference from nonstretched myocytes and nonstretched myocytes exposed to IGF-1; P < 0.05, from stretched myocytes in the absence of the growth factor; n = 5 in each determination.
Figure 8.
Figure 8.
Effects of IGF-1 on the quantity of Ang II in the medium of stretched myocytes. Data are presented as means ± SD. *P < 0.05, difference from nonstretched myocytes and nonstretched myocytes exposed to IGF-1; P < 0.05, difference from stretched myocytes in the absence of the growth factor; n = 5 in each determination.
Figure 9.
Figure 9.
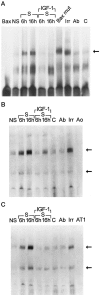
A: Gel mobility assay illustrating p53 binding to its consensus sequence in the bax promoter. Nuclear extracts were obtained from nonstretched myocytes (NS) at 16 hours and stretched myocytes (S) at 6 and 16 hours (h) in the absence and presence of IGF-1. IGF-1 decreased p53 DNA binding activity at both time points. The arrow indicates the position of p53 shifted band. The p53-specific band, corresponding to nuclear extract obtained at 16 hours after stretch, was subject to competition with an excess of unlabeled self oligonucleotide (C) and with a monoclonal p53 antibody (Ab). The addition of an irrelevant antibody (Irr) or preincubation with an unlabeled mutated form of bax (Bax mut) did not interfere with p53 binding. Bax, bax probe in the absence of nuclear extracts. Optical density data were as follows: NS = 0.46 ± 0.22 (n = 5), S-6 hours = 1.83 ± 0.37 (n = 5), P < 0.002; S-16 hours = 2.94 ± 0.74 (n = 5), versus NS P < 0.001, versus S-6 hours P < 0.02; NS+IGF-1 = 0.41 ± 0.18 (n = 5), S-6 hours+IGF-1 = 0.80 ± 0.27 (n = 5), versus NS+IGF-1 not significant, versus S-6 hours P < 0.02; S-16 hours+IGF-1 = 0.79 ± 0.37 (n = 5), versus NS+IGF-1 not significant, versus S-16 hours P < 0.001. B: Gel mobility assay illustrating p53 binding to its consensus sequence in the Aogen promoter. Nuclear extracts were obtained from nonstretched myocytes (NS) at 16 hours and stretched myocytes (S) at 6 and 16 hours (h) in the absence and presence of IGF-1. IGF-1 decreased p53 DNA binding activity at both time points. Arrows indicate the position of p53 shifted bands. p53-specific bands, corresponding to nuclear extract obtained at 16 hours after stretch, were subject to competition with an excess of unlabeled self oligonucleotide (C) and with a monoclonal p53 antibody (Ab). The addition of an irrelevant antibody (Irr) did not interfere with p53 binding. Ao, Aogen probe in the absence of nuclear extracts. Optical density data of the two bands combined were as follows: NS = 0.76 ± 0.25 (n = 5), S-6 hours = 1.59 ± 0.27 (n = 5), P < 0.001; S-16 hours = 2.38 ± 0.25 (n = 5), versus NS P < 0.001, versus S-6 hours P < 0.001; NS+IGF-1 = 0.65 ± 0.15 (n = 5), S-6 hours+IGF-1 = 0.68 ± 0.18 (n = 5), versus NS+IGF-1 not significant, versus S-6 hours P < 0.001; S-16 hours+IGF-1 = 1.15 ± 0.16 (n = 5), versus NS+IGF-1 P < 0.05, versus S-16 hours P < 0.001. C: Gel mobility assay illustrating p53 binding to its consensus sequence in the AT1 promoter. Nuclear extracts were obtained from nonstretched myocytes (NS) at 16 hours and stretched myocytes (S) at 6 and 16 hours (h) in the absence and presence of IGF-1. IGF-1 decreased p53 DNA binding activity at both time points. Arrows indicate the position of p53 shifted bands. p53-specific bands, corresponding to nuclear extract obtained at 16 hours after stretch, were subject to competition with an excess of unlabeled self oligonucleotide (C) and with a monoclonal p53 antibody (Ab). The addition of an irrelevant antibody (Irr) did not interfere with p53 binding. AT1, AT1 probe in the absence of nuclear extracts. Optical density data of the two bands combined were as follows: NS = 0.41 ± 0.12 (n = 5), S-6 hours = 1.16 ± 0.26 (n = 5), P < 0.001; S-16 hours = 2.18 ± 0.29 (n = 5), versus NS P < 0.001, versus S-6 hours P < 0.001; NS+IGF-1 = 0.43 ± 0.19 (n = 5), S-6 hours+IGF-1 = 0.35 ± 0.06 (n = 5), versus NS+IGF-1 not significant, versus S-6 hours P < 0.001; S-16 hours+IGF-1 = 0.56 ± 0.11 (n = 5), versus NS+IGF-1 not significant, versus S-16 hours P < 0.001.
Figure 10.
Figure 10.
Effects of stretch and IGF-1 on the quantity of the various forms of Mdm2 and p53 measured by Western blot analysis of myocyte lysates immunoprecipitated with Mdm2 antibody. Nonstretched: 90 kd; no IGF-1: not detectable, n = 5; IGF-1: not detectable, n = 5; 85 kd; no IGF-1: not detectable, n = 5; IGF-1: not detectable, n = 5; 76 kd; no IGF-1: OD = 0.04 ± 0.05, n = 5; IGF-1: OD = 2.9 ± 0.9, n = 5, P < 0.001; 57 to 58 kd; no IGF-1: OD = 2.1 ± 0.4, n = 5; IGF-1: OD = 2.4 ± 0.5, n = 5, NS; stretched myocytes for 5 hours: 90 kd; no IGF-1: not detectable, n = 5; IGF-1: OD = 6.5 ± 1.5, n = 5, P < 0.001; 85 kd; no IGF-1: not detectable, n = 5; IGF-1: OD = 1.5 ± 0.5, n = 5, P < 0.001; 76 kd; no IGF-1: OD = 2.7 ± 0.4, n = 5; IGF-1: OD = 6.6 ± 0.9, n = 5, P < 0.001; 57 to 58 kd; no IGF-1: OD = 0.9 ± 0.3, n = 5; IGF-1: OD = 13 ± 2.4, n = 5, P < 0.001; stretched myocytes for 16 hours: 90 kd; no IGF-1: not detectable, n = 5; IGF-1: OD = 5.2 ± 0.6, n = 5, P < 0.001; 85 kd; no IGF-1: not detectable, n = 5; IGF-1: OD = 1.3 ± 0.5, n = 5, P < 0.001; 76 kd; no IGF-1: OD = 8.6 ± 0.8, n = 5; IGF-1: OD = 9.4 ± 1.6, n = 5, NS; 57–58 kd; no IGF-1: OD = 9.2 ± 2.0, n = 5; IGF-1: OD = 14 ± 3, n = 5, P < 0.05. p53 in nonstretched myocytes: no IGF-1: not detectable, n = 5; IGF-1: not detectable, n = 5; stretched myocytes for 5 hours: no IGF-1: not detectable, n = 5; IGF-1: 10 ± 2, n = 5, P < 0.001; stretched myocytes for 16 hours: no IGF-1: OD = 0.02 ± 0.04, n = 5; IGF-1: OD = 9.8 ± 1.6, n = 5, P < 0.001.
Figure 11.
Figure 11.
Effects of stretch and IGF-1 on the quantity of the various forms of Mdm2 and p53 measured by Western blot analysis of myocyte lysates immunoprecipitated with p53 antibody. Nonstretched: 90 kd; no IGF-1: OD = 1.0 ± 0.4, n = 5; IGF-1: OD = 2.8 ± 0.4, n = 5, P < 0.001; 57 to 58 kd; no IGF-1: OD = 10 ± 3, n = 5; IGF-1: OD = 13 ± 4, n = 5, NS; stretched myocytes for 5 hours: 90 kd; no IGF-1: OD = 0.4 ± 0.2, n = 5; IGF-1: OD = 12 ± 3, n = 5, P < 0.001; 57 to 58 kd; no IGF-1: OD = 6.6 ± 1.4, n = 5; IGF-1: OD = 14 ± 4, n = 5, P < 0.005; stretched myocytes for 16 hours: 90 kd; no IGF-1: OD = 2.5 ± 0.5, n = 5; IGF-1: OD = 5.9 ± 1.6, n = 5, P < 0.001; 57 to 58 kd; no IGF-1: OD = 14 ± 3, n = 5; IGF-1: OD = 42 ± 6, n = 5, P < 0.001. Total p53 in nonstretched myocytes: no IGF-1: OD = 24 ± 5, n = 5; IGF-1: OD = 15 ± 3, n = 5, P < 0.001; stretched myocytes for 5 hours: no IGF-1: OD = 31 ± 5, n = 5; IGF-1: OD = 20 ± 4, n = 5, P < 0.001; stretched myocytes for 16 hours: no IGF-1: OD = 33 ± 6, n = 5; IGF-1: OD = 10 ± 4, n = 5, P < 0.001.

Similar articles

Cited by

References

    1. Rodriguez-Tarduchy G, Collins MKL, Garcia I, Lopez-Rivas A: Insulin-like growth factor 1 inhibits apoptosis in IL-3 dependent hemopoietic cells. J Immunol 1992, 149:535-540 - PubMed
    1. D’Mello SR, Galli C, Ciotti T, Calissano P: Induction of apoptosis in cerebellar granule neurons by low potassium: inhibition of death by insulin-like growth factor I and cAMP. Proc Natl Acad Sci USA 1993, 90:10989-10993 - PMC - PubMed
    1. Chun SY, Billig H, Tilly JL, Furuta I, Tsafriri A, Hsueh AJ: Gonadotropin suppression of apoptosis in cultured preovulatory follicles: mediatory role of endogenous insulin-like growth factor 1. Endocrinology 1994, 135:1845-1853 - PubMed
    1. Li Q, Li B, Wang X, Leri A, Jana KP, Liu Y, Kajstura J, Baserga R, Anversa P: Overexpression of insulin-like growth factor-1 in mice protects from myocyte death after infarction, attenuating ventricular dilation, wall stress, and cardiac hypertrophy. J Clin Invest 1997, 100:1991-1999 - PMC - PubMed
    1. Gluckman P, Klempt N, Guan J, Mallard C, Sirimanne E, Dragunow M, Klempt M, Singh K, Williams C, Nikolics K: A role for IGF-1 in the rescue of CNS neurons following hypoxic-ischemic injury. Biochem Biophys Res Commun 1992, 182:593-599 - PubMed

Publication types

MeSH terms