

Correlation between protein and mRNA abundance in yeast
- PMID: 10022859
- PMCID: PMC83965
- DOI: 10.1128/MCB.19.3.1720
Correlation between protein and mRNA abundance in yeast
Abstract
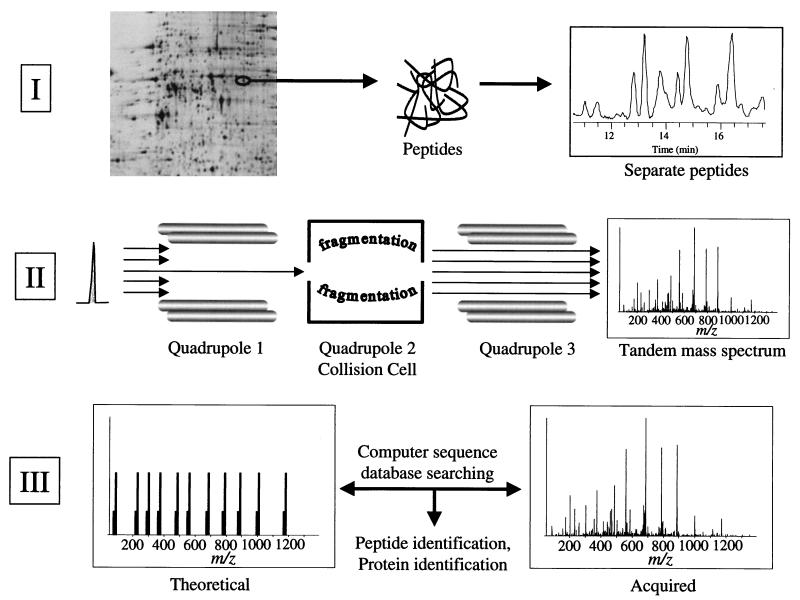
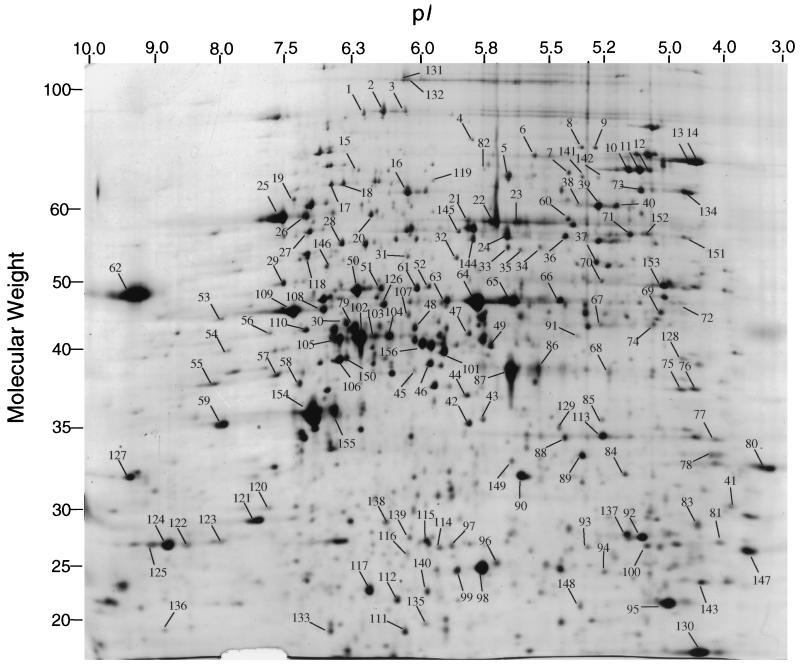
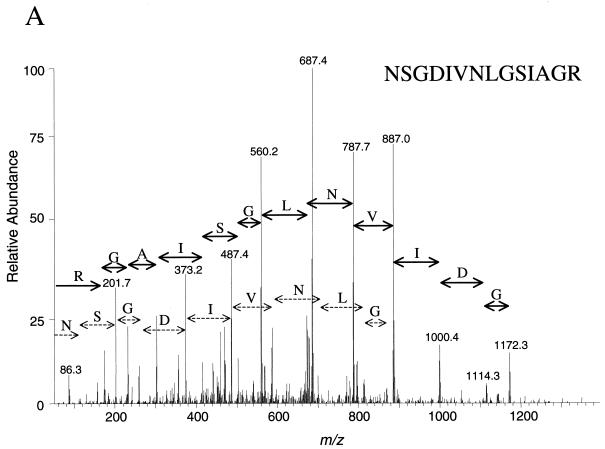
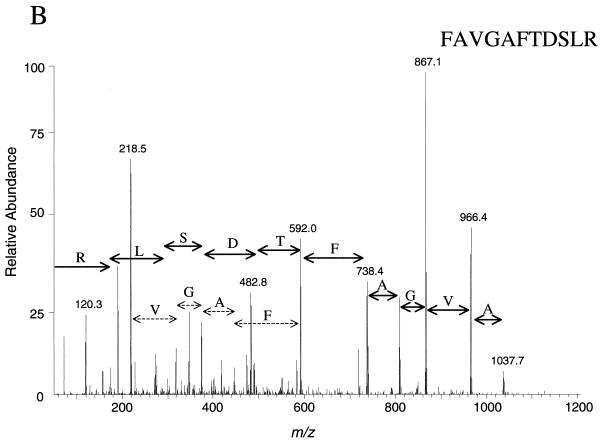
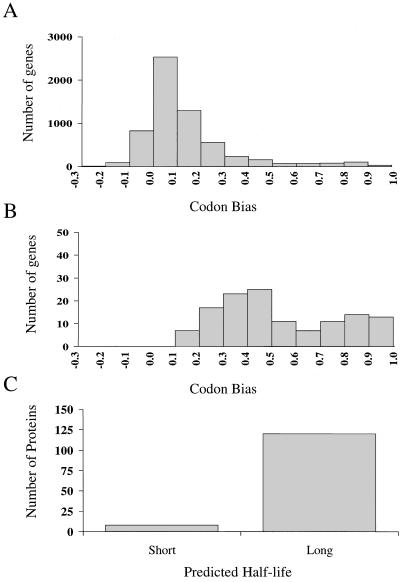
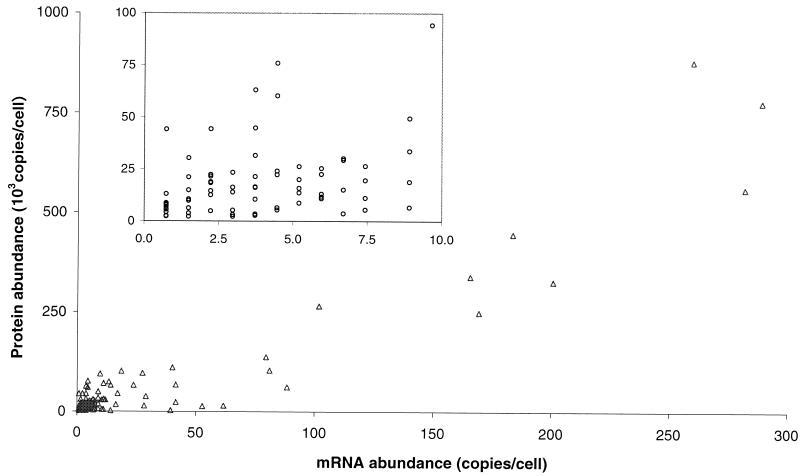
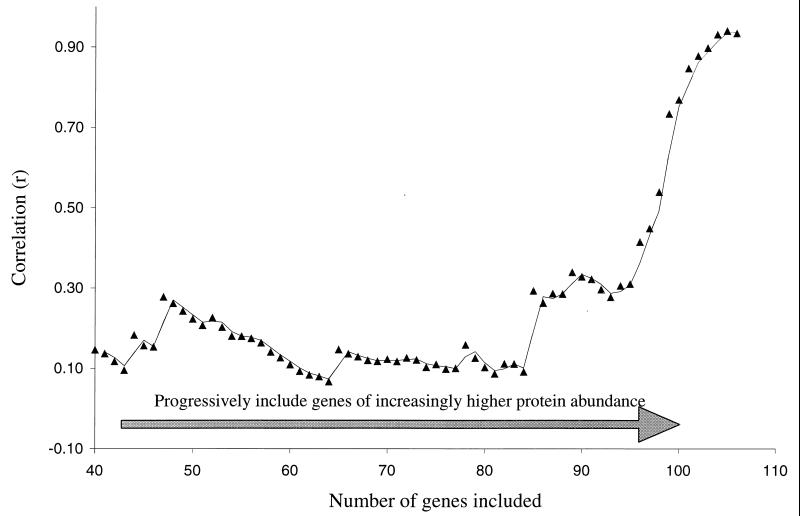
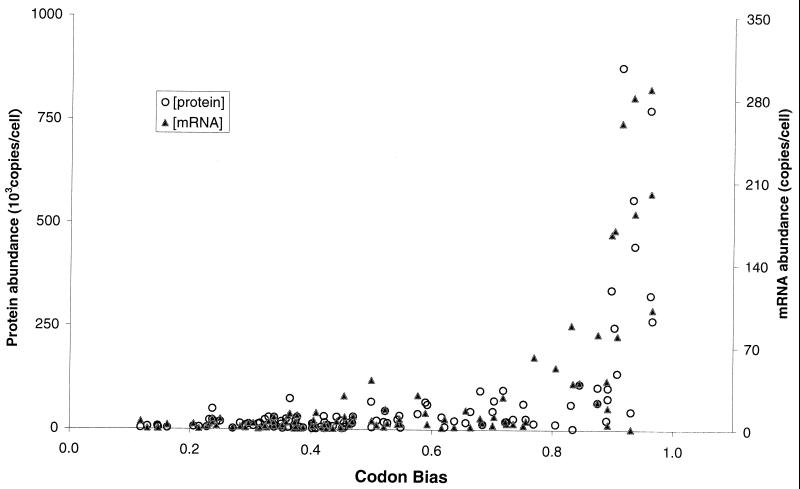
We have determined the relationship between mRNA and protein expression levels for selected genes expressed in the yeast Saccharomyces cerevisiae growing at mid-log phase. The proteins contained in total yeast cell lysate were separated by high-resolution two-dimensional (2D) gel electrophoresis. Over 150 protein spots were excised and identified by capillary liquid chromatography-tandem mass spectrometry (LC-MS/MS). Protein spots were quantified by metabolic labeling and scintillation counting. Corresponding mRNA levels were calculated from serial analysis of gene expression (SAGE) frequency tables (V. E. Velculescu, L. Zhang, W. Zhou, J. Vogelstein, M. A. Basrai, D. E. Bassett, Jr., P. Hieter, B. Vogelstein, and K. W. Kinzler, Cell 88:243-251, 1997). We found that the correlation between mRNA and protein levels was insufficient to predict protein expression levels from quantitative mRNA data. Indeed, for some genes, while the mRNA levels were of the same value the protein levels varied by more than 20-fold. Conversely, invariant steady-state levels of certain proteins were observed with respective mRNA transcript levels that varied by as much as 30-fold. Another interesting observation is that codon bias is not a predictor of either protein or mRNA levels. Our results clearly delineate the technical boundaries of current approaches for quantitative analysis of protein expression and reveal that simple deduction from mRNA transcript analysis is insufficient.
Figures
Similar articles
-
A sampling of the yeast proteome.Mol Cell Biol. 1999 Nov;19(11):7357-68. doi: 10.1128/MCB.19.11.7357. Mol Cell Biol. 1999. PMID: 10523624 Free PMC article.
-
Premature 3'-end formation of CBP1 mRNA results in the downregulation of cytochrome b mRNA during the induction of respiration in Saccharomyces cerevisiae.Mol Cell Biol. 1997 Aug;17(8):4199-207. doi: 10.1128/MCB.17.8.4199. Mol Cell Biol. 1997. PMID: 9234677 Free PMC article.
-
Protein expression during lag phase and growth initiation in Saccharomyces cerevisiae.Int J Food Microbiol. 2002 May 5;75(1-2):27-38. doi: 10.1016/s0168-1605(01)00726-7. Int J Food Microbiol. 2002. PMID: 11999115
-
Towards a truly integrative biology through the functional genomics of yeast.Curr Opin Biotechnol. 2001 Feb;12(1):87-91. doi: 10.1016/s0958-1669(00)00179-8. Curr Opin Biotechnol. 2001. PMID: 11167079 Review.
-
mRNA abundance and half-life measurements.Methods Mol Biol. 1996;53:277-95. doi: 10.1385/0-89603-319-8:277. Methods Mol Biol. 1996. PMID: 8924989 Review. No abstract available.
Cited by
-
The Translatome Map: RNC-Seq vs. Ribo-Seq for Profiling of HBE, A549, and MCF-7 Cell Lines.Int J Mol Sci. 2024 Oct 12;25(20):10970. doi: 10.3390/ijms252010970. Int J Mol Sci. 2024. PMID: 39456753 Free PMC article.
-
Wheat Line "RYNO3936" Is Associated With Delayed Water Stress-Induced Leaf Senescence and Rapid Water-Deficit Stress Recovery.Front Plant Sci. 2020 Jul 14;11:1053. doi: 10.3389/fpls.2020.01053. eCollection 2020. Front Plant Sci. 2020. PMID: 32760414 Free PMC article.
-
Can phenotypic plasticity in Rubisco performance contribute to photosynthetic acclimation?Photosynth Res. 2014 Feb;119(1-2):203-14. doi: 10.1007/s11120-013-9816-3. Epub 2013 Mar 31. Photosynth Res. 2014. PMID: 23543330 Review.
-
Plant Organellar Proteomics in Response to Dehydration: Turning Protein Repertoire into Insights.Front Plant Sci. 2016 Apr 13;7:460. doi: 10.3389/fpls.2016.00460. eCollection 2016. Front Plant Sci. 2016. PMID: 27148291 Free PMC article. Review.
-
Proteotranscriptomic Profiling of 231-BR Breast Cancer Cells: Identification of Potential Biomarkers and Therapeutic Targets for Brain Metastasis.Mol Cell Proteomics. 2015 Sep;14(9):2316-30. doi: 10.1074/mcp.M114.046110. Epub 2015 Jun 3. Mol Cell Proteomics. 2015. PMID: 26041846 Free PMC article.
References
-
- Aebersold R H, Teplow D B, Hood L E, Kent S B. Electroblotting onto activated glass. High efficiency preparation of proteins from analytical sodium dodecyl sulfate-polyacrylamide gels for direct sequence analysis. Eur J Biochem. 1986;261:4229–4238. - PubMed
-
- Bennetzen J L, Hall B D. Codon selection in yeast. J Biol Chem. 1982;257:3026–3031. - PubMed
-
- Boucherie H, Dujardin G, Kermorgant M, Monribot C, Slonimski P, Perrot M. Two-dimensional protein map of Saccharomyces cerevisiae: construction of a gene-protein index. Yeast. 1995;11:601–613. - PubMed
-
- Boucherie H, Sagliocco F, Joubert R, Maillet I, Labarre J, Perrot M. Two-dimensional gel protein database of Saccharomyces cerevisiae. Electrophoresis. 1996;17:1683–1699. - PubMed
Publication types
MeSH terms
Substances
Grants and funding
LinkOut - more resources
Full Text Sources
Other Literature Sources
Molecular Biology Databases