

Significance
Many noncoding mutations in melanoma are found at the binding sites of E26 transformation-specific (ETS) transcription factors, but the molecular mechanism for the mutation formation and the functional impacts of these mutation hotspots remain elusive. Here, we used genome-wide data to show that mutation hotspots at ETS binding sites are correlated with high UV (Ultraviolet) damage formation and low DNA repair rate, but not fast CPD (cyclobutane pyrimidine dimer) deamination. Interestingly, ETS proteins significantly suppress CPD deamination by affecting water distribution around the binding motif. We further show that mutations in the ETS motif in some of the most frequently mutated promoters significantly perturb gene transcription.
Keywords: CPD-seq 2.0, NER, ETS, mutagenesis
Abstract
Noncoding mutation hotspots have been identified in melanoma and many of them occur at the binding sites of E26 transformation-specific (ETS) proteins; however, their formation mechanism and functional impacts are not fully understood. Here, we used UV (Ultraviolet) damage sequencing data and analyzed cyclobutane pyrimidine dimer (CPD) formation, DNA repair, and CPD deamination in human cells at single-nucleotide resolution. Our data show prominent CPD hotspots immediately after UV irradiation at ETS binding sites, particularly at sites with a conserved TTCCGG motif, which correlate with mutation hotspots identified in cutaneous melanoma. Additionally, CPDs are repaired slower at ETS binding sites than in flanking DNA. Cytosine deamination in CPDs to uracil is suggested as an important step for UV mutagenesis. However, we found that CPD deamination is significantly suppressed at ETS binding sites, particularly for the CPD hotspot on the 5′ side of the ETS motif, arguing against a role for CPD deamination in promoting ETS-associated UV mutations. Finally, we analyzed a subset of frequently mutated promoters, including the ribosomal protein genes RPL13A and RPS20, and found that mutations in the ETS motif can significantly reduce the promoter activity. Thus, our data identify high UV damage and low repair, but not CPD deamination, as the main mechanism for ETS-associated mutations in melanoma and uncover important roles of often-overlooked mutation hotspots in perturbing gene transcription.
Whole genome sequencing of melanoma and non-melanoma skin cancers has identified somatic mutation “hotspots”, which occur at the same nucleotide across independent tumors. Some hotspots are found in coding regions of cancer-relevant genes, such as BRAF, CDKN2A, NRAS, and TP53 (1), and are known as driver mutations. More mutation hotspots are located in noncoding regions (e.g., promoters) (2), which do not change protein sequences, but may play a role in influencing gene transcription. Only a small number of noncoding mutations have been carefully characterized, such as oncogenic mutations in the promoter of the Telomerase Reverse Transcriptase (TERT) gene (3, 4). For other promoter mutation hotspots, their formation mechanisms and biological impacts are still poorly understood.
Analysis of melanoma genomes has identified a sharp increase in the mutation density upstream of the transcription start site (TSS) of active promoters (5), and many noncoding mutation hotspots are located in this region (6). Ultraviolet (UV) radiation–induced DNA damage, particularly cyclobutane pyrimidine dimer (CPD), is a major source of somatic mutations in melanoma and other skin cancers (7). The nucleotide excision repair (NER) pathway removes CPDs from DNA and plays a critical role in preventing mutagenesis upon UV exposure (8, 9). The high mutation density near the TSS could be caused by slow repair, as unrepaired CPDs will elevate error rates of the DNA polymerases. Indeed, a previous study has shown that repair of UV damage is reduced near the TSS and suggested that the repair inhibition is due to transcription pre-initiation complex (PIC) assembled in promoters (5). UV-induced mutations are also affected by the frequency of UV damage formation. Under the same repair rate, DNA regions with high UV damage formation are likely to accumulate more mutations (10). We previously developed a UV damage mapping method, CPD sequencing (CPD-seq) (11, 12). Using CPD-seq as well as targeted CPD-seq, it has been shown that the E26 transformation-specific (ETS) family transcription factors (TFs) strongly elevate CPD formation at their binding sites (13–15). Other sequence-specific TFs, such as CCCTC-binding factor (CTCF), have also been shown to enhance CPD formation when bound to DNA (16). Hence, high UV damage yield may also contribute to mutation elevation in gene promoters. However, the original version of CPD-seq requires a high UV dose (e.g., 100 J/m2 UV-C) that is beyond the UV survival limit (~10 J/m2) of human cells. This technical barrier has prevented us from further analyzing repair at ETS and other TF-binding sites in cells using CPD-seq data.
What other mechanisms may sensitize promoter DNA for mutation accumulation is currently unknown. The cytosine in a CPD lesion is unstable and can be deaminated (i.e., loss of the amino group) at a higher rate than in undamaged DNA (17). Deamination converts the cytosine to a uracil, which is mutagenic and can cause C>T transition during DNA replication. Previous studies have shown that the CPD deamination rate is modulated by protein–DNA interactions, for example, in nucleosomes (18). Hence, it is theoretically possible that certain human TFs may affect the rate of CPD deamination to influence UV mutations. However, this hypothesis has not been tested with experimental evidence.
Analysis of the TERT mutations has revealed a gain-of-function phenotype, in which the mutation creates a new ETS binding site to activate TERT expression (4). Activation of TERT increases the amount of telomerase protein to maintain telomere length and enhance cancer cell immortality. Promoter mutations in other genes, particularly genes encoding ribosomal proteins such as RPL13A, RPS20, RPL18A, etc., occur as frequently as in TERT in melanoma (2, 6); however, the functional impacts of these mutation sites have not been characterized. It is worth noting that genetic screening in mice has identified defective ribosomal biogenesis as a key mechanism for the onset of UV-induced melanoma (19). Hence, it is important to functionally characterize promoter mutation hotspots in human ribosomal genes to gain insights into their potential roles in affecting human melanomas.
In this study, we used an improved CPD-seq (CPD-seq 2.0) and mapped UV damage formation and repair and correlated CPDs with promoter mutations identified in melanoma. We also examined CPD deamination as a potential mechanism for promoter mutations. Finally, we comprehensively characterized functions of individual mutation hotspots in affecting promoter activities using a reporter gene system. These data provide insights into the formation mechanism and functions of noncoding mutations in melanoma.
Results
Promoter Mutation Hotspots Are Prevalently Associated with ETS Binding Sites in Cutaneous Melanoma.
The published data have shown enriched melanoma mutations near the TSS in gene promoters (5). To further understand what cellular mechanisms stimulate promoter mutations, we analyzed a larger melanoma mutation dataset sequenced by the International Cancer Genome Consortium (ICGC). The ICGC dataset includes ~21 million somatic mutations in the whole genome of 183 donors consisting of 140 cutaneous (e.g., UV exposed) and 43 non-cutaneous melanomas such as acral, mucosal, and ocular subtypes (e.g., non-UV exposed) (1).
Analysis of the average mutation density (i.e., number of mutations per tumor per gene) along all transcribed genes (n = 20,084) revealed a prominent mutation peak adjacent to the TSS (i.e., from −200 bp to +100 bp relative to the TSS) in cutaneous tumors (Fig. 1A). Mutation density at the peak is about threefold as high as in the flanking DNA, similar to the published analysis using a smaller melanoma cohort (4.1 million mutations from 36 tumors) (5). Mutation spectra analysis of the peak indicates that >90% of mutations are C>T single or CC>TT double base substitutions (Fig. 1B), consistent with the known UV mutation signature, suggesting that mutations in the peak are mainly derived from UV damage.
Fig. 1.

Mutation analysis in gene promoters. (A) Average density of somatic mutations of 140 cutaneous tumors along transcribed human genes. Genes were aligned by the TSS and presented in the transcriptional direction (e.g., promoter on the left and coding on the right side of the TSS). Mutation density was shown as the number of mutations per tumor per gene in 10-bp non-overlapping moving windows. (B) Mutation spectra in the mutation peak between −200 bp and +100 bp of the TSS. The pie chart shows the percentage of each type of mutation. (C) The top 10 most frequently mutated promoters in the tumor cohort. The left column indicates the number of tumors that have the specific mutation. The second left column indicates the genomic location of the mutation site. The next two columns present the linked gene and the sequence context of the mutation site. Ribosomal proteins gene names are shown in bold and the TTCCGG motif is shown in gray in the sequence context. (D) Left: the average mutation density in 968 TTCCGG genes. The expected mutation density was calculated based on the mutation probability of each trinucleotide. Right: the average mutation density in 9,864 non-TTCCGG genes. These genes have at least one UV mutation in the peak region in the cohort, but none of them is associated with the TTCCGG motif. (E) Comparison of mutation density in the peak region between TTCCGG and Non-TTCCGG genes. Each dot represents the average mutation density of 10 bp in the peak region. (F) ETS binding to the promoter of TTCCGG and Non-TTCCGG genes. The density of ETS ChIP-seq peaks (e.g., peak per gene) was plotted relative to the TSS in 10 bp moving windows.
Next, we focused on the peak to understand if mutations in the peak are associated with specific DNA sequences. To this end, we extracted 10-nt DNA sequences on each side of the mutation to form a 21-nt window, with the C>T (or CC>TT) mutation in the center. In this window, we found that >60% of frequent mutation sites (i.e., mutated in >=7 tumors; n = 115) are associated with a specific DNA sequence, TTCCGG, a well-known binding motif for ETS proteins (20). Many mutations are located within the motif or only 1 or 2 nt away from it, including eight out of the top 10 mutated sites (Fig. 1C). The most frequently mutated site was found in the promoter of the ribosomal protein gene RPL13A. This mutation occurred in 47 independent tumors (Fig. 1C), accounting for >33% of all cutaneous melanomas in the cohort, which is 2.5-fold as high as the TERT C250T mutation (Fig. 1C). Other ribosomal protein genes such as RPS20, RPL18A, RPS27, and RPS3A were also found among the top 10 most frequently mutated promoters (Fig. 1C). For the top 10 mutations, only two, TERT and RPS20, are not linked with TTCCGG, but they both occur in a TCCCGG sequence context (underline indicates mutation site) and the C>T transition creates a new TTCCGG motif. Such a new TTCCGG motif in the TERT promoter has been shown to recruit ETS proteins for gene activation (3); however, whether a similar “gain-of-function” mechanism applies to RPS20 or other genes has not been characterized. Taken together, analysis of the sequence context revealed that the most frequent mutation hotspots in the TSS-proximal peak are prevalently associated with the TTCCGG motif.
We further sorted through each gene and identified 968 genes with at least one TTCCGG-associated UV mutation (e.g., C>T or CC>TT) in the peak region and they are named “TTCCGG” genes. Meanwhile, 9,864 “non-TTCCGG” genes were found—these have one or more UV mutations in the peak, but none of them is associated with TTCCGG. The rest of the genes (n = 9,252) do not have any UV mutations in the peak region and thus are excluded from the subsequent analyses. We analyzed the average mutation density for the two gene groups (i.e., TTCCGG and non-TTCCGG). Genes in the TTCCGG group have a sharp mutation peak near the TSS, with the mutation density being elevated by ~15-fold compared to the flanking DNA (Fig. 1D). Excluding mutations occurring at TTCCGG and its immediate flanks reduced the peak height by ~60% (SI Appendix, Fig. S1A), indicating that the majority of mutations are contributed by this single motif. In comparison, the peak density of the non-TTCCGG genes is much lower (Fig. 1 D and E, P < 0.0005 from the paired t test). Additionally, the expected mutation density, which was calculated based on the DNA sequence composition and mutation probability of each trinucleotide (21), did not show such a high mutation peak for TTCCGG genes (Fig. 1D), suggesting that the peak is not simply due to DNA sequence bias.
As the TTCCGG motif is a known binding sequence for ETS TFs, the prevalent mutation hotspots in this motif suggest that binding of ETS proteins to TSS-proximal region may elevate mutations. To test this, we used ETS ChIP-seq data generated by ENCODE (21, 22) and compared ETS binding between TTCCGG and non-TTCCGG genes. Our analysis shows a sharp ETS binding peak slightly upstream of the TSS for TTCCGG genes (Fig. 1F), which overlaps with the mutation peak (SI Appendix, Fig. S1B). In contrast, much lower ETS binding was found in promoters of the non-TTCCGG genes (Fig. 1F). Hence, these analyses indicate that ETS protein binding likely stimulates mutation hotspots in TTCCGG gene promoters in cutaneous melanoma.
To analyze whether the TTCCGG motif is generally associated with high mutation density, we conducted a motif sequence search in the TSS region (−200 bp to +100 bp) of all genes, regardless of mutation. We identified a total of 3,946 promoters with a TTCCGG sequence near the TSS, which include the TTCCGG genes mentioned above and additional promoters. Even with the expanded TTCCGG group, a mutation peak was still obvious near the TSS compared to 16,138 promoters without a TTCCGG sequence (SI Appendix, Fig. S2 A and B).
We also analyzed mutations in the 43 non-cutaneous tumors. The analysis shows that the mutation density is significantly lower compared to cutaneous tumors when all genes are analyzed (SI Appendix, Fig. S3A). For the 968 TTCCGG genes, there is a barely detectable increase of mutation density in non-cutaneous tumors (SI Appendix, Fig. S3 B and C), suggesting that ETS binding mainly enhances UV-induced mutations.
CPD-seq 2.0 for Genome-Wide UV Damage Mapping in Human Cells.
Our previous CPD-seq analysis showed increased CPD formation at ETS binding sites (15). However, the original CPD-seq method used a high UV dose that is unfeasible for repair studies in human cells. To examine both damage formation and repair, we adapted the published genome-wide ligation of 3′-OH ends followed by the sequencing (GLOE-Seq) method (23) and developed CPD-seq 2.0. Compared to the original CPD-seq, we skipped sonication in the first step to reduce background DNA nicks, which can interfere with mapping of real damage sites and reduce CPD-seq specificity. Instead, genomic DNA was first incubated with terminal transferase and dideoxyATP (ddATP) to block free 3′ ends that may arise during genomic DNA preparation (24). Intact genomic DNA was then digested by T4 endonuclease V (CPD glycosylase) and AP endonuclease 1 (APE1) to generate a new 3′-OH group at the CPD lesion site (Fig. 2A, blue color). The damage-associated 3′ end was immediately ligated to a splint adaptor DNA to tag the CPD site (Fig. 2A, purple). The ligation product was sonicated and the top strand was purified with Streptavidin beads (the first adaptor was tagged with Biotin) and used as the template to synthesize double-stranded DNA. The 2nd adaptor (green) was ligated to the other side to generate a CPD-seq 2.0 library. After Illumina sequencing, CPD locations were identified by retrieving adjacent dinucleotides on the opposite strand upstream of the 5′ end of each Read1 (Fig. 2A), similar to the original CPD-seq protocol (11, 25).
Fig. 2.

CPD-seq 2.0 analysis of mCPD formation and repair. (A) The schematic of CPD-seq 2.0. The Top panel shows the experimental setup. The Lower panel details the steps for CPD-seq 2.0 library preparation. T = T indicates CPD damage; “OH” indicates a free 3′OH group; “dd” indicates dideoxy (3′H). (B) Counts of dinucleotides associated with each CPD-seq read. The two nucleotides immediately upstream of the 5′ end of Read 1 on the opposite strand were collected and counted. CPDs are expected to occur at dipyrimidines such as TT, TC, CC, and CT. mCPD: mutagenic CPD. (C) Average mCPD (reads per gene) in 968 TTCCGG genes in 20 bp moving windows. From Top to Bottom shows mCPDs at 0, 6, and 24 h, respectively. (D) Average mCPDs in 9,864 Non-TTCCGG genes for different time points. (E) Fraction of remaining mCPDs after 6 and 24 h repair normalized to the initial damage at 0 h for TTCCGG (Left) and Non-TTCCCGG genes (Right).
We used CPD-seq 2.0 and sequenced CPDs in human skin fibroblasts exposed to 6 and 8 J/m2 of UV-C, two doses significantly lower than the original CPD-seq dose (i.e., 100 J/m2) (15). For the 6 J/m2 treatment, we sequenced four samples, No UV (control), UV-0 h (UV irradiated, no repair), UV-6 h (UV irradiated, repaired for 6 h), and UV-24 h (UV irradiated, repaired for 24 h). A total of ~70 million mappable reads were collected in the UV-0-h sample and about 70% of the reads were associated with CPD-forming dinucleotides (e.g., highest yield at TT sites, followed by TC, CT, and CC) (Fig. 2B). This is in contrast to only 23% of reads mapped to CPD-forming dinucleotides in the “No UV” sample. Enrichment of CPD-forming dinucleotides was also found in cells exposed to 8 J/m2 UV light (SI Appendix, Fig. S4A). Furthermore, analysis of remaining CPDs after repair for 6 and 24 h (normalized by 0 h) revealed transcription-coupled NER (TC-NER) signature, shown by faster repair on the transcribed (TS) relative to the non-transcribed strand (NTS) in active genes, but not in inactive genes (SI Appendix, Fig. S4B). Therefore, these modifications significantly improved CPD-seq sensitivity to enable damage mapping at low UV doses in human cells.
Promoter Mutation Hotspots Are Associated with High Damage and Low Repair.
As mentioned earlier, we identified 968 genes with TTCCGG-associated mutations, and these genes are likely ETS-regulated genes. With the CPD-seq 2.0 data, we analyzed initial (i.e., 0 h) and remaining CPDs after 6- and 24-h repair around TSS of these genes. The majority of melanoma mutations are caused by cytosine-containing CPDs, but not from the most abundant thymine dimers (26). To better correlate UV damage with melanoma mutations, we excluded TT dimers and focused on C-containing mutagenic CPDs (i.e., mCPDs shown in Fig. 2B) formed between TC, CT, and CC dinucleotides.
Analysis of average mCPDs shows a damage peak in the UV-0 h sample upstream of the TSS in the 968 TTCCGG genes, but not in the 9,864 non-TTCCGG genes (Fig. 2C). Excluding mCPDs occurring at TTCCGG motif and its immediate flanks abolished this peak in the TTCCGG promoters (SI Appendix, Fig. S5A), indicating that the damage peak is dependent on the TTCCGG motif. CPD formation is affected by DNA sequences and the observed damage peak could be caused by DNA sequence bias. To test this, we performed CPD-seq 2.0 analysis in naked DNA (i.e., purified genomic DNA) treated by UV. Formation of mCPDs was slightly increased downstream of the TSS in naked DNA (Fig. 2C), but no peak was seen upstream of the TSS, thus ruling out DNA sequence bias as the cause for mCPDs peak near the TSS in cellular DNA.
As expected, the overall mCPD level decreased during repair for both gene groups (Fig. 2 C and D). However, the damage peak in TTCCGG genes persisted even after 24-h repair, albeit at lower height (Fig. 2C), likely reflecting partially inhibited NER activity in the peak region. To quantify repair rates, we normalized the remaining damage at 6 and 24 h by the initial damage at 0 h. This analysis takes into consideration of variable initial damage to generate fraction of remaining mCPDs. DNA regions with slower repair will end up having higher fraction of remaining damage. Our data show that repair is indeed inhibited upstream of the TSS for TTCCGG genes (Left panels of Fig. 2 E). Repair in non-TTCCGG genes was also inhibited, but at a lower magnitude than the TTCCGG genes (Right panels of Fig. 2 E). The lower repair rate in TTCCGG promoters is likely due to prevalent ETS binding (Fig. 1F), as a recent study shows that ETS1 protein can bind to target DNA irradiated by UV and shield the UV damage from being recognized by NER repair factors (27).
The TTCCGG motif is generally associated with high melanoma mutations (SI Appendix, Fig. S2A). To test whether the motif sequence is also associated with elevated mCPDs, we analyzed CPD-seq data in the expanded TTCCGG gene group (n = 3,946), which includes all genes with a TTCCGG sequence in the TSS region. The mCPD peak is still visible in this gene group (SI Appendix, Fig. S2 C and D).
Analysis of mCPDs in cells irradiated by 8 J/m2 of UV light revealed generally higher damage formation around TSS, with a damage peak upstream of the TSS (SI Appendix, Fig. S5B). The peak persisted even after 24 h repair, while damage in the more upstream or downstream region was efficiently repaired (SI Appendix, Fig. S5 C and D), consistent with the notion that repair in the peak is inhibited by ETS binding.
Different from mCPDs, formation of TT dimers is reduced near the TSS for both gene groups (SI Appendix, Fig. S6 A and B). The reduction is partially due to DNA sequence bias, as TT dimer formation also shows a dip near the TSS in naked genomic DNA. Repair of TT dimers is also inhibited near the TSS, shown by higher fraction of remaining damage at 6 and 24 h (SI Appendix, Fig. S6 C and D). The quantification result is noisier than the mCPD repair data, potentially due to low number of TT dimers.
Damage and Mutation Signatures in TTCCGG Gene Promoters.
The above analyses were conducted in genes aligned by their TSS in a 4,000-bp window. To better analyze mCPDs and mutations and their relationship with the ETS binding sequences, we aligned the 968 promoters by the TTCCGG motif and zoomed in to focus on 500-bp range on each side of the motif. The new alignment revealed a much sharper peak for mutations centered on the motif (Fig. 3 A, Top), which is mirrored by high initial and remaining mCPD peaks at the same location in both 6 and 8 J/m2 UV treatment experiments (Fig. 3A and SI Appendix, Fig. S7). Gene-by-gene heatmaps also revealed mutation and mCPD hotspots near the TTCCGG motif (Fig. 3B).
Fig. 3.

Mutation and UV damage signatures in TTCCGG gene promoters. (A) The 968 TTCCGG genes were aligned by the TTCCGG motif to present melanoma mutations and mCPDs relative to the motif site. The center (position 0) is the midpoint of the TTCCGG motif. (B) Heatmaps of mutations and mCPDs for each TTCCGG gene. Genes were aligned by the motif sequence and sorted based on the mutation frequency in the melanoma cohort (e.g., Top shows the most frequently mutated promoters). (C) Mutations and mCPDs in the core TTCCGG and flanking DNA (21 bp in total). Similar to panel (A), the TTCCGG promoters are aligned by the conserved motif. Mutation and damage are shown for each single nucleotide position. The consensus sequence in the core motif and flanking DNA is generated with WebLogo (28).
A close inspection of mutations in the TTCCGG motif and immediate flanks (21 nucleotides in total) revealed two discernible mutation hotspots. The first hotspot is located at the 0 and +1 positions within the core motif (i.e., TTCCGG, the first C is counted as position 0). The second hotspot is located at the −3 and −4 positions on the 5′ side of the core motif (Fig. 3 C, Top). Consistent with the two mutation hotspots, two mCPD damage hotspots were also found at the same positions, including lesions formed at 0/+1 and −3/−4 (Fig. 3C). The two mCPD hotspots were found at 0 h and they largely persisted after repair (Fig. 3C). The −1 position can also form a TC dimer with position 0; however, the −1 position is a conserved T (Fig. 3C), which is not mutagenic even with a CPD lesion. Hence, these analyses indicate that the two mutation hotspots are tightly associated with mCPDs formed at the same locations that are partially resistant to cellular repair.
Cytosine Deamination in CPDs Is Suppressed by ETS Binding.
The cytosine in CPDs is unstable and susceptible to deamination to form uracil. As uracil can be recognized as a thymine during replication, CPD deamination is suggested to play a role in promoting C>T transitions in UV mutagenesis (26). A recent study developed a new sequencing method called circle-damage-seq and mapped deaminated CPDs (i.e., uracils) in UV-treated human fibroblasts (29). Using the circle-damage-seq data, we counted the number of deamination reads in TTCCGG genes aligned by the TTCCGG motif. Deamination was generally higher in UV-treated cells relative to No UV control cells (Fig. 4 A, Left) and a deamination peak was found in TTCCGG genes near the motif sequence (Fig. 4A and SI Appendix, Fig. S8A), consistent with high mCPDs leading to more deamination in TTCCGG promoters. The circle-damage-seq method also generated an initial CPD map in UV-treated fibroblasts (29). Consistent with our CPD-seq data, analysis of the circle-damage-seq data revealed a high mCPD peak in TTCCGG promoters (SI Appendix, Fig. S8B). To gain insights into deamination rate (i.e., deamination per mCPD), the deamination data were normalized by the mCPD damage level generated by circle-damage-seq. Intriguingly, the analysis revealed slower deamination rate in the TTCCGG motif relative to the flanking DNA (Fig. 4 A, Right), suggesting that ETS protein binding reduces CPD deamination rate, even though the overall deamination is high due to very high CPD lesion levels. The reduced deamination rate was also found by normalizing deamination data (24 h) to the remaining mCPDs (24 h) generated by CPD-seq 2.0 (SI Appendix, Fig. S8C).
Fig. 4.
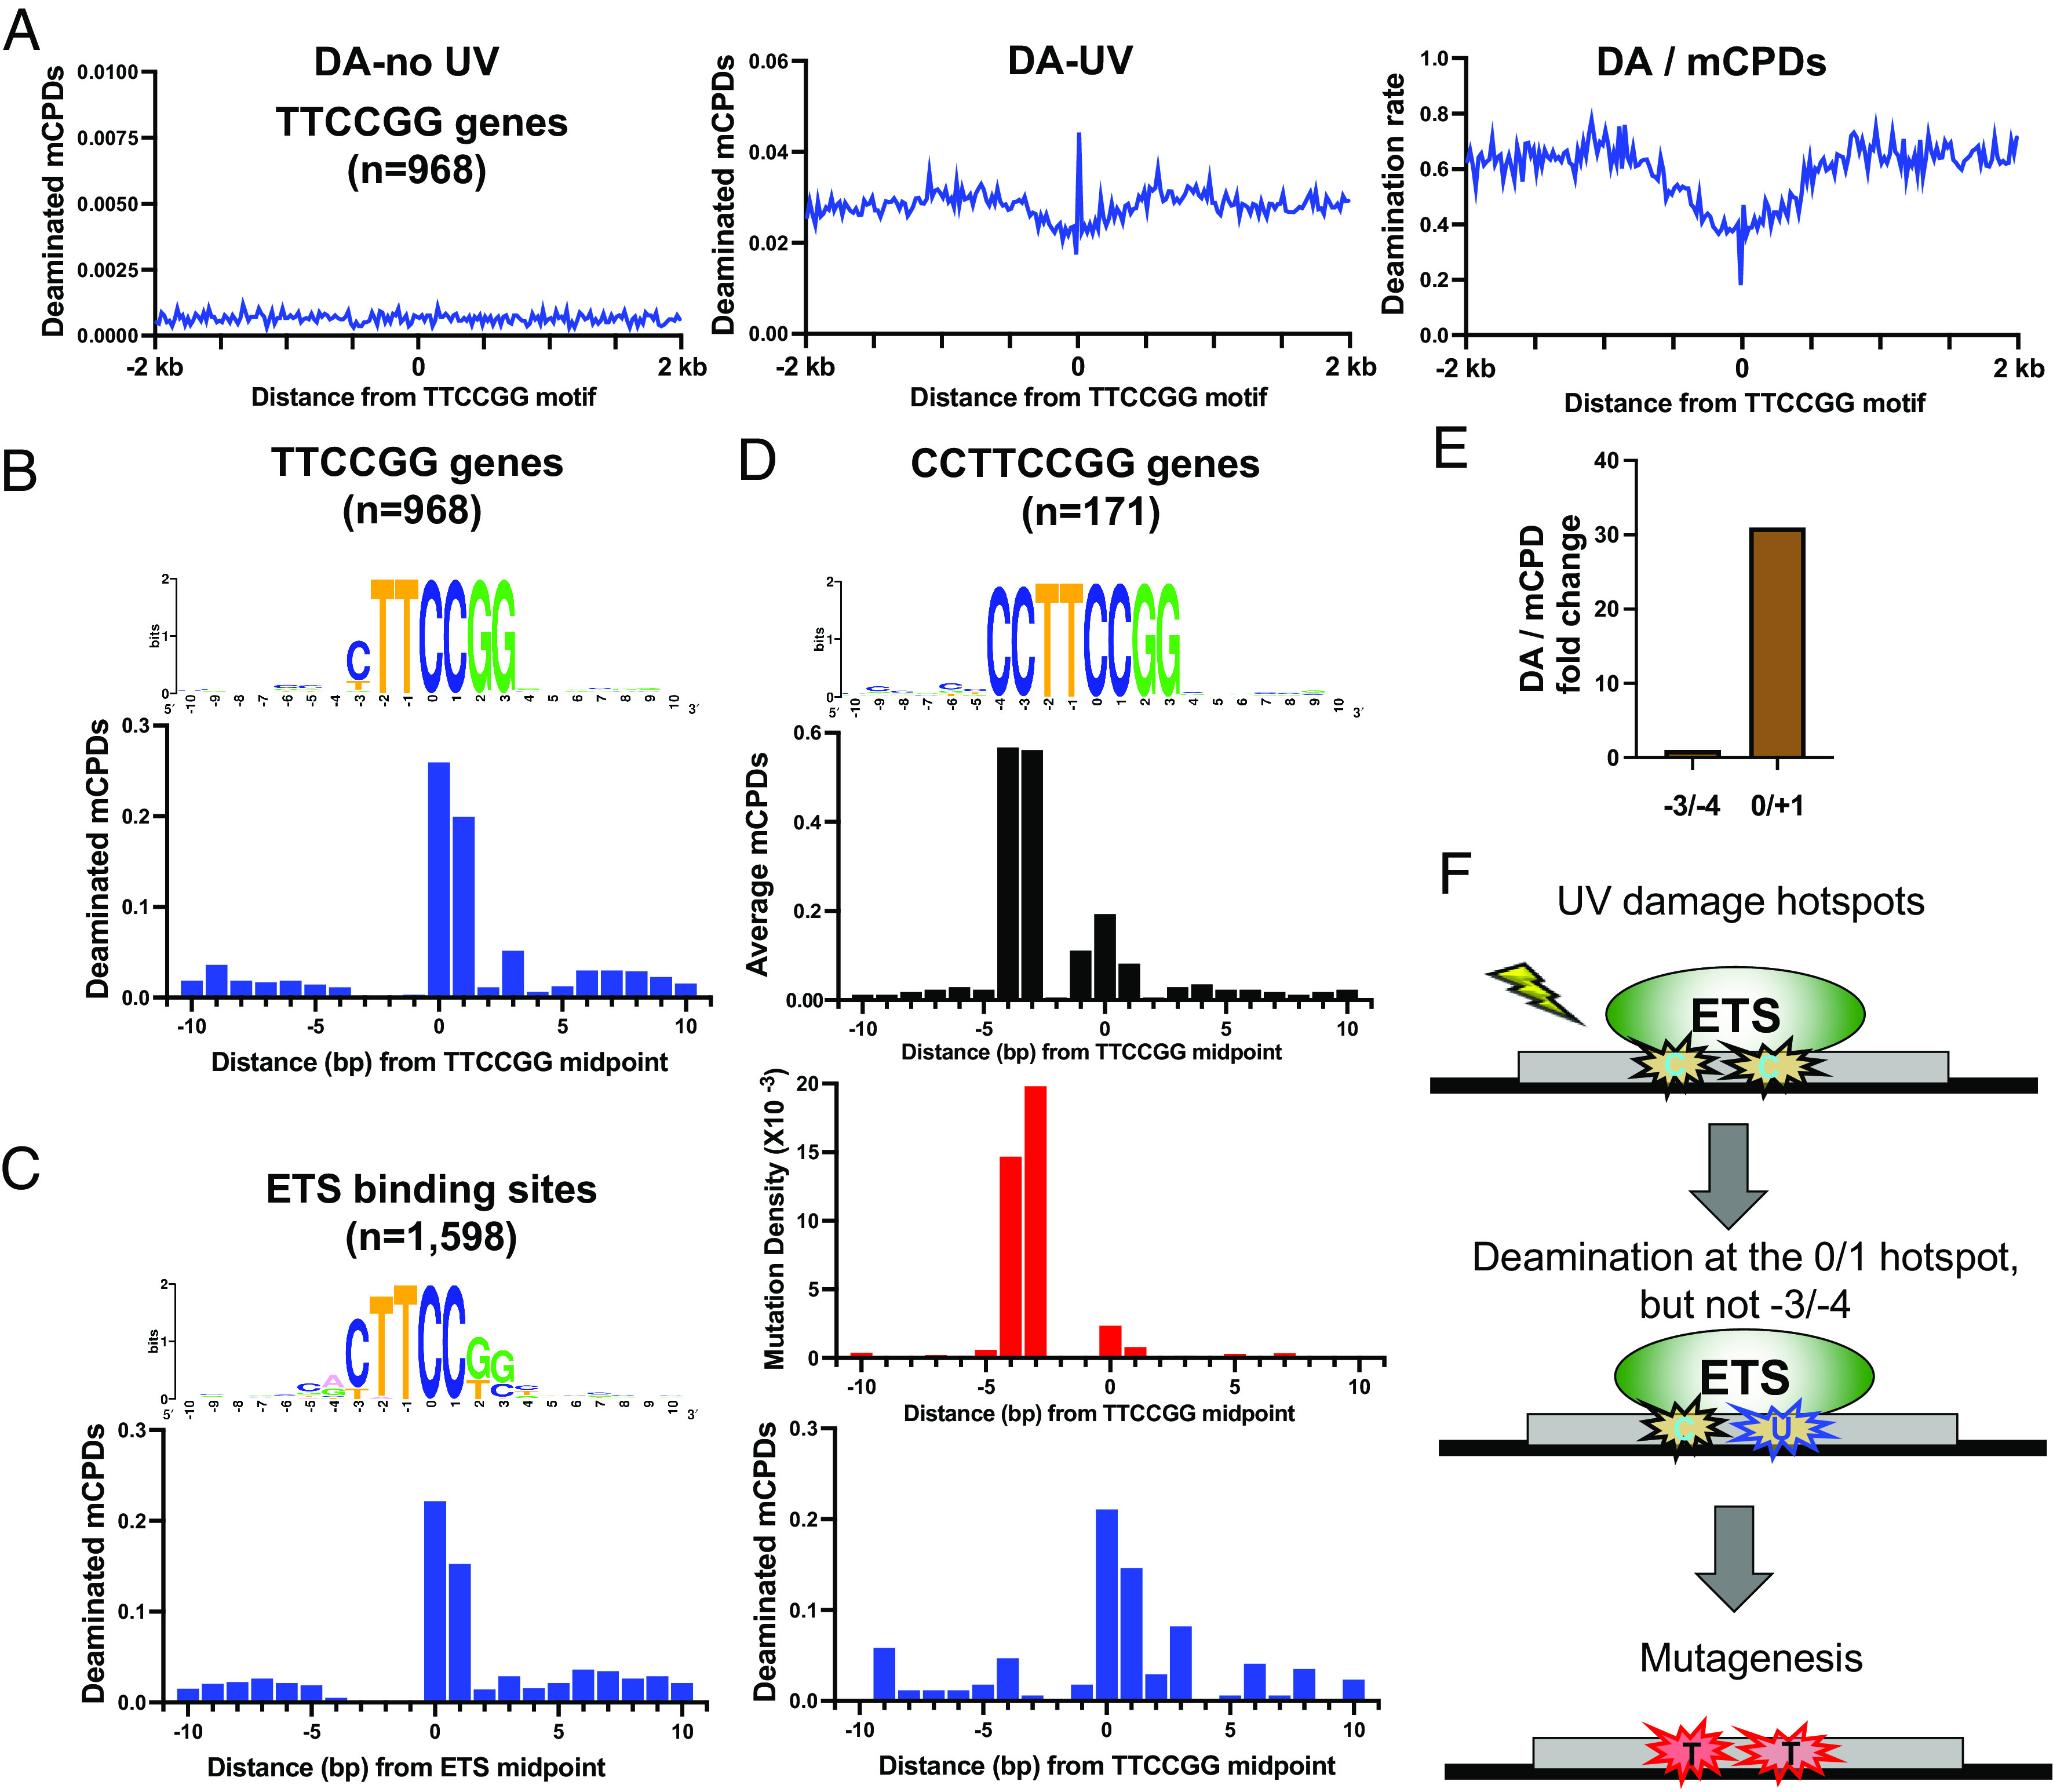
CPD deamination in TTCCGG promoters and at ETS binding sites. (A) Cytosine deamination (DA) in control (i.e., no UV) and UV-treated cells (48 h). The DA data was obtained from the published circle-damage-seq study (29) and the average DA reads (reads per gene) are plotted for TTCCGG genes aligned by the conserved motif sequence. The panel on the Right shows DA rate, which is DA normalized by mCPDs. (B) Average DA reads (UV treated, 48 h) in the core TTCCGG motif and flanking DNA at each position. (C) The ETS binding sites mapped by ChIP-seq were aligned by the conserved motif sequence and the average DA reads were plotted at each single nucleotide position. (D) A subset of TTCCGG promoters in which the −3 and −4 positions are two consecutive Cs were aligned and the average mCPDs, melanoma mutations, and DA reads were plotted for each position. (E) Comparison of DA rate (DA/mCPDs) between −3/−4 and 0/+1. The rate at −3/−4 is set at 1.0 and the relative fold change at 0/+1 is shown. (F) Model showing two discernible mCPD hotspots at ETS binding sites at −3/−4 and 0/+1 positions, respectively. Only the hotspot at 0/+1 is deaminated to form uracil. Deamination at the −3/−4 hotspot is suppressed by ETS binding; however, both damage hotspots are converted to C>T mutations in melanoma.
Interestingly, a close inspection of deamination in aligned TTCCGG gene promoters indicates that deamination is strongly suppressed at the −3/−4 positions, but not at the 0/+1 positions (Fig. 4B). To confirm that deamination is suppressed at the −3/−4 positions, we repeated the analysis at ETS binding sites using the published ETS ChIP-seq data (21, 22). Notably, the consensus sequence of the 1,598 ETS binding sites is slightly different from the conserved TTCCGG motif, because ETS proteins also bind to sequences with some degree of variabilities (20). Consistently, deamination is very low at the −3/−4 positions, but high at 0/+1 at these experimentally mapped ETS binding sites (Fig. 4C), confirming that mCPDs formed at the 0/+1 positions are more susceptible to deamination than the −3/−4 positions.
We noticed that the sequences at −3/−4 positions are more variable than 0/+1 (Fig. 4B) and wondered if the low deamination is due to low frequency of cytosines. To test this, we extracted TTCCGG promoters where the −3 and −4 positions are two consecutive cytosines to match the two conserved Cs at 0 and +1. This gave us a subset of gene promoters (n = 171) with cytosines at −3/−4 and 0/+1 positions (Fig. 4D). Notably, the level of mCPDs at −3 and −4 is much higher than the 0 and +1 positions in this subset of promoters (Fig. 4 D, Top), suggesting that the −3/−4 positions are more prone to CPD formation than the 0/+1 positions with identical sequences. Consistently, mutation density is also significantly higher at −3/−4 in this subset of promoters (Fig. 4 D, Middle), indicating that mCPDs lesions formed at −3/−4 are mutagenic. While the UV damage level and mutation density are high, cytosine deamination at the −3/−4 positions is significantly lower than that at the 0/+1 positions for this subset of promoters (Fig. 4 D, Bottom). Considering that mCPDs are higher, the average deamination rate (i.e., deamination per mCPD) at −3/−4 is only about 1/30 of the rate at the 0/+1 positions (Fig. 4E). Together, these analyses suggest that ETS binding induces two discernible CPD hotspots at −3/−4 and 0/+1 positions. Although the damage at 0/+1 undergoes deamination, CPD deamination at −3/−4 positions is strongly inhibited. Intriguingly, the lack of cytosine deamination does not affect the subsequent C>T mutations, suggesting a cytosine deamination-independent UV mutagenesis at the −3/−4 positions (Fig. 4F and see Discussion).
ETS Binding Affects Water Distribution Around 0/+1 and −3/−4 Positions.
Deamination of CPD lesions is a spontaneous process in which the cytosine is attacked by water and an amino group is lost (Fig. 5A) (30, 31). Although little is known about how CPD deamination is affected by DNA interaction with TFs, previous studies have shown that histone–DNA interactions in nucleosomes can modulate CPD deamination rates in vitro and in cells (18, 32, 33). Specifically, CPDs located at inward rotational positions in a nucleosome have significantly lower deamination rates than the outward rotational positions. It was suggested that DNA at outward positions might be more prone to water attack due to its higher flexibility relative to inward positions (32, 33).
Fig. 5.

ETS binding modulates H2O distribution near the two damage hotspots. (A) Schematic of spontaneous cytosine deamination in a CPD. The amino group of cytosine can be hydrolyzed to form uracil. (B) Surface view of the ETS–DNA complex structure showing a cluster of charged amino acids (red) in close contact with the 0/+1 bases (blue), which forms a pocket to trap H2O molecules. The protein–DNA complex structure is from the published study (34) and the DNA sequence used in the complex is shown on the Top. (C) Zoom-in view of charged amino acids near the 0/+1 bases. (D) In contrast to the 0/+1 bases, no charged amino acids are in the vicinity of the −3/−4 bases. (E) A representative depiction of H2O distribution near 0/+1 and −3 bases. The −4 position is an A (adenine) in the complex structure (see panel B) and is not shown in the simulation data. (F) The number of hydrogen bonds formed between H2O and different bases.
To gain a better understanding of the differential deamination rates between 0/+1 and −3/−4 positions in ETS motif, we conducted all-atom molecular dynamics (MD) simulations of the ETS–DNA complex. These simulations, which included the presence of water and ions, were initiated using the experimentally determined ETS–DNA complex structure (PDB ID:1AWC) (34). A close examination of the structure revealed a cluster of charged amino acids (Fig. 5B, red surface) in close contacts with the 0/+1 bases (Fig. 5B, blue surface). These amino acids, including Glu372, Lys373, Arg376, and Arg379 on the α-helix of the ETS DNA-binding domain, face C0 and C1 (Fig. 5C). These charged amino acids can form strong electrostatic and hydrogen bond interactions with water molecules, which effectively hold water in a pocket near the two cytosines (C0 and C1). In contrast, no hydrophilic amino acid was found in close vicinity to −3/−4 positions (Fig. 5D), which may reduce density and/or the residence time of water molecules surrounding these two bases. Thus, the different hydrophilic environments for 0/+1 and −3/−4 bases may contribute to their disparate CPD deamination rates.
To provide further evidence that water distribution is affected by ETS binding, we calculated the number of water molecules and hydrogen bonds formed between water and DNA bases in the presence of ETS protein, using data from the final 10 ns of our simulations. The simulations revealed a significantly higher number of water molecules surrounding C0 and C1 compared to C−3 (Fig. 5E). The −4 position was an adenine in the complex structure (Fig. 5B) and was not counted in our simulations. Similarly, the number of hydrogen bonds was also much higher for C0 and C1 relative to C−3 (Fig. 5F). Therefore, the calculation results (Fig. 5 E and F) align with the structural analysis (Fig. 5 B–D), both of which support a more hydrophilic environment at the 0/+1 positions in the ETS–DNA complex, likely promoting cytosine deamination.
Another potential contributing factor for CPD deamination is the DNA sequence. The published data in nucleosomes suggest that CPD deamination is accelerated if the lesion is flanked by a guanine on the 3′ side (30). Comparison of the 3′ flanking nucleotide indicates that CPD formed between 0/+1 is flanked by a G on the 3′ side, while the lesion between −3/−4 is flanked by a T (Fig. 4D). To understand to what extent the flanking nucleotide affects CPD deamination in ETS motif, we stratified ETS binding sites (Fig. 4C) based on the flanking nucleotide at the +2 position (e.g., TTCCG or TTCCT). The stratification led to 1,092 sites where the +2 position is a G and 506 sites with a T (SI Appendix, Fig. S9). In the two subgroups, the damage formed at 0/+1 is flanked by a G or T, but other sequences are similar, thus allowing us to compare the potential effect of the flanking nucleotide on CPD deamination. Analysis in the two subgroups indicates that CPD deamination at 0/+1 is higher in the G-flanking ETS sites (SI Appendix, Fig. S9A) relative to the T-flanking sites (SI Appendix, Fig. S9B), but the difference is only about twofold. After normalized to mCPD levels formed at 0/+1, deamination rate (i.e., deamination per mCPD) in G-flanking sites is ~1.6-fold as high as the T-flanking sites. The data indicate that the 3′ flanking G indeed increases CPD deamination; however, the magnitude of increase is much smaller than the difference between 0/+1 and −3/−4, which is ~30-fold (Fig. 4E). Hence, the flanking DNA sequence can contribute to deamination, but it is unlikely the main mechanism for the observed difference in CPD deamination between 0/+1 and −3/−4 positions.
Mutation Hotspots Reduce Promoter Activities.
Although mutations in the TERT promoter (e.g., C250T and C228T) have been shown to activate TERT expression, how other mutation hotspots affect promoter activities remains unclear. To characterize how they affect gene expression, we cloned the promoter fragment of two frequently mutated genes, RPL13A and RPS20, and tested their activities in driving the firefly luciferase reporter gene with or without the cancer mutation.
RPL13A, which encodes a protein for the 60S subunit of the ribosome, has the highest promoter mutation frequency in the cohort (Fig. 1C). RPL13 has two mutation sites at −3 and 0 positions in the ETS motif, occurring in 47 and 10 tumors, respectively (Fig. 6A). Additionally, 7 tumors in the cohort have mutations at both positions (i.e., −3 and 0). We transfected A375 melanoma cells with the reporter plasmids containing each single mutation or the double mutation and measured firefly luciferase activity. Using this system, we found that mutation sites in RPL13A, occurring at −3 and 0 positions, reduced luciferase activity by 30 and 50%, respectively (Fig. 6A). The double mutation reduced the promoter activity by more than 60% (Fig. 6A).
Fig. 6.

Mutation hotspots reduce promoter activities. (A) Two single mutations at position −3 (mutation 1; MT1) and 0 (MT2) of RPL13A promoter were introduced into the fire luciferase plasmid. The WT and double mutation (MT3) plasmids were also generated and expressed in melanoma A375 cells. The firefly luciferase signal was normalized by the co-transfected renilla luciferase and fold change in each mutant plasmid relative to WT is plotted. (B) In vitro ETS1 binding levels at ETS sites in the WT and MT1 RPL13A promoter sequences, relative to the overall distribution of ETS1 binding levels at 12,619 putative sites in the human genome (35). The x-axis shows the log-transformed binding intensity measurements from gcPBM experiments (GEO Series GSE97794) normalized to the [0,1] interval, as in ref. 35. The gcPBM data was binned into 112 bins with width of 0.01. The y-axis shows the number of ETS1 sites in each bin. The vertical, dashed lines show the predicted ETS1 binding levels for the sites in each promoter sequence, according to an iMADS model trained on gcPBM data (35). (C) Analysis of WT and mutant RPS20 promoter using the luciferase system. (D) Similar to panel B, but for the two ETS1 binding sites (site A and site B) identified in the RPS20 promoter. (E) Mutation in CDC20 promoter and its impact on luciferase activity. (F) Similar to panel B, but for the ETS1 site in the WT and MT CDC20 promoter. *P < 0.05, **P < 0.005, ***P < 0.0005.
The reduced luciferase activities in the mutants could be due to weakened binding of ETS proteins to the RPL13A promoter. To test this hypothesis, we used iMADS (integrative Modeling and Analysis of Differential Specificity), a binding-core stratified support vector regression model trained on genomic-context protein-binding microarray (gcPBM) data (35). iMADS takes our WT or MT promoter sequences as input and outputs the predicted, normalized log-transform binding specificity of ETS proteins for each sequence of interest (35). The iMADS analysis shows that binding specificity of ETS1 to the MT1 sequence (mutation at −3 position) is reduced relative to WT (Fig. 6B and SI Appendix, Table S1), which is consistent with the reduction of luciferase activity. MT2 and MT3 do not have canonical ETS1 binding sites and are not included in the iMADS results. We chose ETS1 protein for iMADS analysis because it is one of the most abundant ETS proteins in melanoma (SI Appendix, Table S2).
RPS20 encodes a protein for the 40S subunit of the ribosome. The RPS20 promoter only has one mutation hotspot which occurs in a TCCCGG context and is found in 26 tumors. The C>T transition in RPS20 promoter generates a new TTCCGG sequence, similar to the TERT oncogenic mutations. However, our data show that the mutation in RPS20 promoter reduced the luciferase activity by over 20% from multiple independent tests (Fig. 6C). As a control, we also analyzed the TERT promoter and confirmed that the C228T mutation significantly enhanced luciferase activity (SI Appendix, Fig. S10).
The reduced RPS20 promoter activity suggests that the cancer mutation may weaken the binding of ETS proteins, even though the mutation creates a new TTCCGG motif. Interestingly, close analysis of the WT RPS20 sequence revealed two potential ETS binding sites, site A and B, with the mutation occurring in site A (Fig. 6D). Site A is in the ATCCC context and contains an ATCC motif, which is another core sequence recognized by ETS proteins (in addition to TTCC) (20). iMADS analysis shows that site A is a relatively weak binding site for ETS1, and the cancer mutation (underlined in Fig. 6D) further reduces the binding specificity by ~45% (Fig. 6D and SI Appendix, Table S1), likely by disrupting the ATCC core sequence. Although the mutation generates a new TTCC sequence after the first A, it appears that disruption of ATCC outweighs the contribution of the new TTCC sequence.
Site B is only three nucleotides away from site A and it contains a TTCC motif located on the opposing strand (Fig. 6D). iMADS shows that ETS1 has a high binding specificity to site B and ETS1 binding to site B is not affected by the mutation in site A (Fig. 6D and SI Appendix, Table S1). The decrease in luciferase activity is consistent with the MT sequence having a significantly weaker ETS1 binding site (site A) than its WT counterpart, but the still high luciferase activity seen in the RPS20 MT condition may be attributable to the strong binding of ETS1 to site B, and a potential cooperative binding effect between the two closely located binding sites.
In comparison, the TERT C228T mutation occurs in the CCTCC sequence context, which by itself does not contain an ETS binding site. The mutation generates a new TTCC motif after the first C. iMADS modeling indicates that the new TTCC significantly enhances ETS1 binding to the mutant sequence (SI Appendix, Table S1), consistent with the elevated luciferase activity. These results suggest that sequence context plays an important role in determining binding (or not binding) of ETS proteins to the mutation site.
In addition to the two ribosomal genes, we extended our analysis to another frequently mutated promoter, Cell Division Cycle 20 (CDC20). The CDC20 promoter has two mutation hotspots at the −3 and −4 positions relative to the TTCCGG motif (Fig. 6E). Together, 27 tumors (out of 140) have either a single or a double mutation in the CDC20 promoter. We generated a CC>TT double mutation in the promoter fragment and found that the tandem mutation reduced the promoter activity by ~25%, consistent with the notion that the tandem mutation may reduce ETS binding to the promoter. The luciferase data is supported by iMADS data showing weakened binding of ETS1 to the MT CDC20 promoter compared to the WT sequence (Fig. 6F and SI Appendix, Table S1). Together, our data indicate that the noncoding mutation hotspots play an important role in reducing the promoter activity, likely by weakening ETS protein binding.
Discussion
Despite the finding of numerous promoter mutations in melanoma, the underlying mechanisms and the biological impacts of these noncoding mutation hotspots remain poorly defined. Here, we present data showing that many mutation hotspots in promoters are associated with TTCCGG, one of the binding sequences of ETS TFs (20). We used genome-wide CPD sequencing data to demonstrate that high mutations in promoters of ETS-regulated genes (i.e., TTCCGG genes) are correlated with high mCPD formation and low DNA repair. The combination of both likely leads to long-persisting CPD lesions in these promoters that are converted to mutations when replicated by DNA polymerase.
The published study suggests that the elevated mutation density in promoters is caused by PIC assembly on gene promoters (5). PIC consists of several general TFs, such as TFIIA, TFIIB, TFIID, TFIIE, TFIIF, and TFIIH, that facilitate RNA Pol II loading to the promoter and help Pol II initiate gene transcription (36). General TFs do not recognize specific DNA sequences, except for TATA-binding protein in PIC, which binds to the TATA box (37). However, the TATA box is enriched in adenine and thymine (38) and lacks mCPD-forming sequences (e.g., C-containing dipyrimidines). By analyzing the sequence contexts of each mutation site, our data shows that >60% of mutation hotspots (i.e., mutated in at least 5% of tumors in the cohort) are associated with the ETS motif sequence, TTCCGG. Further analyses in TTCCGG gene promoters show high mCPD formation and low DNA repair. These mutation and UV damage data demonstrate that ETS TFs likely play a more important role than PIC in stimulating the promoter mutations near gene TSS.
Our published study has shown that ETS binding induces a DNA conformation that favors UV damage formation by modulating the distance and torsion angle between the C5-C6 double bonds of two adjacent pyrimidines (15). A recent study using purified ETS proteins and synthesized oligonucleotides shows that ETS can still bind to UV-damaged DNA, albeit with slight changes to the DNA sequence specificity (27). The study also shows that the binding affinity of ETS proteins to UV-damaged DNA is strong enough to compete with the UV damage recognition factor, UV-DDB, suggesting that repair of UV damage might be inhibited by ETS proteins (27). By tracking mCPDs at 6 and 24 h post-UV treatment and normalizing the remaining damage to the initial damage level, our CPD-seq data revealed repair inhibition: up to 40% of mCPDs remain unrepaired at 24 h at the binding sites, in comparison to ~20% unrepaired damage in the flanking DNA (Fig. 2E). This analysis suggests that ETS binding can partially block DNA repair. A likely scenario is that UV damage may partially displace ETS proteins from the binding locations; however, a portion of ETS may stay bound and inhibit the access of repair proteins to the damage. In our previous study (15), we analyzed eXcision Repair-sequencing (XR-seq) data (39) and showed that repair activity is high at ETS binding sites. We revisited the XR-seq data and confirmed high repair activity in the 968 TTCCGG gene promoters (SI Appendix, Fig. S11A). However, further normalization of XR-seq by the initial CPD damage shows that the repair rate (i.e., repair per CPD) is decreased at ETS binding sites relative to the flanking DNA (SI Appendix, Fig. S11B). Thus, the high repair activity is mainly driven by high levels of initial UV damage at ETS sites. The repair rate after considering the damage level is reduced by ETS binding.
Somewhat unexpectedly, analysis of the CPD deamination data shows that ETS binding strongly suppresses cytosine deamination at the −3/−4 positions, but has little effect on the 0/+1 positions (Fig. 4 C and D). As these positions were analyzed simultaneously using the same deamination datasets, the contrast between them points to a location-specific effect on CPD deamination imposed by ETS–DNA interaction. Our further analysis of the ETS–DNA complex structure and MD simulation data supports this hypothesis. From these analyses, it is evident that the 0/+1 positions are in close contacts with a cluster of charged amino acids. The hydrophilic environment surrounding 0/+1 favors retention of H20 molecules for spontaneous hydrolysis of the unstable amino group of cytosine within a CPD. On the other hand, the lack of charged amino acids and the resulting low density of H20 molecules near −3/−4 creates an unfavorable deamination environment, even with a high level of mCPDs being present. As both −3/−4 and 0/+1 have high CPDs and high mutations, but differ significantly in CPD deamination, our data highlight the importance of UV damage in stimulating mutations at ETS binding sites, regardless of cytosine deamination (Fig. 4F). Several translesion synthesis (TLS) DNA polymerases have been shown to play a role in UV mutagenesis, including Pols eta, kappa, and zeta (40). Although Pol eta has been shown to bypass TT dimers in an error-free manner, it is less clear how accurately it can bypass C-containing dimers (41–43). Furthermore, Pols kappa and zeta are error-prone TLS enzymes and significantly elevate C>T mutations on UV-damaged DNA (40). Hence, mutations corresponding to the −3/−4 positions may be caused by error-prone bypass of mCPDs by these TLS polymerases.
Although a large number of highly recurrent promoter mutations have been identified, their biological functions remain poorly understood. As the first step to uncovering their impacts on gene expression, we introduced the point mutations identified in RPL13A and RPS20, two of the most frequently mutated ribosomal gene promoters, and a CC>TT tandem mutation identified in CDC20, into a luciferase reporter system. By measuring luciferase activity in melanoma cells, we found that mutations in the canonical ETS binding motif (e.g., RPL13A and CDC20) reduced reporter gene expression. Considering the two mutation sites in RPL13A and the tandem mutation in CDC20 occur in the conserved ETS binding site, the mutations likely weaken ETS–DNA interactions. The RPS20 mutation was expected to generate a new ETS motif (from TCCCGG to TTCCGG) and increase promoter activity based on the sequence analysis. But our data revealed over 20% reduction of promoter activity by the RPS20 mutation. Our further analysis found two close ETS binding sites in opposite orientations in the RPS20 promoter. The mutation occurs in ATCCCGG and it disrupts ATCC, a core ETS motif, and the disruption significantly reduces ETS1 binding based on our iMADS data. Our analysis of RPS20 suggests that the WT promoter is likely bound by ETS proteins at both site A and site B. The mutation weakens the function of site A, but not site B, which may lead to reduction of the promoter activity.
In summary, our study shows a profound role of ETS TFs in stimulating promoter mutation hotspots, through increasing CPD formation and inhibiting DNA repair, but not by accelerating cytosine deamination. Our data also revealed that mutation hotspots in ribosomal protein genes significantly reduce the promoter activity. As a large number of ribosomal gene promoters are frequently mutated in cutaneous melanoma, our finding suggests potential defects in ribosomal biogenesis, which may have important implications for understanding melanoma onset and development.
Methods and Materials
Melanoma Mutation Analysis.
Whole-genome mutation data in melanoma are downloaded from the ICGC data portal (https://dcc.icgc.org/releases/current/Projects/MELA-AU; file name: simple_somatic_mutation.open.MELA-AU.tsv.gz). A total of 183 tumors are included in the cohort. Tumors are stratified to cutaneous and non-cutaneous tumors using the published specimen information. The 140 cutaneous tumors have ~20 million somatic mutations, such as single- and double-nucleotide substitutions. The 43 non-cutaneous tumors have ~341,000 simple mutations. To analyze mutation density along transcribed genes, we used bedtools (44) and intersected the mutation data with annotated human genes downloaded from Gencode (GRCh37, release 44). Mutations located in the promoter region (±2 kb relative to the TSS) of each gene are included in Dataset S1. The intersection data were further processed with custom Python scripts to calculate average mutation density (i.e., number of mutations per tumor per gene at each position) for genes aligned by the TSS (e.g., Fig. 1A).
Human genes were separated into TTCCGG and non-TTCCGG genes, based on whether there was >=1 UV mutation associated with the TTCCGG motif in the peak region, ranging from −200 bp to +100 bp relative to the TSS. This analysis revealed 968 TTCCGG genes and 9,864 non-TTCCGG genes (Dataset S2). The rest of genes had 0 UV mutation in the peak region and were excluded from the subsequent analysis. Similar to mutation density analysis for all genes, cutaneous tumor mutations were intersected with TTCCGG and non-TTCCGG genes, respectively, and average mutation density was analyzed using custom Python scripts for each gene group (e.g., Fig. 1 E and F).
ETS ChIP-seq peak data were downloaded from http://bg.upf.edu/group/projects/tfbs/ (file name: proximalTFBS-DHS_skcm.bed.gz) based on the published paper (21, 22). A total of 1,598 active ETS binding sites located in TSS-proximal regions were collected to compare their binding density between TTCCGG and non-TTCCGG genes.
CPD-seq 2.0 in Human Fibroblasts.
The methodology of CPD-seq 2.0 is similar to the original CPD-seq (11), but skipped sonication in the first step. The idea for this modification is that sonication will likely introduce numerous nicks and strand breaks in the genomic DNA in the original CPD-seq. Although the subsequent step using terminal transferase (TdT) and dideoxy-NTP (ddNTP) can block most breaks generated by sonication, a significant amount of them may still persist and increase the background signal and reduce the specificity for CPD mapping.
In CPD-seq 2.0, human skin fibroblasts, CS1AN/CSBWT (a gift from Hua-Ying Fan at UNM) (45) were grown to ~80% confluence and exposed to UV light for desired doses, for example 6 or 8 J/m2. A fraction of cells were immediately collected and stored at −80 °C freezer for repair time 0 h (i.e., no repair). The rest of the cells were incubated in fresh media and samples were taken at 6 and 24 h post UV treatment. For library preparation, genomic DNA was isolated using the Sigma GenElute™ Mammalian Genomic DNA Miniprep Kit. For each time point (e.g., no UV, 0, 6, and 24 h repair), 10 μg of genomic DNA was mixed with 1 ng UV-irradiated pUC19 plasmid DNA. The pUC19 plasmid DNA serves as a spike-in control for library sequencing depths and subsequent repair quantifications. The DNA was incubated with TdT and dideoxy-ATP (ddATP) to block free 3′ ends that were generated during DNA isolation step. However, because the genomic DNA was not sheared by sonication, it should contain significantly lower number of nicks and breaks compared to the original CPD-seq protocol. The genomic DNA was treated by the glycosylase T4 endonuclease V (T4 endo V) and AP endonuclease 1 (APE1). T4 endo V is a glycosylase that specifically cleaves a CPD lesion on the 5′ side. APE1 further processes the DNA product by T4 endo V and generates a new ligatable 3′-OH group 1 nucleotide upstream of the CPD lesion. After T4 endo V and APE1 digestion, DNA was denatured for single-stranded fragments and the 3′-OH group was immediately ligated to a splint adaptor DNA (color purple in Fig. 2A). After sonication to smaller DNA fragments (~300 to 400 bp on average), the ligation product was purified with Streptavidin beads, which recognize the biotin on the adaptor DNA, thus separating CPD fragments from the rest of the genomic DNA. The purified fragments were further processed to add the second adaptor for Illumina sequencing. After PCR amplification for 18 cycles using primers complementary to the two adaptors, the library was sequenced on an Illumina Novaseq platform at the University of Colorado Genomics Shared Resource.
After sequencing, adaptor sequences were trimmed using Trimmomatic (46). CPD-seq reads were aligned to the human reference genome using Bowtie 2 (47). PCR duplicates were removed and the precise locations of CPD lesions were extracted using Samtools and Bedtools (44, 48), as described in our published methods.
To analyze GG- and TC-NER, human genes were stratified by fibroblast RNA-seq data (https://www.ncbi.nlm.nih.gov/geo/query/acc.cgi?acc=GSE78610). The list for High, Medium, and Low expression genes can be found in Dataset S3. The coding region of each gene (from TSS to TTS) is split into six equal-sized bins. Flanking DNA (10 kb in each direction) in the promoter and terminator regions is split into two additional bins. The number of CPD-seq reads was counted in each bin on the NTS and transcribed strand (TS). The remaining CPD reads after repair (6 or 24 h) were normalized to the initial CPD reads at 0 h. The resulting fraction of remaining CPDs was further normalized by the pUC19 read ratio [i.e., pUC19-6 h/pUC19-0 h (0.72 for 6 h) and pUC19-24 h/pUC19-0 h (0.93 for 24 h)] and plotted in SI Appendix, Fig. S4B.
CPD Deamination Datasets.
CPD deamination data were generated in a published study using a circle damage sequencing method (29). In this study, human fibroblast cells were treated by UV light and initial CPDs (i.e., 0 h repair) and deaminated CPDs at 0, 24, and 48 h were sequenced. The CPD and deaminated CPD data were downloaded from the GEO (Gene Expression Omnibus) database (accession number GSE159807). The dataset named HDF_DA_48h_800M was used to generate Fig. 4. CPD formation in TTCCGG genes using circle damage sequencing was plotted in SI Appendix, Fig. S8B. Deamination analysis at 0 and 24 h was also included in SI Appendix, Fig. S8A.
ETS–DNA Structural Analysis and MD Simulations.
We used the published ETS–DNA complex structure (PDB ID: 1AWC, Chain A, D and E) (34) to survey the structural difference between 0/+1 and −3/−4 positions in the ETS motif. The simulation systems were established using Solution Builder model in CHARMM-GUI (49). The force field used in the simulations was Amber FF19SB (50, 51) cited at the CHARMM-GUI server with the TIP3P water model (52). Simulation results were visualized using UCSF Chimera (53). A solvation box measuring 10.7 nm on each side was utilized to house the DNA-protein complex, ensuring ample room for any necessary deformations. All systems were neutralized by adding counter ions. The MD simulations were done in GROMACS software package (54). All systems were energy-minimized at a maximum of 5,000 steps to remove non-physical contacts and interactions.
Subsequently, an NPT ensemble with 1 ns was performed to equilibrate the systems. The LINCS algorithm was used to constrain bond lengths between heavy and hydrogen atoms (55). Simulations were performed under a constant temperature of 300 K and a constant pressure of 1 atm using the Parrinello–Rahman method (56). Periodic boundary conditions were applied in all three directions, and the Particle mesh Ewald method was used compute electrostatic interaction (57). The cut-off distance of van der Waals interaction and Coulomb interaction are both set to 9 Å. The duration of production simulations was 100 ns. Analysis of simulation results was done using GROMACS tools and visualized with OriginLab (58).
Luciferase Assay.
Promoter fragments (~150 bp) of RPL13A, RPS20, and CDC20 were PCR-amplified and cloned into the firefly luciferase plasmid pGL4.0. Point mutations were introduced to the desired sites using a site-directed mutagenesis kit (Agilent). Both wild-type (WT) and mutated (MT) plasmids were confirmed by Sanger sequencing. The firefly plasmid was mixed with the renilla luciferase plasmid for transient transfection of A375 melanoma cells. Cells were harvested 24 h post transfection and the luciferase signal was measured using the Dual-Luciferase® Reporter Assay System (Promega). The firefly was normalized to the renilla signal and the ratio was reported as the promoter activity. At least three biological repeats (three technical repeats in each biological repeat) were conducted to obtain the average value and SD.
In Vitro ETS1 Binding Specificity Analyses.
To predict the in vitro binding specificity of ETS proteins to the putative binding sites in the promoter sequences of interest, we used the gcPBM data and predictions of Shen et al. (35). Among ETS family members we focused on ETS1, which is one of the most highly expressed ETS proteins in melanoma cells (SI Appendix, Table S2). In vitro binding measurements for ETS1 were available for 12,619 human genomic sites, each of them 36-bp long, centered on putative ETS sites with the cores TTCC or ATCC, from gcPBM experiments (GEO Series GSE97794, Sample GSM2577529, 100 nM ETS1 condition). We use the genomic sites to plot the overall distribution of ETS1 in vitro binding levels, shown as normalized, log-transformed binding intensity measurements, as in the published iMADS study (35). To predict the ETS1 binding levels for the sites identified in the RPL13A, RPS20, CDC20, and TERT promoters, we used the iMADS model trained on the ETS1 gcPBM data, available through the iMADS web tool (https://urldefense.com/v3/__http://imads.genome.duke.edu__;!!KXH1hvEXyw!YBxYexEnvLbkiD0DZGPDbOR1ZhLF_pinyrpXslV0slfBTMEOE1HeyQhMQ53JOS5AmM68pFNccKU-0PwsEYDWuSkEQaY$).
Supplementary Material
Appendix 01 (PDF)
Dataset S01 (XLSX)
Dataset S02 (XLSX)
Dataset S03 (XLSX)
Acknowledgments
We thank Dr. Hua-Ying Fan (University of New Mexico) for providing skin fibroblast cells and thank Drs. John Wyrick (Washington State University) and A. Hunter Shain (University of California, San Francisco) for reading the manuscript and giving feedback. We also want to thank Benjamin Morledge-Hampton, graduate student in the Wyrick lab, for helping us confirm data analysis. CPD-seq sequencing was performed by The Genomics Shared Resource at University of Colorado Anschutz Medical Campus. We acknowledge the Centre of Informatics—Tricity Academic Supercomputer & network (CI TASK) in Gdansk, Poland, for the availability of high-performance computing resources. This work was supported by NIH Grants R01CA273458 (to P.M.), R01AR080626 (P.M. as co-I), R21ES035139 (P.M. as co-I), R01GM135658 (to R.G.), and R01ES030993 (to K.J.L). This research was partially supported by UNM Comprehensive Cancer Center Support Grant NCI P30CA118100 and Analytical and Translational Genomics Shared Resource.
Author contributions
K.J.L., R.G., Y.H., and P.M. designed research; M.D., S.S., H.W., and P.-H.L. performed research; M.D., S.S., H.W., P.-H.L., R.G., Y.H., and P.M. analyzed data; and K.J.L., R.G., Y.H., and P.M. wrote the paper.
Competing interests
The authors declare no competing interest.
Footnotes
This article is a PNAS Direct Submission.
Data, Materials, and Software Availability
The CPD-seq 2.0 data have been deposited in the GEO database (accession number GSE235483) (59).
Supporting Information
References
- 1.Hayward N. K., et al. , Whole-genome landscapes of major melanoma subtypes. Nature 545, 175–180 (2017). [DOI] [PubMed] [Google Scholar]
- 2.Rheinbay E., et al. , Analyses of non-coding somatic drivers in 2,658 cancer whole genomes. Nature 578, 102–111 (2020). [DOI] [PMC free article] [PubMed] [Google Scholar]
- 3.Bell R. J. A., et al. , The transcription factor GABP selectively binds and activates the mutant TERT promoter in cancer. Science 348, 1036–1039 (2015). [DOI] [PMC free article] [PubMed] [Google Scholar]
- 4.Huang F. W., et al. , Highly recurrent TERT promoter mutations in human melanoma. Science 339, 957–959 (2013). [DOI] [PMC free article] [PubMed] [Google Scholar]
- 5.Perera D., et al. , Differential DNA repair underlies mutation hotspots at active promoters in cancer genomes. Nature 532, 259–263 (2016). [DOI] [PubMed] [Google Scholar]
- 6.Elliott K., et al. , Elevated pyrimidine dimer formation at distinct genomic bases underlies promoter mutation hotspots in UV-exposed cancers. PLoS Genet. 14, e1007849 (2018). [DOI] [PMC free article] [PubMed] [Google Scholar]
- 7.Pfeifer G. P., Mechanisms of UV-induced mutations and skin cancer. Genome Instab. Dis. 1, 99–113 (2020). [DOI] [PMC free article] [PubMed] [Google Scholar]
- 8.Schärer O. D., Nucleotide excision repair in eukaryotes. Cold Spring Harb. Perspect. Biol. 5, a012609 (2013). [DOI] [PMC free article] [PubMed] [Google Scholar]
- 9.Marteijn J. A., Lans H., Vermeulen W., Hoeijmakers J. H. J., Understanding nucleotide excision repair and its roles in cancer and ageing. Nat. Rev. Mol. Cell Biol. 15, 465–481 (2014). [DOI] [PubMed] [Google Scholar]
- 10.Frigola J., Sabarinathan R., Gonzalez-Perez A., Lopez-Bigas N., Variable interplay of UV-induced DNA damage and repair at transcription factor binding sites. Nucleic Acids Res. 49, 891–901 (2021). [DOI] [PMC free article] [PubMed] [Google Scholar]
- 11.Mao P., Wyrick J. J., “Genome-wide mapping of UV-induced DNA damage with CPD-seq” in The Nucleus, R. Hancock, Eds. (Springer US, 2020), pp. 79–94. [DOI] [PubMed] [Google Scholar]
- 12.Mao P., Smerdon M. J., Roberts S. A., Wyrick J. J., Chromosomal landscape of UV damage formation and repair at single-nucleotide resolution. Proc. Natl. Acad. Sci. U.S.A. 113, 9057–9062 (2016). [DOI] [PMC free article] [PubMed] [Google Scholar]
- 13.Selvam K., Sivapragasam S., Poon G. M. K., Wyrick J. J., Detecting recurrent passenger mutations in melanoma by targeted UV damage sequencing. Nat. Commun. 14, 2702 (2023). [DOI] [PMC free article] [PubMed] [Google Scholar]
- 14.Elliott K., Singh V. K., Boström M., Larsson E., Base-resolution UV footprinting by sequencing reveals distinctive damage signatures for DNA-binding proteins. Nat. Commun. 14, 2701 (2023). [DOI] [PMC free article] [PubMed] [Google Scholar]
- 15.Mao P., et al. , ETS transcription factors induce a unique UV damage signature that drives recurrent mutagenesis in melanoma. Nat. Commun. 9, 2626 (2018). [DOI] [PMC free article] [PubMed] [Google Scholar]
- 16.Sivapragasam S., et al. , CTCF binding modulates UV damage formation to promote mutation hot spots in melanoma. EMBO J. 40, e107795 (2021). [DOI] [PMC free article] [PubMed] [Google Scholar]
- 17.Tu Y., Dammann R., Pfeifer G. P., Sequence and time-dependent deamination of cytosine bases in UVB-induced cyclobutane pyrimidine dimers in vivo. J. Mol. Biol. 284, 297–311 (1998). [DOI] [PubMed] [Google Scholar]
- 18.Cannistraro V. J., Pondugula S., Song Q., Taylor J.-S., Rapid deamination of cyclobutane pyrimidine dimer photoproducts at TCG sites in a translationally and rotationally positioned nucleosome in vivo. J. Biol. Chem. 290, 26597–26609 (2015). [DOI] [PMC free article] [PubMed] [Google Scholar]
- 19.Ferguson B., et al. , Different genetic mechanisms mediate spontaneous versus UVR-induced malignant melanoma. Elife 8, e42424 (2019). [DOI] [PMC free article] [PubMed] [Google Scholar]
- 20.Wei G.-H., et al. , Genome-wide analysis of ETS-family DNA-binding in vitro and in vivo. EMBO J. 29, 2147–2160 (2010). [DOI] [PMC free article] [PubMed] [Google Scholar]
- 21.Sabarinathan R., Mularoni L., Deu-Pons J., Gonzalez-Perez A., López-Bigas N., Nucleotide excision repair is impaired by binding of transcription factors to DNA. Nature 532, 264–267 (2016). [DOI] [PubMed] [Google Scholar]
- 22.ENCODE Project Consortium, An integrated encyclopedia of DNA elements in the human genome. Nature 489, 57–74 (2012). [DOI] [PMC free article] [PubMed] [Google Scholar]
- 23.Sriramachandran A. M., et al. , Genome-wide nucleotide-resolution mapping of DNA replication patterns, single-strand breaks, and lesions by GLOE-seq. Mol. Cell 78, 975–985.e7 (2020). [DOI] [PMC free article] [PubMed] [Google Scholar]
- 24.Ding J., Taylor M. S., Jackson A. P., Reijns M. A. M., Genome-wide mapping of embedded ribonucleotides and other noncanonical nucleotides using emRiboSeq and EndoSeq. Nat. Protoc. 10, 1433–1444 (2015). [DOI] [PMC free article] [PubMed] [Google Scholar]
- 25.Sheng Q., et al. , A streamlined solution for processing, elucidating and quality control of cyclobutane pyrimidine dimer sequencing data. Nat. Protoc. 16, 2190–2212 (2021). [DOI] [PMC free article] [PubMed] [Google Scholar]
- 26.Ikehata H., Ono T., The mechanisms of UV mutagenesis. J. Radiat. Res. 52, 115–125 (2011). [DOI] [PubMed] [Google Scholar]
- 27.Mielko Z., et al. , UV irradiation remodels the specificity landscape of transcription factors. Proc. Natl. Acad. Sci. U.S.A. 120, e2217422120 (2023). [DOI] [PMC free article] [PubMed] [Google Scholar]
- 28.Crooks G. E., Hon G., Chandonia J.-M., Brenner S. E., WebLogo: A sequence logo generator. Genome Res. 14, 1188–1190 (2004). [DOI] [PMC free article] [PubMed] [Google Scholar]
- 29.Jin S.-G., Pettinga D., Johnson J., Li P., Pfeifer G. P., The major mechanism of melanoma mutations is based on deamination of cytosine in pyrimidine dimers as determined by circle damage sequencing. Sci. Adv. 7, eabi6508 (2021). [DOI] [PMC free article] [PubMed] [Google Scholar]
- 30.Cannistraro V. J., Taylor J.-S., Acceleration of 5-methylcytosine deamination in cyclobutane dimers by G and its implications for UV-induced C-to-T mutation hotspots. J. Mol. Biol. 392, 1145–1157 (2009). [DOI] [PMC free article] [PubMed] [Google Scholar]
- 31.Nabel C. S., Manning S. A., Kohli R. M., The curious chemical biology of cytosine: Deamination, methylation and oxidation as modulators of genomic potential. ACS Chem. Biol. 7, 20–30 (2012). [DOI] [PMC free article] [PubMed] [Google Scholar]
- 32.Song Q., Cannistraro V. J., Taylor J.-S., Rotational position of a 5-methylcytosine-containing cyclobutane pyrimidine dimer in a nucleosome greatly affects its deamination rate. J. Biol. Chem. 286, 6329–6335 (2011). [DOI] [PMC free article] [PubMed] [Google Scholar]
- 33.Song Q., Cannistraro V. J., Taylor J.-S., Synergistic modulation of cyclobutane pyrimidine dimer photoproduct formation and deamination at a TmCG site over a full helical DNA turn in a nucleosome core particle. Nucleic Acids Res. 42, 13122–13133 (2014). [DOI] [PMC free article] [PubMed] [Google Scholar]
- 34.Batchelor A. H., Piper D. E., de la Brousse F. C., McKnight S. L., Wolberger C., The structure of GABPalpha/beta: An ETS domain- ankyrin repeat heterodimer bound to DNA. Science 279, 1037–1041 (1998). [DOI] [PubMed] [Google Scholar]
- 35.Shen N., et al. , Divergence in DNA specificity among paralogous transcription factors contributes to their differential in vivo binding. Cell Syst. 6, 470–483.e8 (2018). [DOI] [PMC free article] [PubMed] [Google Scholar]
- 36.Orphanides G., Lagrange T., Reinberg D., The general transcription factors of RNA polymerase II. Genes Dev. 10, 2657–2683 (1996). [DOI] [PubMed] [Google Scholar]
- 37.Nikolov D. B., et al. , Crystal structure of a human TATA box-binding protein/TATA element complex. Proc. Natl. Acad. Sci. U.S.A. 93, 4862–4867 (1996). [DOI] [PMC free article] [PubMed] [Google Scholar]
- 38.Etheve L., Martin J., Lavery R., Protein–DNA interfaces: A molecular dynamics analysis of time-dependent recognition processes for three transcription factors. Nucleic Acids Res. 44, 9990–10002 (2016). [DOI] [PMC free article] [PubMed] [Google Scholar]
- 39.Adar S., Hu J., Lieb J. D., Sancar A., Genome-wide kinetics of DNA excision repair in relation to chromatin state and mutagenesis. Proc. Natl. Acad. Sci. U.S.A. 113, E2124–E2133 (2016). [DOI] [PMC free article] [PubMed] [Google Scholar]
- 40.Yoon J.-H., Prakash L., Prakash S., Highly error-free role of DNA polymerase eta in the replicative bypass of UV-induced pyrimidine dimers in mouse and human cells. Proc. Natl. Acad. Sci. U.S.A. 106, 18219–18224 (2009). [DOI] [PMC free article] [PubMed] [Google Scholar]
- 41.Yurchenko A. A., et al. , Genomic mutation landscape of skin cancers from DNA repair-deficient xeroderma pigmentosum patients. Nat. Commun. 14, 2561 (2023). [DOI] [PMC free article] [PubMed] [Google Scholar]
- 42.Johnson R. E., Prakash S., Prakash L., Efficient bypass of a thymine-thymine dimer by yeast DNA polymerase, Poleta. Science 283, 1001–1004 (1999). [DOI] [PubMed] [Google Scholar]
- 43.Johnson R. E., Washington M. T., Prakash S., Prakash L., Fidelity of human DNA polymerase eta. J. Biol. Chem. 275, 7447–7450 (2000). [DOI] [PubMed] [Google Scholar]
- 44.Quinlan A. R., Hall I. M., BEDTools: A flexible suite of utilities for comparing genomic features. Bioinformatics 26, 841–842 (2010). [DOI] [PMC free article] [PubMed] [Google Scholar]
- 45.Lake R. J., Geyko A., Hemashettar G., Zhao Y., Fan H.-Y., UV-induced association of the CSB remodeling protein with chromatin requires ATP-dependent relief of N-terminal autorepression. Mol. Cell 37, 235–246 (2010). [DOI] [PMC free article] [PubMed] [Google Scholar]
- 46.Bolger A. M., Lohse M., Usadel B., Trimmomatic: A flexible trimmer for Illumina sequence data. Bioinformatics 30, 2114–2120 (2014). [DOI] [PMC free article] [PubMed] [Google Scholar]
- 47.Langmead B., Salzberg S. L., Fast gapped-read alignment with Bowtie 2. Nat. Methods 9, 357–359 (2012). [DOI] [PMC free article] [PubMed] [Google Scholar]
- 48.Li H., et al. , The sequence alignment/map format and SAMtools. Bioinformatics 25, 2078–2079 (2009). [DOI] [PMC free article] [PubMed] [Google Scholar]
- 49.Jo S., Kim T., Iyer V. G., Im W., CHARMM-GUI: A web-based graphical user interface for CHARMM. J. Comput. Chem. 29, 1859–1865 (2008). [DOI] [PubMed] [Google Scholar]
- 50.Tian C., et al. , ff19SB: Amino-acid-specific protein backbone parameters trained against quantum mechanics energy surfaces in solution. J. Chem. Theory Comput. 16, 528–552 (2020). [DOI] [PubMed] [Google Scholar]
- 51.Lee J., et al. , CHARMM-GUI supports the Amber force fields. J. Chem. Phys. 153, 035103 (2020). [DOI] [PubMed] [Google Scholar]
- 52.Jorgensen W. L., Chandrasekhar J., Madura J. D., Impey R. W., Klein M. L., Comparison of simple potential functions for simulating liquid water. J. Chem. Phys. 79, 926–935 (1983). [Google Scholar]
- 53.Pettersen E. F., et al. , UCSF chimera–A visualization system for exploratory research and analysis. J. Comput. Chem. 25, 1605–1612 (2004). [DOI] [PubMed] [Google Scholar]
- 54.Berendsen H. J. C., van der Spoel D., van Drunen R., GROMACS: A message-passing parallel molecular dynamics implementation. Comput. Phys. Commun. 91, 43–56 (1995). [Google Scholar]
- 55.Hess B., P-LINCS: A parallel linear constraint solver for molecular simulation. J. Chem. Theory Comput. 4, 116–122 (2008). [DOI] [PubMed] [Google Scholar]
- 56.Parrinello M., Rahman A., Polymorphic transitions in single crystals: A new molecular dynamics method. J. Appl. Phys. 52, 7182–7190 (1981). [Google Scholar]
- 57.Darden T., York D., Pedersen L., Particle mesh Ewald: An N⋅log(N) method for Ewald sums in large systems. J. Chem. Phys. 98, 10089–10092 (1993). [Google Scholar]
- 58.Bauer P., Hess B., Lindahl E., GROMACS 2022 manual (2022), 10.5281/zenodo.6103568 (9 June 2023). [DOI]
- 59.Mao P., Duan M., Analysis of UV-induced DNA damage in human cells using CPD-seq 2.0. Gene Expression Omnibus. https://www.ncbi.nlm.nih.gov/geo/query/acc.cgi?acc=GSE235483. Deposited 21 June 2023.
Associated Data
This section collects any data citations, data availability statements, or supplementary materials included in this article.
Supplementary Materials
Appendix 01 (PDF)
Dataset S01 (XLSX)
Dataset S02 (XLSX)
Dataset S03 (XLSX)
Data Availability Statement
The CPD-seq 2.0 data have been deposited in the GEO database (accession number GSE235483) (59).