

Summary
MicroRNAs (miRNAs) typically direct degradation of their mRNA targets. However, some targets have unusual miRNA-binding sites that direct degradation of cognate miRNAs. Although this target-directed miRNA degradation (TDMD) is thought to shape the levels of numerous miRNAs, relatively few sites that endogenously direct degradation have been identified. Here, we identify six sites, five in mRNAs and one in a noncoding RNA named Marge, that serve this purpose in Drosophila cells or embryos. These six sites direct miRNA degradation without collateral target degradation, helping explain the potency of this miRNA-degradation pathway. Mutations that disrupt this pathway are lethal, with many flies dying as embryos. Concomitant derepression of miR-3 and its paralog miR-309 appears responsible for some of this lethality, whereas the loss of Marge-directed degradation of miR-310 miRNAs causes defects in embryonic cuticle development. Thus, TDMD is implicated in the viability of an animal and is required for its proper development.
eTOC
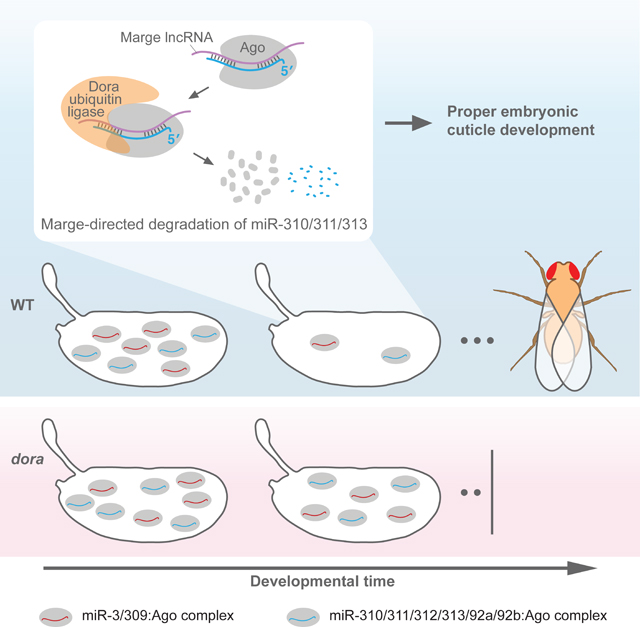
Kingston et al. identify six Drosophila RNAs that each direct degradation of specific microRNAs. One facilitates clearance of the miR-310 microRNAs in the embryo, thereby promoting proper embryonic development. This mechanism for shaping microRNA levels appears widespread, with evidence that targeted degradation of the miR-3 microRNAs is required for viability.
Graphical Abstract
Introduction
MicroRNAs (miRNAs) are ~22-nt RNAs that associate with an Argonaute (Ago) effector protein to form a complex that represses gene expression. Within this miRNA–Ago complex, the miRNA recognizes sites in mRNAs—typically through pairing between its seed region (miRNA nucleotides 2–8) and a complementary site within the mRNA 3′ UTR. Meanwhile, Ago recruits factors that repress the targeted mRNA, primarily by accelerating its deadenylation (Bartel, 2018). In flies and mice, loss of an individual miRNA (or of several members of the same miRNA family) typically leads to developmental abnormalities or other defects, which are often severe, affecting viability, fertility, or other critical functions (Chen et al., 2014; Bartel, 2018).
In some special cases, a target site within either an mRNA or a noncoding RNA (ncRNA) can trigger degradation of the miRNA, inverting the typical regulatory logic (Ameres et al., 2010; Cazalla et al., 2010; Baccarini et al., 2011; Libri et al., 2012; Marcinowski et al., 2012; Xie et al., 2012; Lee et al., 2013; de la Mata et al., 2015; Bitetti et al., 2018; Ghini et al., 2018; Kleaveland et al., 2018; Sheu-Gruttadauria et al., 2019). This target-directed miRNA degradation (TDMD) typically requires pairing to not only the miRNA seed region, but also extensive pairing to the miRNA 3′ region (Ameres et al., 2010; Cazalla et al., 2010; Baccarini et al., 2011; Libri et al., 2012; Marcinowski et al., 2012; Xie et al., 2012; Lee et al., 2013; de la Mata et al., 2015; Bartel, 2018; Bitetti et al., 2018; Ghini et al., 2018; Kleaveland et al., 2018; Sheu-Gruttadauria et al., 2019). This additional pairing is thought to induce conformational changes that recruit the ZSWIM8 Cullin-RING E3 ubiquitin ligase complex, leading to poly-ubiquitination and proteasomal degradation of Ago, and subsequent degradation of the miRNA (Han et al., 2020; Shi et al., 2020). In mammalian cells, each of the four Ago paralogs are vulnerable to this degradation (Shi et al., 2020), whereas in Drosophila cells, Ago1, the paralog primarily loaded with miRNAs, is vulnerable, whereas Ago2, the paralog primarily loaded with endogenous small-interfering RNAs (siRNAs), is resistant (Kingston and Bartel, 2021).
Triggers of TDMD with important biological functions were first discovered in herpesviruses, which express transcripts that direct degradation of host miRNAs that would otherwise impede their replication (Cazalla et al., 2010; Libri et al., 2012; Marcinowski et al., 2012). More recently, sites within four mammalian transcripts were found to direct degradation of miR-29b, miR-7, miR-30b/c, and miR-221/222, which showed that TDMD triggered by endogenous transcripts helps to shape normal miRNA levels of vertebrate animals (Bitetti et al., 2018; Ghini et al., 2018; Kleaveland et al., 2018; Li et al., 2021). Indeed, a site within the NREP mRNA, which directs degradation of miR-29b, is required for normal mouse behavior, and an orthologous site plays an analogous role in zebrafish (Bitetti et al., 2018).
The four established examples of endogenous TDMD are thought to represent only a small fraction of the TDMD naturally occurring in animals. Supporting this idea, levels of 30 additional miRNAs increase after perturbing ZSWIM8 in mammalian cell lines, implying that the endogenous TDMD pathway also shapes the levels of these 30 miRNAs (Shi et al., 2020). Indeed, TDMD quantitatively explains the short half-lives of most short-lived miRNAs (Shi et al., 2020). Likewise, levels of 10 miRNAs increase after loss of the ZSWIM8 ortholog in Drosophila S2 cells, and levels of another 10 increase upon loss of the ZSWIM8 ortholog in Caenorhabditis elegans adults, implicating these miRNAs as TDMD substrates in each of these invertebrate species (Shi et al., 2020). Each of these putative TDMD substrates presumably pairs with at least one endogenously expressed, highly complementary target capable of triggering TDMD. However, no trigger has been reported for any of the recently inferred TDMD substrates.
The TDMD pathway might be essential in some animals. Although null mutations in ebax-1, the ZSWIM8 ortholog of C. elegans, are viable, point substitutions within Dora, the ortholog of D. melanogaster, appear lethal (Wang et al., 2013; Yamamoto et al., 2014), implying that in flies this ubiquitin-ligase receptor has an essential function, which might be either its role in TDMD or its recognition of other substrates. Indeed, recognition of other substrates by Dora orthologs is proposed to promote proper axon guidance in C. elegans and repress myogenesis in mammalian cell culture (Wang et al., 2013; Okumura et al., 2021). Here, we analyze dora mutants and newly identified TDMD substrates and triggers. We find that TDMD is required for proper development of an animal and implicated in its viability.
Results
Loss of Dora Causes Embryonic Lethality
To gain insight into how loss of TDMD might impact organismal fitness, we analyzed pre-existing D. melanogaster lines with dora mutations. Two dora lines were available—both from a screen for lethal mutations on the X chromosome. One, henceforth called dora[A], had a nonsense mutation at amino acid 946, whereas the other, called dora[B], had a missense mutation that changed Thr 295 to Met (Figure 1A) (Yamamoto et al., 2014; Haelterman et al., 2014). Although both alleles are reported to be lethal, no information is provided regarding the stage of lethality. To determine whether these mutants die during embryogenesis, we quantified the percent of hatched embryos from crosses between heterozygous females and wild-type males. (Note that because loss of Dora is lethal and the gene lies on the X chromosome, healthy adult males hemizygous for dora could not be obtained). Compared to control crosses, both dora crosses yielded a collection of embryos with significantly decreased hatching frequencies (Figure 1B). Approximately one quarter of the embryos from these dora crosses were expected to be hemizygous for the dora allele, and indeed for the dora[A] cross, 19% of the embryos failed to hatch, which implied that for most embryos, loss of dora was lethal. Genotypes of L1 larvae from embryos that did hatch from this cross confirmed the lethality; in contrast to equal numbers of hemizygous-mutant (dora[A]/Y) and heterozygous (dora[A]/+) individuals predicted from Mendelian ratios, we observed far fewer hemizygous larvae than heterozygous larvae (Figure 1C, 6 hemizygotes, 33 heterozygotes), indicating that most hemizygous mutants died as embryos or early L1 larvae. Nonetheless, this early lethality of dora[A] hemizygous individuals was not fully penetrant. Indeed, in our dora[A] fly stock, we have observed a few apparently fully developed dora[A] hemizygous males that perished partially eclosed from their pupal case, which indicates that dora[A] larvae can occasionally survive through the end of pupal development.
Figure 1. Embryonic Lethality and Dysregulation of miRNAs Upon Loss of dora, See also Figures S1, S2, and S3, and Tables S1A and S2.

(A) Schematic of the Dora protein, showing regions of predicted disorder in light grey and plotting relative amino acid conservation below (Berezin et al., 2004). Also indicated are locations of the BC and Cullin boxes, which are predicted to interact with other components of the E3 ligase (Wang et al., 2013), and locations of the SWIM domain and the two mutations used in this study.
(B) Hatching frequencies of embryos from crosses with either wild-type (WT) or dora heterozygous mothers (black and grey, respectively). Wild-type mothers, dora heterozygous mothers, and wild-type fathers had genotypes of WT/bal, dora/bal, and bal/Y, respectively, where ‘bal’ indicates the FM7c balancer, which is an engineered X chromosome that suppresses recombination, is recessive sterile, and contains a dominant phenotypic marker. Error bars indicate standard error (n = 3 sets of 300 embryos for each genotype; significance evaluated with a t-test).
(C) Genotypes of early L1 larvae produced from crosses with dora heterozygous mothers, as in (B). Numbers quantify larvae from either the dora[A] or dora[B] cross that genotyped as either wild-type (bal/bal females or bal/Y males), heterozygous (dora/bal females), or mutant (dora/Y males) for Dora.
(D) Changes in miRNA levels observed in 8–12 h dora[A] embryos compared to wild-type embryos, as determined by sRNA-seq. Each point shows the mean from two biological replicates, with red indicating miRNAs with statistically significant fold changes observed between mutant and wild-type embryos (FDR <0.01), blue indicating passenger strands of significantly up-regulated miRNAs, and magenta indicating an outlier not considered when calling Dora-sensitive miRNAs.
(E and F) As in (D) but for 12–16 h and 16–20 h embryos, respectively.
(G) Levels of miRNAs from the mir-3 primary transcript (schematic below) in wild-type (left) and dora[A] (right) embryos at 8–12 and 12–16 h. Points indicate values for each replicate, after normalizing to quantitative internal standards, and lines connect replicate averages.
(H) As in (G), but for miRNAs from the mir-310 and mir-92 primary transcripts.
Surprisingly, for the dora[B] cross, almost 50% of embryos failed to hatch (Figure 1B), suggesting that the dora[B] allele is more severe than the dora[A] allele and somewhat detrimental even in the presence of a wild-type allele. Confirming the more severe phenotype, no dora[B] hemizygotes were observed among larvae of hatched embryos (Figure 1C, 0 hemizygotes, 25 heterozygotes), and no dora[B] hemizygous males were found to survive to the end of pupal development.
With early lethality of all dora[B] hemizygotes able to explain only a 25% reduction in hatching, we investigated the cause of the remaining reduction and found that it was attributable to synthetic lethality between maternal dora[B] and the FM7c balancer chromosome (Figure S1A). Likewise, synthetic lethality with the FM7c balancer explained why wild-type larvae (i.e., embryos containing the balancer) were of similar abundance to larvae heterozygous for dora[A] or dora[B], in contrast to the 2:1 Mendelian expectation (Figure 1C and Figure S1B). Moreover, both dora[A] and dora[B] hemizygotes were largely rescued by a ~100 kb duplication spanning Dora (Figure S1C), further indicating that the detrimental effects of dora mutations in the presence of a wild-type allele do not manifest in all backgrounds. Importantly, even in the absence of the FM7c balancer, dora[B] hemizygous larvae were not observed (Figure S1B), which indicated that early lethality of the dora[B] allele was highly penetrant, regardless of genetic background.
To further investigate differences between the dora alleles, we carried out rescue experiments with wild-type and mutant alleles (Figure S1D–F). Expressing wild-type Dora in S2 cells mutant for Dora imparted detectable rescue of Dora activity, as assessed by reduced levels of miR-7 (a Dora-sensitive miRNA), whereas expressing either dora[A] or dora[B] did not, as expected if neither dora allele retained activity (Figure S1D–F). Moreover, expressing dora[B] in wild-type cells increased accumulation of miR-7, whereas expressing either wild-type Dora or dora[A] did not (Figure S1D–F), which supported the idea that in certain contexts dora[B] can detrimentally affect the function of wild-type Dora.
Loss of Dora Causes Increased Levels of miR-3 and miR-310 Family Members.
The requirement for Dora might have been due to either its role in TDMD or its ability to promote ubiquitination of substrates other than Ago1, or both. To explore the TDMD possibility, we looked for dysregulation of miRNAs upon loss of Dora in developing embryos, assessing miRNA levels across three embryonic time intervals. To enrich for embryos with the dora genotype, we crossed dora heterozygous females to males carrying an X chromosome balancer expressing red fluorescent protein (RFP) under the sqh promoter, and then collected non-RFP embryos (Figure S2A). These embryos, expected to be half dora hemizygous males and half wild-type males, were compared to a pool of wild-type males collected as non-RFP embryos from a cross of wild-type females with the sqh::RFP balancer-carrying male. Although we refer to the former pool of embryos as “mutant”, they were diluted ~2-fold by wild-type embryos, leading to a corresponding dilution of any signal of dysregulation. Additionally, because our enrichment strategy relied on detectable zygotic expression of sqh::RFP, the earliest embryonic time interval started 8 h after egg laying.
We collected 8–12, 12–16, and 16–20 h embryos from each of the crosses and performed small-RNA sequencing (sRNA-seq) to look for differences in miRNA levels. After discarding a few embryos that were obviously mis-formed, wild-type and dora[A] embryos were at similar developmental stages at each time interval (Figure S2B). However, because almost half of the dora[B] embryos were noticeably mis-formed (Figure S2C), mis-formed dora[B] embryos were not discarded, and our analyses focused primarily on comparison of wild-type and dora[A] embryos.
Levels of 11 miRNAs significantly increased upon loss of Dora, suggesting that these 11 miRNAs are substrates of TDMD during embryonic development (Figure 1D–F; Table S1A). None of these 11 were among the 10 miRNAs previously identified as Dora-sensitive in S2 cells (Shi et al., 2020). The Dora-sensitive miRNAs found in embryos were primarily from two miRNA families (with each family expected to have common targeting properties based on their common seed region): the miR-3/309/318 family (hereafter called the miR-3 family), and the miR-310/311/312/313/92a/92b family (hereafter called the miR-310 family). The genes for miR-3 and miR-309 are clustered in the genome together with genes for six other miRNAs, implying that all eight miRNAs are expressed from a single primary transcript (Figure 1G). The gene for miR-318 is on a different chromosome and not expressed until adulthood. The genes for the miR-310 family fall in two genomic clusters, implying two primary transcripts, one including miR-310, 311, 312, and 313, and the other including miR-92a and b (Figure 1H).
To investigate whether the observed upregulation of select miRNAs was caused by decreased miRNA decay upon loss of Dora, as would be expected from disruption of the TDMD pathway, and not due to increased miRNA production, we assessed the extent to which passenger-strand partners of these significantly upregulated guide strands were upregulated as well. For all Dora-sensitive miRNAs except for miR-313, guide strands were much more upregulated than their corresponding passenger strands, suggesting that decay rates, and not production rates, were altered in dora embryos (Figure S2D). For miR-313, both strands were similarly upregulated. However, passenger strands of other miRNAs co-expressed with miR-313 as part of the mir-310 cluster were not noticeably upregulated, which indicated that miR-313 was not transcriptionally upregulated and suggested that both miR-313 and its passenger strand (miR-313–5p) were stabilized upon loss of Dora.
To further investigate the idea that decay rates for these Dora-sensitive miRNAs might have been altered, we compared rates at which levels of miRNAs from the mir-3 cluster decreased as embryos progressed from 8–12 to 12–16 h. The mir-3 cluster has six different miRNAs processed from eight different hairpins (Figure 1G), only two of which (miR-3 and miR-309) were sensitive to dora loss (Figure 1D–F). In wild-type embryos, miR-3 and miR-309 decreased more rapidly than did other cluster members, whereas in dora embryos, these two miRNAs decreased at rates resembling those of the other cluster members, as expected if Dora specifically increased their decay rates (Figure 1G). Likewise, members of the miR-310 family, which were each Dora-sensitive (Figure 1E–F), decreased more rapidly in wild-type embryos than in dora embryos (Figure 1H). Thus, loss of Dora led to upregulation of 11 miRNAs during embryonic development, apparently by decreasing their decay rates.
Similar trends were observed upon analyzing dora[B] embryos (Figure S2D–I; Table S1A). Although miRNA dysregulation observed in dora[B] samples was more severe than that observed in dora[A] samples (Figure S2J), passenger strands for some miRNAs (in particular, those of the mir-310 cluster) were also noticeably upregulated (Figure S2D–G), suggesting that altered transcription also impacted fold-changes observed in dora[B] samples.
We next assessed the extent to which the observed dysregulation of miRNAs altered gene expression in dora embryos. Analysis of RNA-seq libraries from dora[A] embryos revealed that levels of nearly all mRNAs changed less than 2-fold upon loss of Dora (Figure S3A–C; Table S2), a result expected for mRNAs destabilized due to derepressed miRNAs, because half the embryos in the dora samples were wild-type. Additional changes not attributable to derepressed miRNAs were also observed, particularly in the dora[B] samples, with strong upregulation of many genes that were normally lowly expressed (Figure S3D–F; Table S2). Further analyses attributed the pronounced dysregulation observed in dora[B] embryos to the large fraction of embryos stalled at early developmental stages (Figure S3G–J; Table S1B). Perhaps in part because of the diluted signal for down-regulated species, and perhaps because TDMD of the miR-3 family might have occurred in only a small fraction of the embryonic cells, we did not observe significantly reduced levels of predicted targets of the miR-3 family in either dora[A] or dora[B] embryos (Figure S3K–L). Nonetheless, we did observe significantly reduced levels of predicted targets for the miR-310 family in both dora embryos (Figure S3A–F).
Endogenous Transcripts Direct miRNA Degradation in Drosophila
With evidence that Dora is required for embryonic viability and the identification of upwards of 60 miRNAs in mammals, flies, and worms stabilized upon loss of Dora, or its orthologs (Figure 1) (Han et al., 2020; Shi et al., 2020), further understanding of endogenous TDMD was primarily limited by the paucity of sites reported to trigger this phenomenon—only four, each operating only in vertebrate species (Bitetti et al., 2018; Ghini et al., 2018; Kleaveland et al., 2018; Li et al., 2021). Identifying trigger sites for Dora-sensitive miRNAs in Drosophila would enable these miRNAs to be validated as TDMD substrates and enable more informative, miRNA-specific perturbation of the pathway.
Pairing architectures of known TDMD triggers typically feature pairing to the miRNA seed, a central unpaired loop, and extensive pairing to the miRNA 3′ region, often extending to the final few nucleotides of the miRNA (Ameres et al., 2010; Cazalla et al., 2010; Baccarini et al., 2011; Libri et al., 2012; Marcinowski et al., 2012; Xie et al., 2012; Lee et al., 2013; de la Mata et al., 2015; Bitetti et al., 2018; Ghini et al., 2018; Kleaveland et al., 2018; Sheu-Gruttadauria et al., 2019). Based on these features, we designed a computational pipeline to identify and rank candidate trigger sites and applied this pipeline to mRNA 3′ UTRs and long ncRNAs (lncRNAs), collecting the top 50 candidates for each Dora-sensitive miRNA and filtering them further for evolutionary conservation and promising pairing architectures.
We piloted this pipeline in S2 cells, where 10 Dora-sensitive miRNAs have been identified (Shi et al., 2020). Eleven candidates were selected for validation (Figure 2A; Figure S4A; Table S3). These 11 were the top one or two candidates for each of nine Dora-sensitive miRNAs, and although the pipeline also considered lncRNAs, each of these 11 resided in the 3′ UTR of an mRNA. For each selected candidate, Cas9 was used to introduce DNA changes that disrupted pairing to the miRNA, with the expectation that disrupting a site that directed miRNA degradation would cause the level of a cognate miRNA to increase, with minimal changes to levels of other miRNAs.
Figure 2. Transcripts that Direct miRNA Degradation in Drosophila Cells, See also Figure S4 and Table S3.
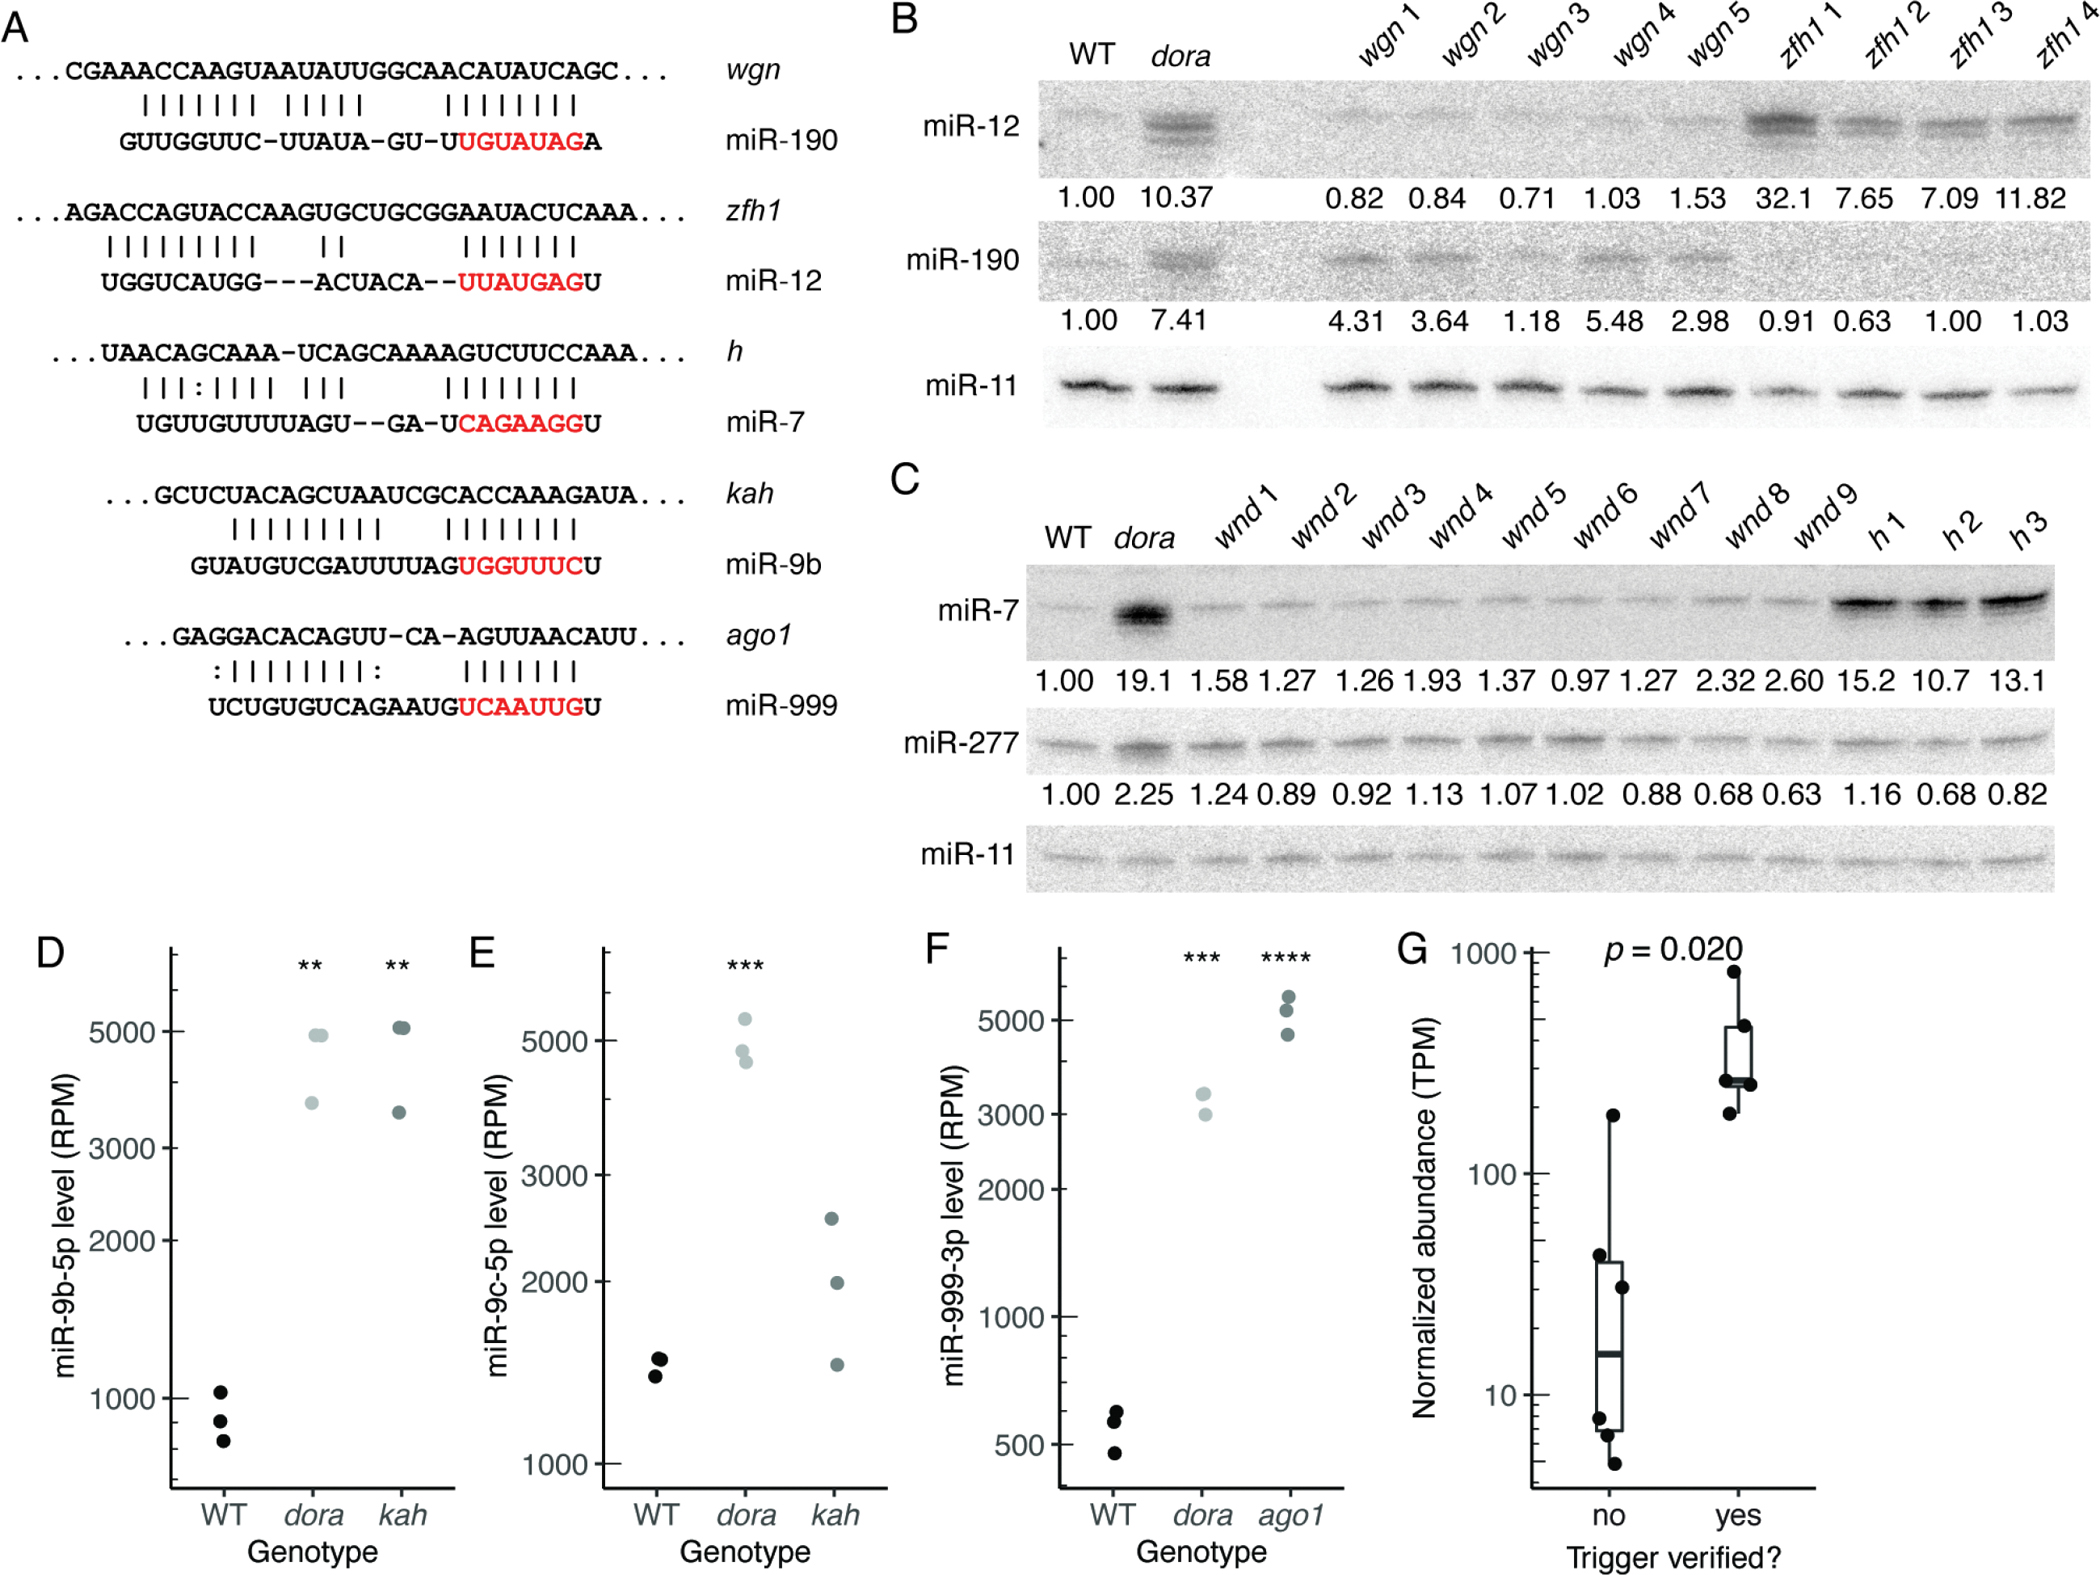
(A) Pairing diagrams for trigger sites validated in S2 cells. For each site, the trigger sequence is on top (oriented 5′ to 3′), and the miRNA sequence is on the bottom (seed region in red). Vertical lines indicate Watson–Crick pairs, dots indicate G–U wobbles.
(B and C) Northern blots probing for miR-12, miR-190, miR-7, and miR-277 following disruption of candidate trigger sites in wgn, zfh1, wnd, and h, respectively. Each RNA sample was from an independently derived clonal cell line (Table S3). Blots were also probed for miR-11, for use as a loading standard. For Dora-sensitive miRNAs, numbers below each band show miRNA levels relative to those in wild-type cells, after normalization to the loading standard.
(D) Quantification of miR-9b levels, in wild-type, dora, and kah S2 cells, as determined by sRNA-seq (RPM, reads per million mapped to miRNAs). Each point represents results from a unique clonal cell line (Table S3). Significance is relative to wild-type samples, and was evaluated by ANOVA and the Tukey test (**, p < 0.01).
(E) As in (D) but for miR-9c levels (***, p < 0.001).
(F) As in (D) but for miR-999–3p in wild-type, dora, or ago1 S2 cells (***, p < 0.001; ****: p < 0.0001).
(G) Distributions of transcript abundance (TPM, transcripts per million) for candidate triggers that either validated or failed to validate in S2 cells. Box-and-whisker plots show median, quartiles, and a range extending at most 1.5 times the inter-quartile range out from each hinge of average abundances, as measured by RNA-seq in wild-type S2 cells (n = 3). Significance was evaluated using a t-test, with Bonferroni adjustment to account for the seven other hypotheses that were considered.
Of the 11 sites that were disrupted, five were validated as TDMD-triggering sites (Figures 2A–F; Figures S4B and S4C). These five included a site for miR-12 in zfh1, a site for miR-190 in wgn, and a site for miR-7 in h, each validated using Northern blots (Figures 2B and 2C), and a site for miR-9b in kah and a site for miR-999 in ago1, each validated using sRNA-seq because miR-9b and miR-999 were difficult to detect in S2 cells using Northern blots (Figures 2D–F). For four out of these sites, disruption led to stabilization of the corresponding miRNA to a degree resembling that observed upon loss of Dora, suggesting that these were the primary triggers for these miRNAs in S2 cells. However, disruption of the site in wengen stabilized miR-190 only partially, implying at least one additional trigger for this miRNA in S2 cells.
Identification of these TDMD triggers confirmed that endogenous TDMD shapes miRNA levels in invertebrate cells and validated their cognate miRNAs as TDMD substrates. These results also included some intriguing observations. For example, the observation that ago1 mRNA has a TDMD-trigger site linked loading of miR-999 into Ago1 to enhanced decay of the miR-999–Ago1 complex. Another puzzling observation was that although miR-9b and miR-9c each had similar complementarity to the same site in the kahuli 3′ UTR (Figure 2A; Figure S4A), only miR-9b seemed to be sensitive to disruption of this site (Figure 2D–E). These oddities emphasize that although we have substantially increased the number of known endogenous TDMD triggers, much remains to be learned about why certain RNAs have evolved to be triggers and what licenses a site to trigger TDMD.
To explore why some candidate sites validated whereas others did not, we assessed a variety of features for each miRNA-trigger pair, including pairing architecture, predicted pairing energy, and trigger abundance, and found that only trigger abundance significantly differed between validated and non-validated candidates (Figure 2G). Stratification was also observed when examining the ratio of site:miRNA abundances, although with no improvement over that observed with trigger abundance alone (Figure S4D).
TDMD Appears to Dominate over miRNA-Directed Target Degradation
To examine the degree to which targeted degradation of specific miRNAs can alter repression of their respective targets, we quantified changes in levels of predicted targets for each miRNA upon perturbation of its trigger. Increased repression was observed only for predicted targets of miR-190, and even in this case the results did not achieve statistical significance (p = 0.094) (Figure 3A; Figure S4E–I). Thus, although disruption of each trigger site caused upregulation of the cognate miRNA, the upregulation was not great enough to mediate widespread changes in gene expression in S2 cells, presumably due to the relatively low expression of each miRNA in wild-type cells.
Figure 3. Dominance of TDMD over miRNA-Directed Target Degradation, See also Figure S4 and Table S3.
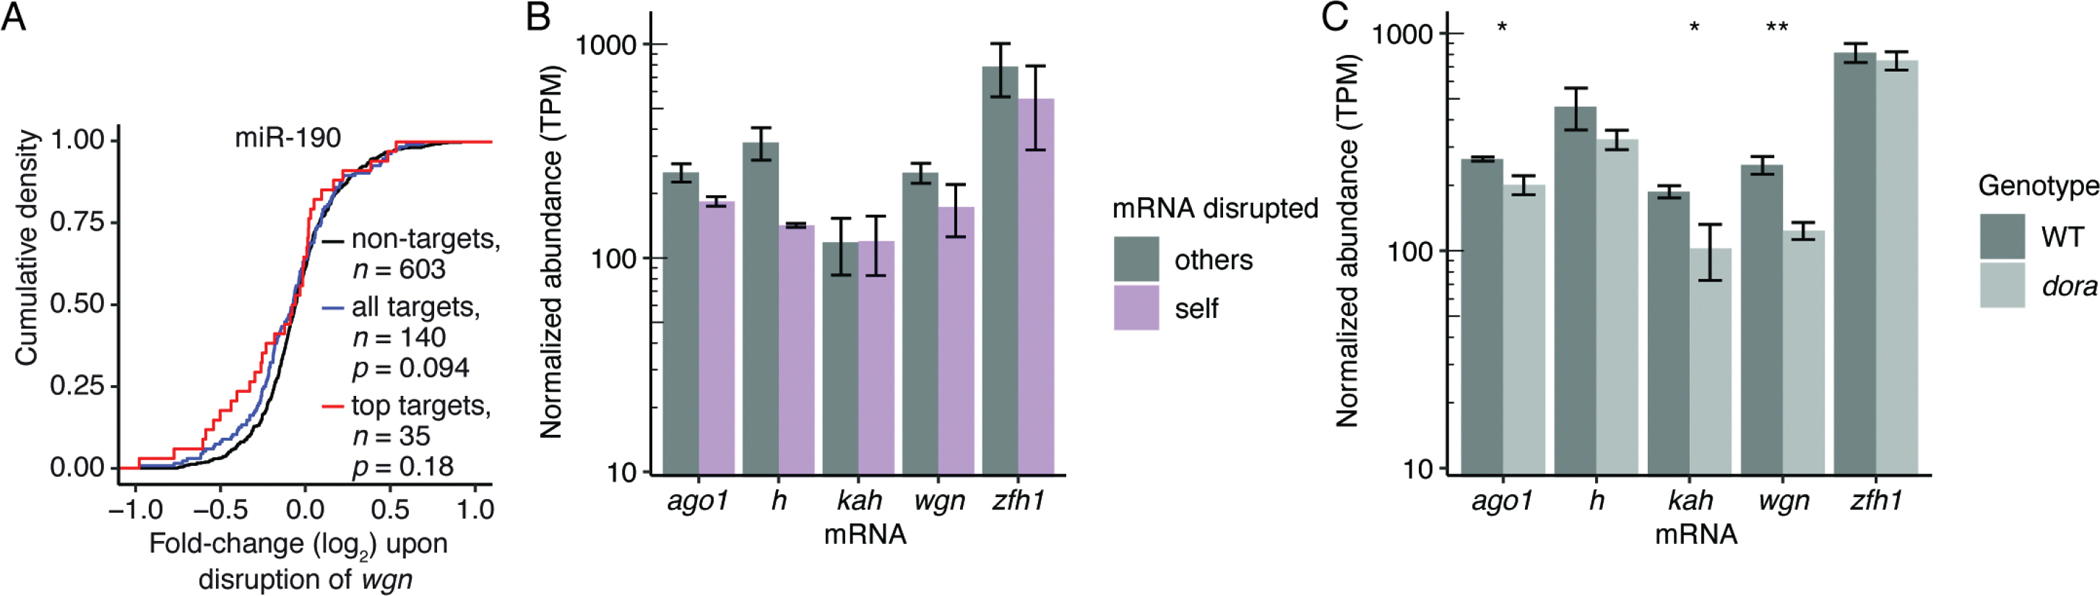
(A) Changes in mRNA levels observed after derepressing miR-190 in S2 cells. Shown are cumulative distributions of mean fold-changes observed for predicted targets (blue), top predicted targets (red), and a representative cohort of mRNAs not predicted to be targets but with a distribution of 3′ UTR lengths matching that of the predicted targets. Each genotype was represented by two independent clonal lines (Table S3). Significance was evaluated using the Kolmogorov-Smirnov test.
(B) Levels of TDMD-triggering mRNAs after disrupting trigger sites. Plotted for each mRNA are mean abundancies (TPM) observed by RNA-seq after disrupting the site in that mRNA (self, purple) and after disrupting the site in one of the other four mRNAs (others, grey). Error bars show standard deviation of values from either two (self) or eight (others) independently derived clonal cell lines (Table S3).
(C) Levels of TDMD-triggering mRNAs with and without Dora (WT and dora, respectively), as measured by RNA-seq. Error bars show standard deviation for TPM values from three independently derived clonal cell lines (Table S3). Significance of decreases observed upon loss of Dora were evaluated with a t-test (**, p < 0.01; *, p < 0.05).
We next examined the extent to which the miRNA-mediated repression and TDMD pathways are mutually exclusive, asking whether transcripts that trigger TDMD were also susceptible to miRNA-mediated degradation. For each of the five mRNAs that trigger TDMD, we assessed how abundance of the mRNA changed upon disruption of the site that normally directs miRNA degradation. If miRNA binding to these sites promotes target degradation, in addition to promoting miRNA degradation, then levels of the host mRNA would be expected to increase upon site disruption. However, no such increase was observed for any of the validated TDMD triggers (Figure 3B). Similar results have been observed when disrupting the site within Cyrano that directs miR-7 degradation in mammalian cells (Kleaveland et al., 2018). Thus, targets capable of triggering TDMD are typically not subject to miRNA-mediated degradation through the TDMD-triggering site.
One explanation for these findings is that the TDMD pathway outcompetes the miRNA-mediated repression pathway, in which case, disrupting TDMD might enable sites that normally trigger TDMD to instead promote miRNA-mediated repression. To investigate this idea, we compared trigger levels in wild-type and dora cells, and found that loss of Dora led to significantly decreased abundance of three of the five trigger mRNAs (Figure 3C), with the degree of decrease within the range observed for the most strongly repressed predicted targets (Figure S4J). To test the notion that decreased trigger abundance observed upon loss of Dora was indeed due to miRNA-mediated repression, we repeated these analyses following depletion of Ago1 (Figure S4K). In control samples in which Ago1 was not depleted, we again observed significantly decreased levels of wgn upon loss of Dora, but when Ago1 was depleted, loss of Dora led to no detectable change in wgn abundance (Figure S4K). These findings supported the model whereby the miRNA-mediated repression pathway was responsible for decreased levels of triggers observed upon loss of Dora. Although the increases in miRNA levels that occur upon TDMD disruption might have accentuated differences observed between wild-type and dora cells, these results supported the notion that in the absence of TDMD, sites that would otherwise direct degradation of the miRNA can instead direct miRNA-mediated degradation of the mRNA. Experiments perturbing an extensively paired site of endogenous siRNAs indicated that sites capable of undergoing slicing failed to efficiently direct degradation of Ago1-associated siRNAs, perhaps due to destruction of the site before Ago1 polyubiquitination could ensue (Figure S4L).
lncRNA-Directed Degradation of the miR-310 Family Is Required for Proper Cuticle Development
Having successfully predicted TDMD triggers in S2 cells, we used our pipeline to predict triggers for miRNAs that were Dora-sensitive in embryos. The CR43432 lncRNA was predicted as a trigger for the miR-310 family. Its complementary site was conserved among most Drosophila species in the 124-insect whole-genome alignment (UCSC genome browser), although as with the miRNAs of the miR-310 cluster, this lncRNA did not appear conserved beyond the Drosophila genus. In addition to matching the seed common to the six miRNAs of the family, this complementary site had potential to pair, in two alternative registers, to the 3′ region of each family member (Figure 4A). Using Cas9, we perturbed this site in flies, obtaining two lines that each abolished pairing to at least the seed (Table S3). Both lines were homozygous viable, with no significantly increased embryonic lethality as compared to wild-type controls (Figure S5A).
Figure 4. CR43432-Directed Degradation of the miR-310 Family and its Requirement for Proper Embryonic Cuticle Development, See also Figure S5 and Table S1C.
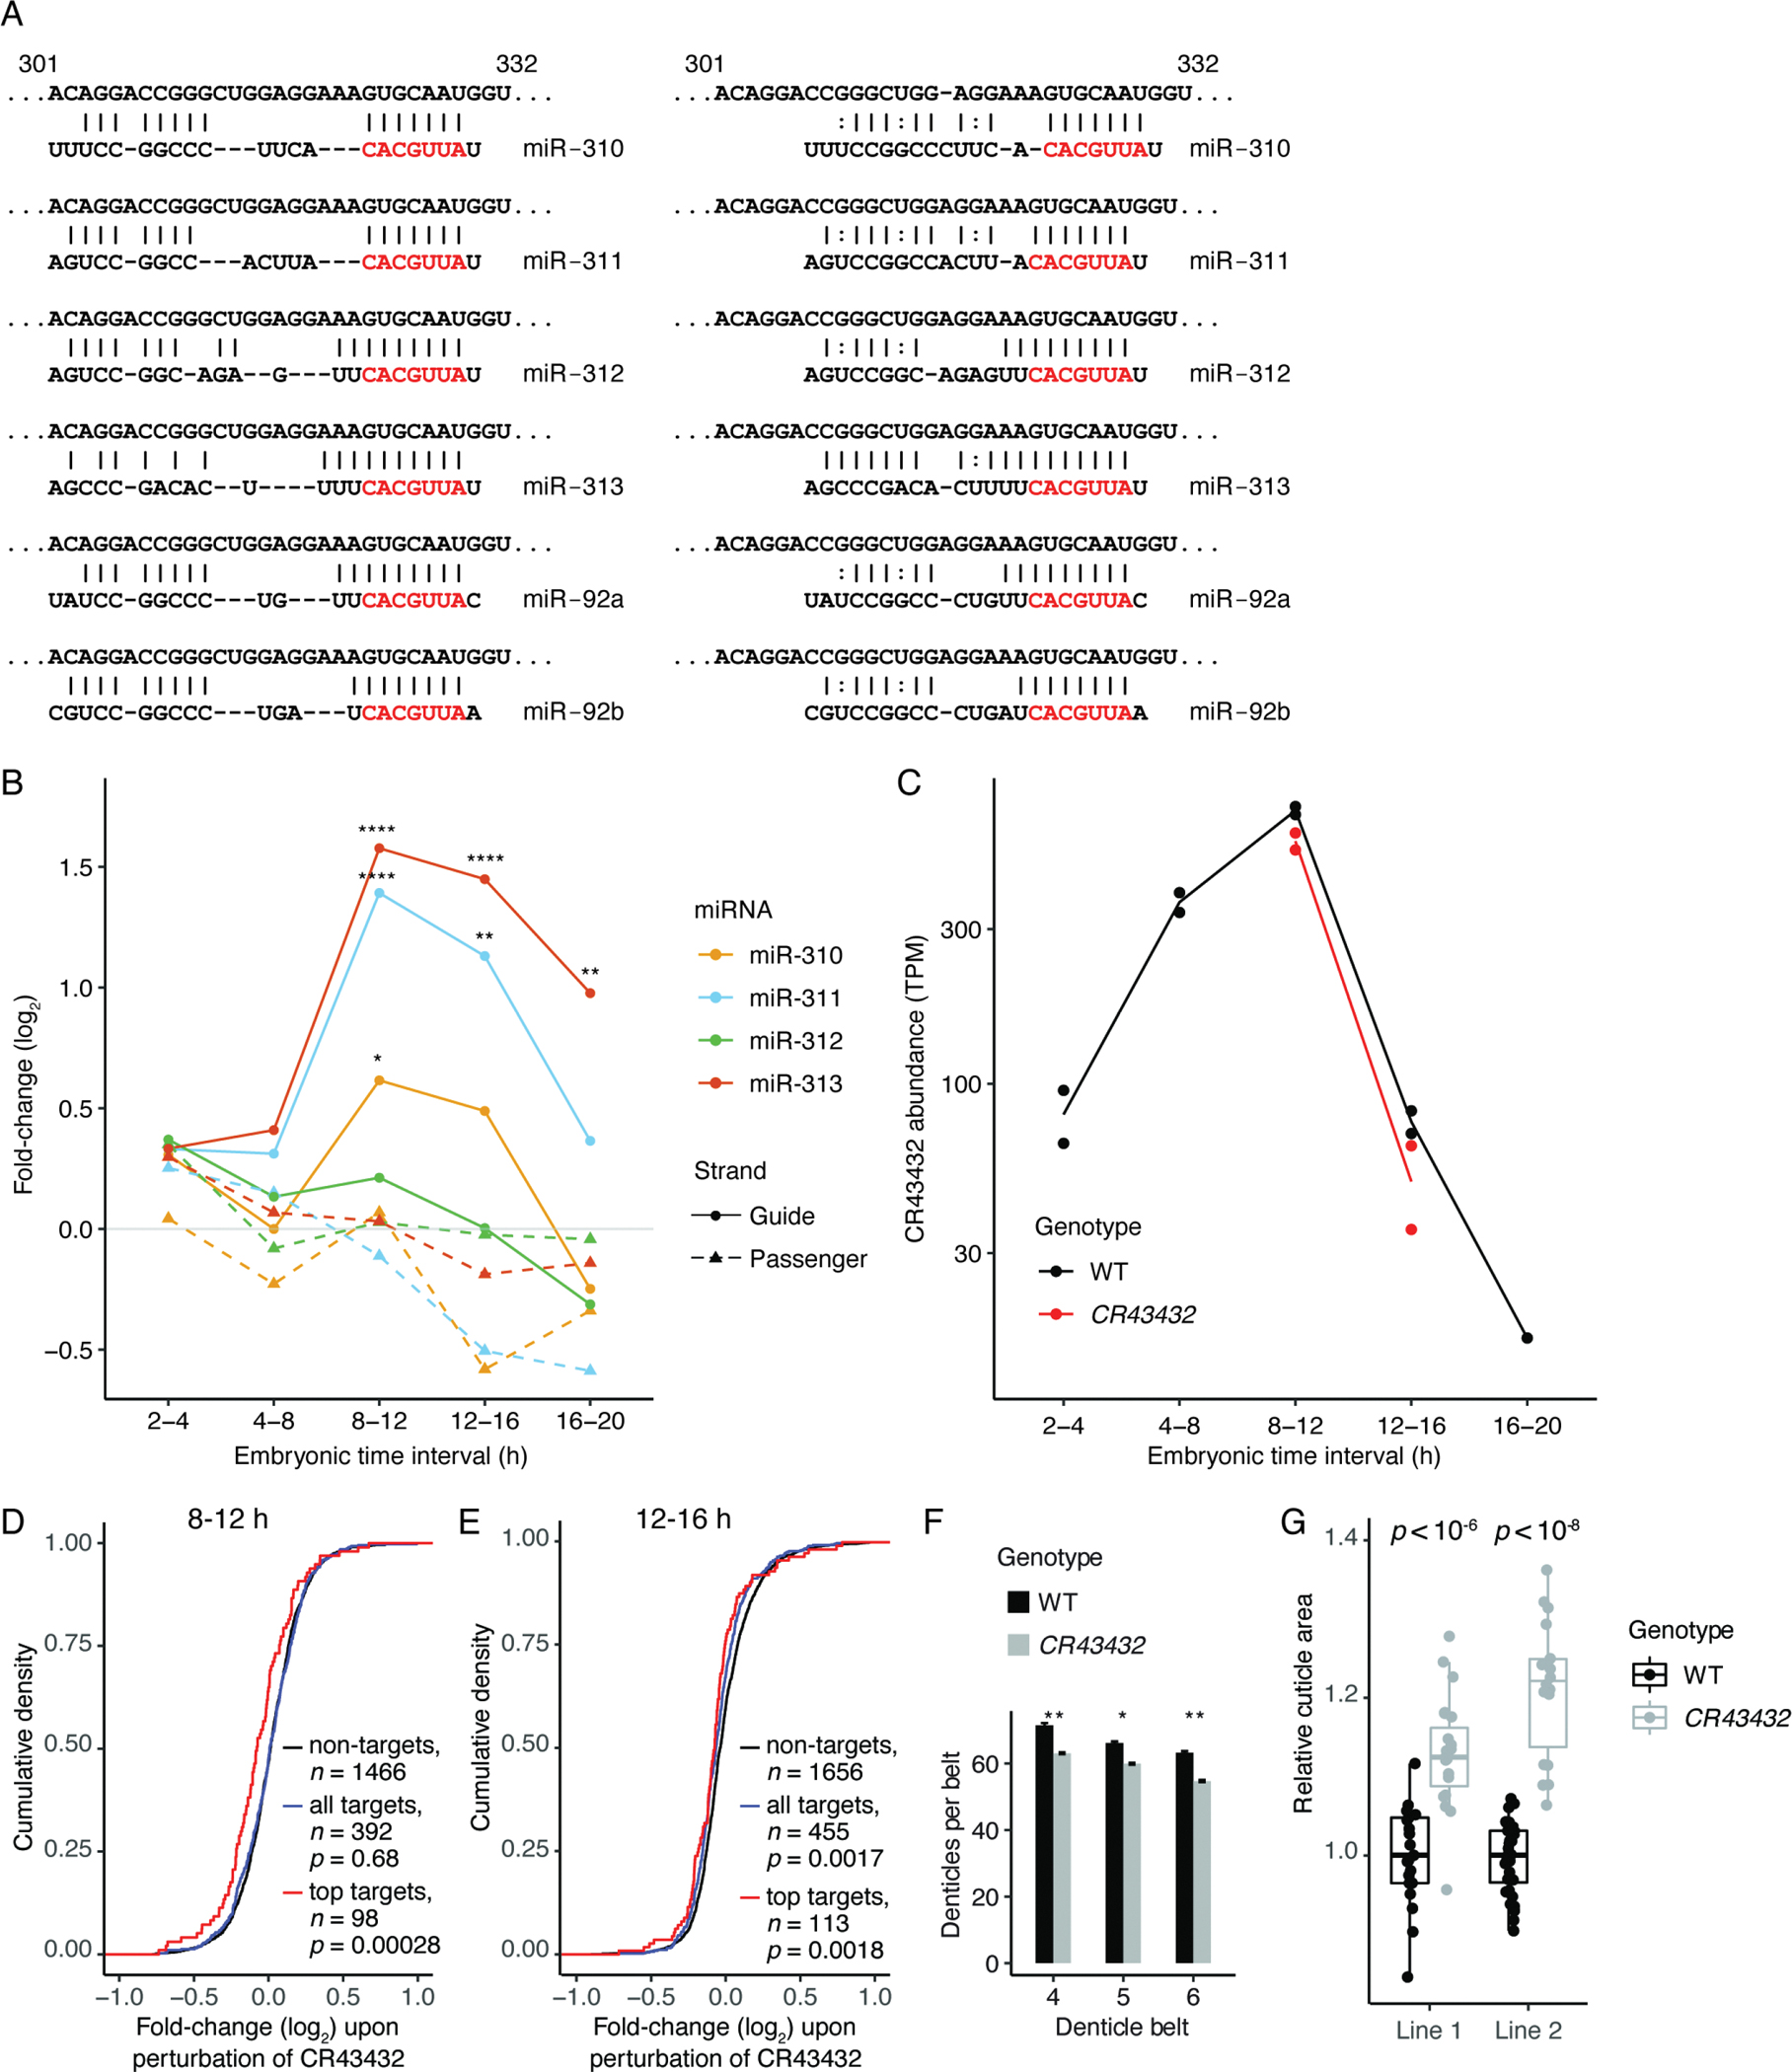
(A) Potential pairing between CR43432 (nucleotides 301 to 332 of the lncRNA) and each of the miR-310 family members, shown in the style of Figure 2A. Potential pairing to the miRNA 3′ regions occurred in two registers, one with a larger central loop bridging seed and 3′ pairing (left) and one with a smaller central loop (right).
(B) Changes in levels of miRNAs from the mir-310 cluster upon disruption of the site in CR43432. Points show DESeq-determined fold-changes from two independently derived wild-type or mutant lines. Asterisks denote significant changes (*: p < 0.05, **: p < 0.01, ****: p < 0.0001; adjusted p values determined by DESeq).
(C) Abundance of wild-type CR43432 during embryonic development, as determined by RNA-seq. Also shown is abundance of mutant CR43432 in CR43432 embryos at 8–12 and 12–16 h intervals. Points show TPM values for two independently derived lines (Table S3); lines connect replicate averages.
(D and E) Changes in mRNA levels observed for 8–12 h (D) or 12–16 h (E) embryos after derepressing miR-310 family members by perturbing the site in CR43432. Otherwise, this panel is as in Figure 3A.
(F) Quantification of denticles in the first four rows of the fourth, fifth, and sixth denticle belts (as counted from the posterior of the embryo) for both wild-type (WT) and CR43432 late-stage embryos. Error bars indicate standard error (n = 10, 15, and 15 embryos for belts 4, 5, and 6 of WT, respectively; n = 25, 27, or 21 embryos for belts 4, 5, and 6, of CR43432, respectively), significance determined with a t-test (*; p < 0.05, **; p < 0.01).
(G) Size distributions of devitellinized embryonic cuticles prepared from wild-type and CR43432 late-stage embryos from two independently derived lines (Table S3). Areas for each mutant line and its paired wild-type control were normalized to the median area of the paired wild-type control. Box-and-whiskers show median, quartiles, and a range extending at most 1.5 times the inter-quartile range out from each hinge (significance evaluated with a t-test).
To test the possibility that CR43432 directs degradation of the miR-310 family, we used sRNA-seq to assess changes in miRNA levels in CR43432-mutant embryos. Levels of three of the six miR-310 family members increased in these embryos (Figure 4B; Figure S5B–F; Table S1C). For each dysregulated family member, increases peaked at 8–12 h and dropped off dramatically by 16–20 h (Figure 4B), a pattern that correlated with CR43432 levels, which also peaked at 8–12 h (Figure 4C). Thus, as observed in S2 cells, ability of a site to trigger TDMD appeared largely dependent on its abundance. Furthermore, as with the triggers identified in S2 cells, CR43432 did not appear to be subject to miRNA-directed degradation in wild-type embryos, as CR43432 levels did not increase upon disruption of the miRNA-binding site (Figure 4C).
At each time interval, changes in levels of miR-310 family members observed in CR43432 embryos were less than those observed in dora[A] embryos (Figure 1D–F, Figure 4B). Therefore, at least one other transcript, in addition to CR43432, presumably also directs degradation of miR-310 family members. Nevertheless, by identifying a site in an endogenous transcript that directs degradation of miRNAs in fly embryos, these results demonstrated that endogenous TDMD shapes miRNA levels in an intact invertebrate animal.
Having found that CR43432 acted as a trigger, we assessed changes in gene expression occurring in these CR43432 lines. Slight dysregulation of mRNA levels was observed in 8–12 h embryos, which became more pronounced at 12–16 h (Figures S5G and S5H). This dysregulation included increased repression of top predicted targets of the miR-310 family (Figures 4D and 4E). One of the mRNAs most repressed at both time intervals was shavenoid (sha) (Figure S5I), the very top predicted target of the miR-310 family (Agarwal et al., 2018). Sha regulates denticle patterning on embryonic cuticles (Nüsslein-Volhard et al., 1984), prompting comparison of denticles of CR43432 late-stage embryos to those of wild-type embryos. In agreement with the ~2-fold downregulation of sha in CR43432 embryos (Nüsslein-Volhard et al., 1984), denticles of these embryos were more sparse (Figure 4F; Figure S5J). These findings indicated that TDMD, by reducing levels of miR-310 family members, allows sha to reach appropriate levels, thereby promoting proper embryonic patterning.
To explore other aspects by which CR43432-directed degradation of miR-310 family members might affect embryonic development, we ran GSE (gene-set enrichment) analyses on ranked mRNA fold-changes for each time interval. These analyses revealed dysregulated metabolism in CR43432 embryos, with regulation of genes associated with development of the embryonic cuticle especially perturbed (Figure S5K). We thus assessed whether cuticle integrity was altered in CR43432 embryos, and found that cuticle preparations from CR43432 embryos were significantly larger and somewhat bloated (Figure 4G; Figure S5L). Due to this blimp phenotype, we named the CR43432 lncRNA Marge, after the character Marjorie Dursley from Harry Potter, who becomes inflated like a “monstrous balloon” (Rowling, 1999).
Reducing Levels of the miR-3 Family Rescues Viability of Dora-Deficient Flies
Because we have not yet identified a transcript that directs degradation of the miR-3 family, we used an alternative approach to investigate phenotypic consequences of stabilizing these miRNAs in dora flies. Suspecting that derepression of the miR-3 family might have contributed to lethality observed for hemizygous dora males, we attempted to rescue this phenotype by using a heterozygous deletion of the entire mir-3 cluster (mir-3Δ) (Bushati et al., 2008) to reduce levels of miR-3 and miR-309 in progeny from the dora[A] cross. Accordingly, dora[A] heterozygous females were crossed to males that were heterozygous for mir-3Δ, and genotypes of surviving adult progeny from this rescue cross were compared to those of a control cross that did not introduce mir-3Δ (Figure 5). This reduction of miRNAs of the mir-3 cluster partially rescued lethality typically observed for hemizygous dora[A] males, with 53 dora[A] males with heterozygous mir-3Δ (dora[A]/Y;+/Δ3 males) surviving to adulthood in the rescue cross. We note that this rescue occurred despite the fact that mir-3Δ also reduced four other miRNAs (miR-4, miR-5, miR-6 and miR-286) that were not Dora-sensitive, and thus their reduction was expected to have been detrimental. Although 53 was somewhat fewer than the ~136 expected from complete rescue (as given by the number of balF/y;+/Δ3 males surviving to adulthood in the rescue cross), this ratio of 53 out of 136 was significantly greater (p = 0.002, chi-square test) than the ratio of 21 out of 133 observed without mir-3Δ (i.e., the ratio observed for the numbers of dora/y;+/+ and balF/y;+/+ males in the control cross).
Figure 5: Partial Rescue of Lethality Observed After Reducing Levels of the miR-3 family.
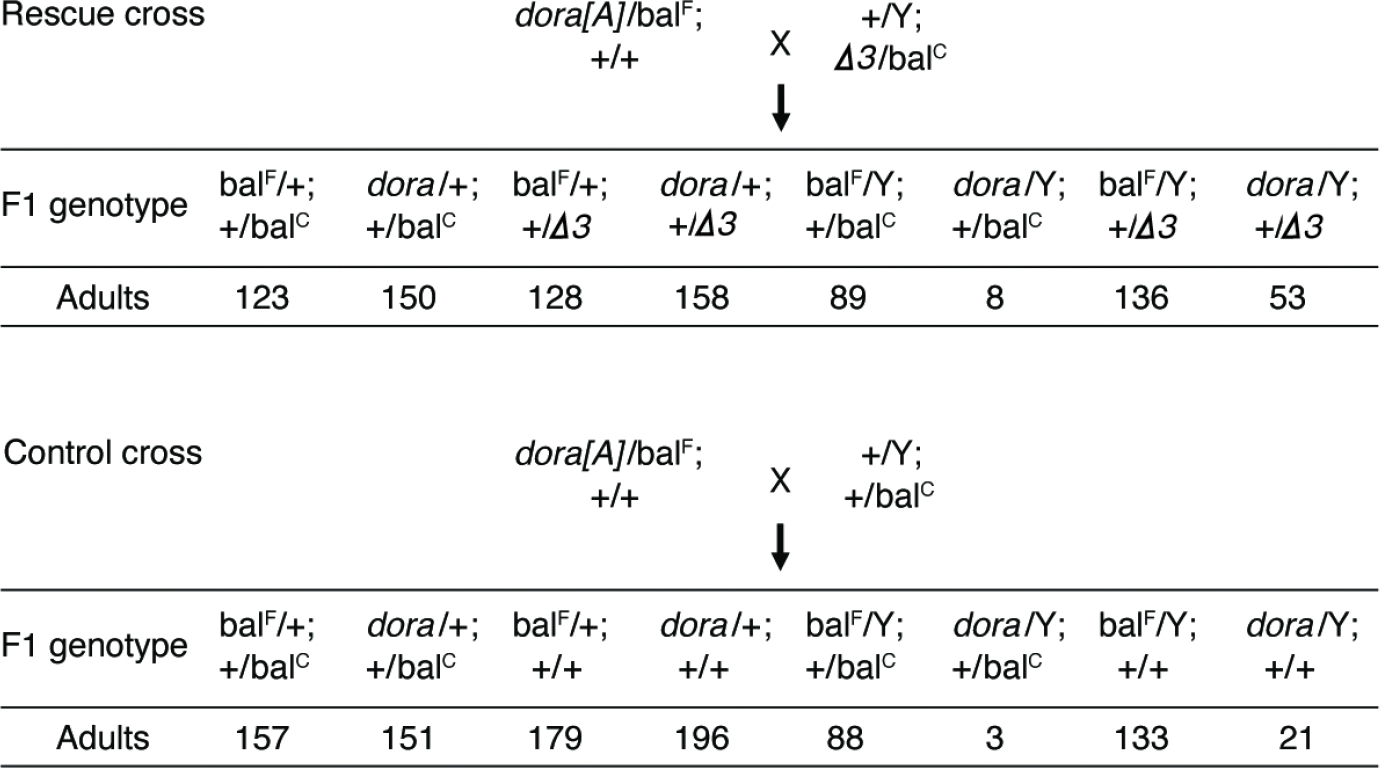
Counts of progeny observed from rescue crosses (dora[A]/FM7 females crossed to miR-3/CyO males) and control crosses (dora[A]/FM7 females crossed to WT/CyO males).
We note that in the experiment of Figure 5, dora[A] hemizygous males with normal levels of the miR-3 family survived to adulthood more frequently than observed earlier with the dora[A] stock line, in which adult males and females both carried the FM7c balancer (Fig. 1C). This difference in viability was partly attributed to crossing to males from a different background, and partly attributed to more frequent and thorough examination of the progeny (as many of the dora[A] hemizygous males that survived without mir-3 reduction got caught up in the food). Nevertheless, the significantly increased viability observed upon reduction of the miR-3 family suggested that Dora-dependent down-regulation of the miR-3 family, presumably occurring through TDMD, is required for normal viability of Drosophila.
Discussion
Identification of TDMD Triggers in Drosophila
We identified six Drosophila transcripts that each direct degradation of one or more cognate miRNA, thereby demonstrating that TDMD operates to shape endogenous levels of miRNAs in an invertebrate animal and presumably has been doing so since the last common ancestor of flies and mammals. Identification of Marge as a TDMD trigger added to the growing list of lncRNAs with known biological functions (Petruk et al., 2006; Mulvey et al., 2014; Wen et al., 2016), while identification of the other five TDMD triggers added to the growing list of mRNAs with known noncoding functions (Sampath and Ephrussi, 2016), and together, the six transcripts more than doubled the set of known endogenous TDMD triggers.
Despite this success, our approach of testing one or two of the top computational predictions did not identify triggers for all of the Dora-sensitive miRNAs. Testing more of the top predictions would presumably identify more triggers. However, we suspect that some sites that direct miRNA degradation were not among our top predictions. For example, sites that fell in coding sequences or 5′ UTRs would have been missed by our pipeline, and sites with functional pairing architectures that differed from known examples, such as the seed-only recognition mode operating for the miR-35 family in C. elegans (Donnelly et al., 2022), would have scored poorly. Going forward, molecular or biochemical detection of transcripts associated with Dora might be the most productive approach for finding additional sites that direct miRNA degradation—especially now that functional sites have been identified in flies, which provide positive internal standards for calibrating experimental approaches in this classic model organism.
Sites were probably not missed because they fell in lowly expressed, poorly annotated transcripts, since only sites that fell in highly expressed transcripts appeared to function to direct detectable degradation. This expression requirement leaves open the possibility that some candidates that failed to validate might nonetheless direct miRNA degradation in contexts where they are expressed more highly. This requirement also emphasized the importance of validating TDMD triggers in the context of their endogenous expression rather than through ectopic expression, since over-expression might impart activity to transcripts that do not normally reach levels sufficient to direct miRNA degradation.
In normal cells and embryos that had the TDMD pathway, sites that directed miRNA degradation failed to also direct degradation of the trigger mRNA/lncRNA. However, in the absence of TDMD, some of these sites appeared to direct trigger degradation. Indeed, even in settings in which widespread repression of predicted targets of the miRNA was not detected, trigger destabilization seemed to occur—perhaps a consequence of extensive 3′ pairing associated with sites that direct miRNA degradation, which can dramatically increase the magnitude of miRNA-mediated mRNA repression (McGeary et al., 2022). Taken together, these results suggested that the TDMD pathway dominates over the pathway that normally degrades miRNA targets. Perhaps this apparent dominance resulted from the kinetics of the two pathways, with Ago degradation proceeding more rapidly than target degradation, or perhaps it resulted from mutual exclusivity of the two pathways, with efficient binding of Dora to Ago blocking association of the target-degradation machinery.
The Biological Roles of TDMD
Loss of Dora was lethal, with many dora-defective individuals dying as embryos. The simplest explanation for this embryonic lethality is that TDMD is required for proper embryonic development and viability of flies. Supporting this proposal, 11 embryonic miRNAs, including those of the miR-310 and miR-3 families, were derepressed in dora mutants. Moreover, targeted derepression of the miR-310 family by perturbation of marge revealed that clearance of this family by the TDMD pathway (and not merely degradation of an unrelated Dora E3-ligase substrate) is important for embryonic cuticle development. Thus, TDMD is required for proper development of an animal. Furthermore, genetic reduction of miR-3 family members partially rescued overall lethality, providing an additional connection between miRNA derepression and the dora phenotype.
The 11 miRNAs derepressed upon loss of Dora in the embryo did not overlap with the 10 miRNAs derepressed upon loss of Dora in S2 cells. Differences in the cohorts of Dora-sensitive miRNAs might have been expected when considering that S2 cells derive from a macrophage-like cell lineage that constitutes only a very small fraction of the cells in mid-to-late embryos. Nonetheless, the lack of any overlap between the embryonic and S2 samples indicated that TDMD substrates are strikingly cell-type specific in Drosophila.
The 11 embryonic miRNAs derepressed upon loss of Dora included the two embryonically expressed members of the miR-3 family and all six members of the miR-310 family. Both the miR-3 and the miR-310 families normally peak in expression during early embryogenesis; the two miR-3 family members (miR-3 and miR-309), together with other members of the mir-3 cluster, undergo a strong, transient pulse in production at the maternal-to-zygotic transition (Bushati et al., 2008), and the miR-310 family is maternally deposited (Aravin et al., 2003; Ruby et al., 2007; Lee et al., 2014). Dora sensitivity of these miRNAs occurs at the time when their levels rapidly decline, which supports the idea that TDMD is enlisted to rapidly clear miRNAs during developmental transitions. Likewise, members of the miR-35 family, which are critical for early embryogenesis in C. elegans and then rapidly cleared during late embryogenesis (McEwen et al., 2016), are sensitive to loss of Ebax-1 (Shi et al., 2020), suggesting that this function is conserved across species. TDMD might also be particularly useful for customizing levels of miRNAs whose production is entangled with that of proteins or other miRNAs, due to transcription as part of either an mRNA intron or a larger miRNA cluster, as occurs with miR-3 and miR-309.
Analyses of marge embryos showed that target-directed degradation of the miR-310 family is important for proper formation of the embryonic cuticle. We suggest that dysregulation of cuticle patterning in mutant embryos is driven by increased repression of sha, the top predicted target for the miR-310 family. How up-regulation of the miR-310 family caused dysregulation of cuticle composition is more difficult to explain. Many mRNAs that encode structural components of the cuticle were upregulated, presumably as a secondary effect of increased repression of direct targets of the miR-310 family. Moreover, up-regulation of cuticle structural components might seem counter-intuitive when considering the decreased cuticle integrity observed for marge mutants; whether this upregulation causes the decreased integrity or whether it is instead a consequence of such decreased integrity is unknown.
Limitations of the Study
The embryonic lethality of dora mutants complicated the study of additional roles of TDMD in Drosophila. This lethality might be bypassed through use of conditional dora disruption or depletion. Another approach for bypassing this lethality is to identify a transcript that triggers TDMD and then disrupt its complementary to the affected miRNA, as exemplified by our disruption of the miR-310 site in Marge. This approach has the added benefit of disentangling the consequences of degrading multiple Dora substrates, including substrates other than Ago1, and thereby demonstrating TDMD. Despite our success in identifying roles of Marge-directed degradation of miR-310 family members, a full account of the biological roles of targeted degradation of the miR-310 family awaits identification of one or more additional trigger that apparently collaborates with Marge to direct robust degradation of this family. Triggers for miR-3 and about half of the other miRNAs known to be Dora-sensitive also remain unidentified, further limiting the ability to use this approach to uncover additional biological roles for the pathway. How many roles for TDMD in Drosophila development and physiology might ultimately be uncovered? When considering that the search for Dora-sensitive miRNAs appears to have been far from saturating—with 21 known Dora-sensitive miRNAs found in only two contexts, 10 in S2 cells and 11 in embryos, with no overlap—we appear to have only scratched the surface.
STAR Methods
RESOURCE AVAILABILITY
Lead contact
Further information and requests for resources and reagents should be directed to and will be fulfilled by the lead contact, David Bartel (dbartel@wi.mit.edu).
Materials availability
Drosophila lines generated for this study were donated to the Bloomington Drosophila Stock Center. Plasmids generated in this study are deposited to Addgene.
Data and code availability
Small-RNA sequencing and RNA sequencing data has been deposited at GEO. Accession numbers are listed in the key resources table. Microscopy data has been deposited at Mendeley. DOIs are listed in the key resources table.
All original code has been deposited at GitHub. DOIs are listed in the key resources table.
Any additional information required to reanalyze the data reported in this paper is available from the lead contact upon request.
Key resources table.
| REAGENT or RESOURCE | SOURCE | IDENTIFIER |
|---|---|---|
| Bacterial and virus strains | ||
| MAX Efficiency DH5a Competent Cells | Life Technologies | 18258012 |
| Chemicals, peptides, and recombinant proteins | ||
| [γ-32P]ATP | PerkinElmer | NEG035C001MC |
| TRI Reagent Solution | Life Technologies | AM9738 |
| Chloroform | J.T. Baker Analytical | 9180-01 |
| Yeast tRNA | Life Technologies | 15401011 |
| Superase-In | Life Technologies | AM2696 |
| GE Healthcare Hybond-NX Membrane | VWR | 95038-412 |
| ULTRAhyb-Oligo hybridization buffer | Life Technologies | AM8663 |
| EDC (N-(3-dimethylaminopropyl)-N′-ethylcarbodiimide) | Thermo Scientific | 22891 |
| 1-methylimidazole | Sigma Aldrich | M50834 |
| Spin-X Centrifuge Tube Filters | Corning | CLS8162 |
| Puromycin dihydrochloride | Life Technologies | A1113803 |
| Halocarbon oil 700 | Sigma Aldrich | H8898 |
| BSA | Research Products International | A30075 |
| Triton X-100 | Sigma Aldrich | T8787 |
| DAPI | Sigma Aldrich | 10236276001 |
| Vectashield | Vector Laboraties | H-1000 |
| Methanol | Fischer chemical | A456-4 |
| Heptane | Sigma Aldrich | 246654 |
| Hoyer’s medium | Stern and Sucena, 2011 | N/A |
| Lactic Acid | Sigma Aldrich | 252476 |
| FLAG-GST-TNRC6B | Hauptmann et al., 2015 | N/A |
| Quickextract | Lucigen | QE09050 |
| beta-Mercaptoethanol | Sigma Aldrich | M6250 |
| cOmplete, Mini, EDTA-free Protease Inhibitor | Roche diagnostics | 11836170001 |
| NuPAGE LDS loading buffer | Life Technologies | NP0007 |
| Restore PLUS Western Blot Stripping Buffer | Life Technologies | 46430 |
| Anti-Ago1 antibody | Abcam | ab5070 |
| Anti-β-Actin antibody | Santa Cruz Biotechnology | sc-47778 |
| Anti-HA antibody | Cell signaling technologies | 3724 |
| ECL Anti-Rabbit IgG, HRP-linked whole antibody | GE Healthcare | # NA934 |
| ECL Anti-Mouse IgG, HRP-linked whole antibody | GE Healthcare | # NA931 |
| Critical commercial assays | ||
| NEXTflex stranded RNA-seq kit | Bioo Scientific | 5138-10 |
| Effectene | Qiagen | 301425 |
| QuikChange Lightning Multi Site-Directed Mutagenesis | Agilent | 210515 |
| KAPA HiFi HotStart ReadyMix | Roche | KK2601 |
| Micro Bio-Spin P30 gell columns | Bio-Rad | 7326250 |
| T4 PNK | New England Biolabs | 101228-172 |
| T4 RNL2 truncated K227Q | New England Biolabs | MO239 |
| T4 RNL1 | New England Biolabs | MO204 |
| KAPA mRNA Hyperprep kit | Roche Diagnostics | 8098115702 |
| Turbo DNase | Thermo Fisher Scientific | AM2238 |
| NuPAGE Bis-Tris 4–12% gel | Life Technologies | NP0322BOX |
| MES running buffer | Life Technologies | NP0002 |
| PVDF membrane | Life Technologies | LC2002 |
| XCell SureLock Mini-Cell | Thermo Fisher Scientific | EI0001 |
| Mini Gel Tank and Blot Module | Thermo Fisher Scientific | A25977 |
| SuperSignal West Femto Maximum Sensitivity Substrate Detection Reagent | Thermo Fisher Scientific | PI34095 |
| Deposited data | ||
| RNA-seq | This paper | GEO: GSE196837 |
| Small-RNA sequencing | This paper | GEO: GSE196837 |
| Imaging data | This paper | DOI: 10.17632/p6sgkky8y3.1 |
| Experimental models: Cell lines | ||
| Drosophila: WT clonal S2 cells | Shi et. al, 2020 | N/A |
| Drosophila: dora clonal S2 cells | Shi et. al, 2020 | N/A |
| Drosophila: ago1 clonal S2 cells | This paper | N/A |
| Drosophila: h clonal S2 cells | This paper | N/A |
| Drosophila: kah clonal S2 cells | This paper | N/A |
| Drosophila: mus308 clonal S2 cells | This paper | N/A |
| Drosophila: wgn clonal S2 cells | This paper | N/A |
| Drosophila: zfh1 clonal S2 cells | This paper | N/A |
| Drosophila: Rfx clonal S2 cells | This paper | N/A |
| Drosophila: CG11248 clonal S2 cells | This paper | N/A |
| Drosophila: Sam clonal S2 cells | This paper | N/A |
| Drosophila: mus81 clonal S2 cells | This paper | N/A |
| Drosophila: wnd clonal S2 cells | This paper | N/A |
| Experimental models: Organisms/strains | ||
| Fly: dora[A] line | Bloomington Drosophila Stock Center (BDSC) | 52333 |
| Fly: dora[B] line | BDSC | 52334 |
| Fly: Dp(1;3)DC353 | BDSC | 30763 |
| Fly: FM7a | BDSC | 35522 |
| Fly: vasa-Cas9 | BDSC | 51323 |
| Fly: Tm3/Tm6 | Gift from the Orr-Weaver lab | N/A |
| Fly: OreR | Gift from the Orr-Weaver lab | N/A |
| Fly: CR43432 Line 1 (WT and mutant pair) | This paper | N/A |
| Fly: CR43432 Line 2 (WT and mutant pair) | This paper | N/A |
| Fly: miR-309 cluster deletion line | BDSC | 58922 |
| Oligonucleotides | ||
| See Table S6 | This paper | N/A |
| miR-7 LNA northern probe | Qiagen | YD00610687-BEA |
| Recombinant DNA | ||
| pAc-sgRNA-Cas9 | Addgene | 49330 |
| pU6-2-BbsI-gRNA | Drosophila Genomics Resource Center | 1363 |
| dora WT rescue construct | This paper | N/A |
| dora[A] rescue construct | This paper | N/A |
| dora[B] rescue construct | This paper | N/A |
| HA-dora WT rescue construct | This paper | N/A |
| HA-dora[A] rescue construct | This paper | N/A |
| HA-dora[B] rescue construct | This paper | N/A |
| HA-GFP rescue construct | This paper | N/A |
| pAc-sgRNA-Cas9.scr_1 | Shi et al., 2020 | N/A |
| pAc-sgRNA-Cas9.scr_2 | Shi et al., 2020 | N/A |
| pAc-sgRNA-Cas9.scr_3 | Shi et al., 2020 | N/A |
| pAc-sgRNA-Cas9.dora_1 | Shi et al., 2020 | N/A |
| pAc-sgRNA-Cas9.dora_2 | Shi et al., 2020 | N/A |
| pAc-sgRNA-Cas9.dora_3 | Shi et al., 2020 | N/A |
| pAc-sgRNA-Cas9.ago1_1 | This paper | N/A |
| pAc-sgRNA-Cas9.ago1_2 | This paper | N/A |
| pAc-sgRNA-Cas9.h_1 | This paper | N/A |
| pAc-sgRNA-Cas9.h_2 | This paper | N/A |
| pAc-sgRNA-Cas9.kah_1 | This paper | N/A |
| pAc-sgRNA-Cas9.kah_2 | This paper | N/A |
| pAc-sgRNA-Cas9.wgn_1 | This paper | N/A |
| pAc-sgRNA-Cas9.wgn_2 | This paper | N/A |
| pAc-sgRNA-Cas9.zfh1_1 | This paper | N/A |
| pAc-sgRNA-Cas9.Rfx_1 | This paper | N/A |
| pAc-sgRNA-Cas9.CG11248_1 | This paper | N/A |
| pAc-sgRNA-Cas9.CG11248_2 | This paper | N/A |
| pAc-sgRNA-Cas9.mus81_1 | This paper | N/A |
| pAc-sgRNA-Cas9.mus81_2 | This paper | N/A |
| pAc-sgRNA-Cas9.Sam_1 | This paper | N/A |
| pAc-sgRNA-Cas9.Sam_2 | This paper | N/A |
| pAc-sgRNA-Cas9.wnd_1 | This paper | N/A |
| pAc-sgRNA-Cas9.mus308_1 | This paper | N/A |
| pU6-2-BbsI-gRNA.CR43432 | This paper | N/A |
| Software and algorithms | ||
| ImageQuant TL | GE Healthcare | v8.1.0.0 |
| Fiji (v2.0.0) | Schindelin et al., 2012 | https://imagej.net/software/fiji/ |
| DESeq2 | Love et al., 2014 | https://bioconductor.org/packages/release/bioc/html/DESeq2.html |
| Beta-uniform mixutre modeling | Pounds et al., 2003 | |
| Benjamini and Hochberg correction | Benjamini and Hochberg, 1995 | Benjamini and Hochberg correction |
| STAR RNA-seq aligner | Dobin et al., 2013 | https://github.com/alexdobin/STAR |
| Htseq-count | Anders et al., 2015 | https://htseq.readthedocs.io/en/release_0.9.1/ |
| TargetScanFly (Release 7.2) | Agarwal et al., 2018 | http://www.targetscan.org/fly_72/ |
| GSEAPreranked (v 4.1.0) | Mootha et al., 2003 and Subramanian et al., 2005 | https://www.gsea-msigdb.org |
| R (v3.5.1) | The R Foundation | https://www.r-project.org |
| Vienna RNA Package 2.0 | Lorenz et al., 2011 | https://www.tbi.univie.ac.at/RNA/ |
| Python (v3.6.9) | Python Software Foundation | https://www.python.org |
| Trigger search pipeline | This paper | DOI: 10.5281/zenodo.6991124 |
| Other | ||
| Small-RNA sequencing protocol, step-by-step | Fang and Bartel, 2015 | http://bartellab.wi.mit.edu/protocols.html |
| Small-RNA blot protocol, step-by-step | Fang and Bartel, 2015 | http://bartellab.wi.mit.edu/protocols.html |
| CRISPR guide cloning protocol, step-by-step | Bassett et al., 2014 | N/A |
| Immunoprecipitation of Ago1 using FLAG-GST-Tnrc6b protocol, step-by-step | Hauptmann et al., 2015; Kingston and Bartel 2021 | N/A |
EXPERIMENTAL MODEL AND SUBJECT DETAIL
Cell lines
Drosophila S2 cells (sex: male) were cultured at 26°C in Schneider’s Drosophila Medium (Life Technologies) supplemented with 10% heat-inactivated FBS (Life Technologies), and were passaged 1:5 every 3–5 days. Cells tested negative for mycoplasma upon arrival to the lab.
Drosophila melanogaster stocks
Fly stocks were maintained on a cornmeal and molasses diet at 22°C. The two dora lines (52333 and 52334), the duplication line used to rescue dora (30763), the line with an X-chromosome balancer expressing RFP (35522), the vasa-Cas9 line (51323), and the mir-309Δ line (58922, which we call the mir-3Δ line) (Bushati et al., 2008) were all obtained from the Bloomington Drosophila Stock Center. The line with a third chromosomal balancer (Tm3,Sb/Tm6,Hu) was a gift from the Orr-Weaver lab. To generate marge lines, vasa-Cas9 embryos were injected with pU6–2-BbsI-gRNA (Drosophila Genomics Resource Center), which had been subcloned as described using oligonucleotides (Table S4) (Bassett et al., 2014). All injections were performed by BestGene, Inc. services. Injected flies were crossed to each other, F1 progeny were genotyped, and mutant-carrying flies were crossed to the Tm3,Sb/Tm6,Hu balancer line. Balanced F2 progeny were genotyped, and heterozygous mutant F2s were crossed to establish homozygous lines. Each marge line was backcrossed to OreR flies, and paired control/mutant lines were established by genotyping and segregating homozygous wild-type and homozygous mutant progeny of the F1 generation produced from the OreR backcross.
METHOD DETAILS
Drosophila S2 cell transfection, and genome editing
For transfection of S2 cells, effectene (Qiagen) was used according to the manufacturer’s protocol, starting with cells that had been seeded 24 h earlier at a density of 2 million cells/mL (counted with a Countess cell automated counter, Invitrogen). For genome editing, cells were transfected with either one or two clones of pAc-sgRNA-Cas9 (Addgene #49330), constructed with oligonucleotides listed in Table S4 and designed as described (Bassett et al., 2014). Beginning 3 d post-transfection, cells were selected in puromycin (5 ug/mL, Life Technologies) for one week, and then sorted to establish clonal lines. After growth for 2–3 weeks in conditioned media (filtered media in which S2 cells had been grown for 24 h), genomic DNA was extracted from clonal lines with QuickExtract (Lucigen), and lines were screened for the desired genotype by amplifying the relevant region of the genome (Table S4) and sequencing the amplicon.
Fly genotyping
For genotyping L1 larvae, individual larvae were macerated with a pipette tip in QuickExtract buffer, and DNA was extracted as per the manufacturer’s protocol. For genotyping adult flies, single wings were plucked from male or virgin female flies, placed into QuickExtract buffer, and DNA was extracted. Relevant regions of the extracted DNA were then amplified and sequenced.
Hatching assays
To quantify percent embryos hatched, flies were placed at a ratio of 2 males for every female into an embryo-collection cage fitted with a molasses agar plate topped with yeast paste. The cages were placed at 25°C, and left for at least 24 h to allow the flies to become accustomed to their new environment. After this period, a fresh yeasted, molasses agar plate was swapped onto the cage, and the flies were allowed to lay embryos overnight. The next day, this plate was removed from the cage, and embryos were transferred in sets of 100 to new yeasted, molasses agar plates. These embryos were incubated at 25°C in a moist environment for more than 24 h, and then unhatched embryos were counted. For each genotype, at least two sets of at least 100 embryos were quantified. For imaging of unhatched embryos, embryos were first dechorionated with 50% bleach and then mounted on a slide under a drop of halocarbon oil (Sigma Aldrich).
Rescue experiments in S2 cells
The wild-type Dora CDS was assembled using overlap-extension PCR from portions of the gene that had been amplified from cDNA generated from S2 cells, and cloned into a modified version of pAc-sgRNA-Cas9 (Addgene #49330) that had been double-digested with BstZ17I and SapI to disrupt sgRNA expression. The dora[B] mutant construct was generated from the wild-type construct using Quikchange Site-Directed Mutagenesis (Agilent). The dora[A] mutant construct was generated by PCR amplifying amino acids 1–945 of the Dora CDS, and cloning this amplicon into the double-digested pAc-sgRNA-Cas9. These constructs were transfected into both wild-type and dora S2 cells, and the transfected cells were selected with puromycin (5 ug/mL) for at least 1 week starting three days following transfection. Following puromycin selection, cells were collected, and RNA was extracted.
Ago1 knockdown in S2 cells
To generate the dsRNA constructs used for RNAi, portions of the Ago1 or GFP coding sequences were amplified using two sets of primers that appended the T7 promoter to either the sense or antisense strand (Table S4). Sense and antisense RNA strands were transcribed in vitro for 4 hours at 37°C with T7 RNA polymerase, purified as described (Rio, 2013), in T7 buffer (40 mM Tris-HCl, pH 7.9, 2.5 mM Spermidine, 26 mM MgCl2, and 0.01% (v./v.) Triton X-100) supplemented with 8 mM GTP, 5 mM CTP, 5 mM ATP, 2 mM UTP, 5 mM DTT, and 10 units of Superasin (Thermo Fisher Scientific). DNA was removed from each reaction by treating with Turbo DNase for 30 min at 37°C (Thermo Fisher Scientific), and RNAs were purified on a denaturing polyacrylamide gel. The sense and antisense strands were annealed at a concentration of 0.5 uM in annealing buffer (0.1M potassium acetate, 30 mM HEPES (pH 7.4), 1 mM magnesium acetate) by heating to 95°C for 5 min and then incubating overnight at 37°C. For knockdown experiments, each well of a 6-well plate was transfected twice with 2 μg of dsRNA, with the second transfection occurring 3 days after the first. Transfections were with effectene, according to the manufacturer’s protocol. Cells were collected for protein and RNA extraction 4 days after the second transfection.
Rescue experiments in embryos
For rescue with the mir-3Δ line, dora[A] heterozygous mothers were crossed to males heterozygous for mir-3Δ (male genotype: mir-3Δ/CyO) (Bushati et al., 2008); as a control, dora[A] heterozygous mothers were crossed to wild-type males generated by crossing the mir-3Δ stock to OreR males (male genotype: +/CyO). The genotypes of all progeny resulting from these crosses were then inferred by examining sex, eye shape (indicative of the dora genotype as a result the bar marker on the FM7c balancer), wing morphology (indicative of the miR-3 genotype, as a result of the CyO marker), and eye color (also used to infer the miR-3 genotype, as a result of the differential expression of the mw markers on the miR-3 and CyO chromosomes).
RNA extraction
RNA extractions were done with TRI Reagent (Life Technologies) according to the manufacturer’s protocol with minor modifications. For S2 cells, samples were homogenized in 1 mL of TRI Reagent. For Drosophila embryos, larvae, and pupae, samples were homogenized in 200 uL of TRI Reagent with a motorized pestle and subsequently brought up to a final volume of 1 mL. Homogenized samples were snap frozen and stored at −80°C until all samples for an experiment or time course had been collected. Samples were then phase-separated by adding 250 uL of Chloroform (J.T. Baker Analytical), and RNA was precipitated with isopropanol. Pellets were washed twice with 70% ethanol, dried, and then resuspended in water.
Northern blotting
Northern blots were carried out as described in the step-by-step protocol found at http://bartellab.wi.mit.edu/protocols.html. Briefly, for each sample, 5–20 ug of total RNA was resolved on a 20% polyacrylamide Urea gel, and then transferred to a Hybond-NX membrane (GE Healthcare) using a semi-dry transfer apparatus (Bio-Rad). RNA was then crosslinked to the membrane by incubating with EDC (N-(3-dimethylaminopropyl)-N′-ethylcarbodiimide; Thermo Scientific) in 1-methylimidazole (Sigma Aldrich) at 65°C for 1–2 h. Membranes were then blocked with Ultrahyb-Oligo (Life Technologies) for >15 min, and probed overnight with either DNA or LNA radiolabeled oligonucleotide probes (Table S4) suspended in Ultrahyb-Oligo. The following day, blots were washed, and signal from the probe was visualized with a phosphorimager (Typhoon FLA 7000) and quantified using ImageQuant TL (v8.1.0.0).
Western blotting
Pelleted S2 cells were lysed for 30 min at 4°C in lysis buffer (100 mM HEPES, 150 mM NaCl, 1% NP-40, 5% glycerol, and cOmplete, Mini, EDTA-free Protease Inhibitor, Roche). Lysates were clarified by centrifugation at 15,000g for 20 min. Samples were incubated at 65°C for 10 min in 1x NuPAGE LDS loading buffer (Life Technologies) and 10% (v/v) 1M DTT prior to being resolved on a polyacrylamide gel (NuPAGE Bis-Tris 4–12% gel, Life Technologies) using an XCell SureLock Mini-Cell Electrophoresis System (Thermo Fisher Scientific) and MES running buffer (Life Technologies) according to the manufacturer’s protocol. Proteins were transferred to a PVDF membrane (Life Technologies) in transfer buffer (Life Technologies) at 25 V for 4 h on ice using the Mini Gel Tank and Blot Module (Thermo Fisher Scientific). After blocking with 5% BSA in PBST (0.1% Tween-20 in PBS) for 4 h at room temperature, membranes were incubated overnight at 4°C with primary antibody diluted in 5% BSA in PBST. The following day, blots were washed five times with PBST for 5 min, incubated with secondary antibody diluted in PBST for 30 min at room temperature with shaking, and then washed again with PBST. Blots were visualized using the SuperSignal West Femto Maximum Sensitivity Substrate Detection Reagent (Thermo Fisher Scientific) according to the manufacturer’s protocol, using a Chemi Doc MP imaging system (Bio-Rad). After probing for Ago1, the membrane was stripped at room temperature for 15 min using Restore PLUS Western Blot Stripping Buffer (Life Technologies). For primary antibody dilutions, Anti-Ago1 (Abcam) was used at 1:4000, Anti-HA (Cell Signaling Technologies) was used at 1:10,000, and Anti-β-Actin (Santa Cruz Biotechnology) was used at 1:2000. For secondary antibody dilutions, ECL Anti-Rabbit IgG, HRP-linked whole antibody (GE Healthcare) and ECL Anti-Mouse IgG, HRP-linked whole antibody (GE Healthcare) were each used at 1:20000.
Embryo collections for RNA extraction
For all staged-embryo samples, flies, at a ratio of two males for every female, were housed at 25°C in an embryo-collection cage fitted with a molasses agar plate topped with yeast paste. Before the first collection of the day, flies were allowed to lay on a fresh, yeasted molasses agar plate for 2 rounds, each at least 1 h in duration, with the goal of clearing any older embryos held within the females. Flies were then allowed to lay on a fresh plate for the desired duration, and the plate was then flipped off the cage and incubated at 25°C in a well-humidified environment. For collection from marge lines and their wild-type control lines, embryos were dechorionated in a 50% bleach solution and transferred to a 1.5 mL microcentrifuge tube with Trizol. These samples were then snap frozen and stored at −80°C. Collection from dora lines was the same, except embryos were dechorionated ~1 h before the desired collection time. These dechorionated embryos were transferred to a 1% agarose plate and sorted for red fluorescence using a Leica M165 FC microscope. Embryos from the dora[A] cross were also sorted to remove those with obviously arrested development. For each of the two sets of sorted embryos, 75% were transferred to a microcentrifuge tube with Trizol and snap frozen, and the remaining 25% were used for DAPI-staining and staging. Upon completion of sample collection for a time course, samples in Trizol were thawed, more Trizol was added to bring the volume to 1 mL, and RNA was extracted as per the manufacturer’s protocol.
Embryo staging via DAPI staining
Dechorionated embryos were transferred into a scintillation vial containing a 1:1 mixture of heptane (Sigma-Aldrich) and methanol (Fischer chemical), and de-vitellinized by vigorous shaking. Once the mixture had settled, the heptane (top phase) was removed from the vial, and the embryos in methanol were transferred into a 1.5 mL microcentrifuge tube. Embryos were allowed to settle, washed once with 100% methanol, and stored at 4°C overnight (or up to 1 month). De-vitellinized embryos were rinsed with methanol and then rehydrated for 30 min in a solution of 1X PBS, 0.2% BSA (Research Products International) and 0.1% Triton X (Sigma Aldrich). Rehydrated embryos were washed with 1X PBS for 10 min, stained with DAPI (1 ug/mL in 1X PBS) (Sigma Aldrich) for 6 min, rinsed once with 1X PBS, and then mounted in Vectashield (Vector Laboratories) for imaging on a Nikon Ti2 microscope. All incubation steps for rehydration, washing, and staining were carried out at room temperature with rocking.
Cuticle preparations
For cuticle preparations, embryo-collection cages were set up as described above, and flies were allowed to lay on a fresh yeasted, molasses agar plate. After 3 h, the plates were flipped off the embryo-collection cage, incubated an additional 18 h at 25°C in a humidified environment, and embryos were dechorionated as described above. For preparations to assess denticle density, dechorionated embryos were devitellinized with a 1:1 solution of methanol and heptane, as described above, and devitellinized embryos were washed three times with 1 mL of 100% methanol, twice with 1 mL of 0.1% Triton X-100, and then mounted in a 1:1 solution of Hoyer’s medium (Stern and Sucena, 2011) and ≥ 85% lactic acid solution (Sigma Aldrich). For preparations to assess cuticle elasticity, the dechorionated embryos were mounted in a 1:1 solution of Hoyer’s medium and lactic acid, and then mechanically devitellinized by exerting slight pressure on the coverslip. For both preparations, slides were incubated for approximately 8 h at 60°C, and then sealed with nail polish. All slides were imaged on a Zeiss AxioPlan 2, using darkfield microscopy to visualize denticles (20X magnification) and brightfield microscopy to assess cuticle area (10X magnification). For preparations to assess cuticle elasticity, we observed batch-to-batch variability, and thus made sure to collect all genotypes that would be compared in the same batch.
Quantification of all images was carried out with the Fiji (version 2.0.0) image processing package (Schindelin et al., 2012). For quantifying the number of denticles per belt, a threshold was applied to each image to isolate the denticles, and then, for the fourth, fifth and sixth denticle belts (with belts enumerated from the posterior of the embryo), a box was drawn with a width that just encompassed all denticles from the first row of denticles and with a height that extended from this first row of denticles to the gap between the fourth and fifth rows of denticles. The number of denticles within each box was then counted with the ‘analyze particles’ function. Belts for which rows of denticles were not clearly distinct (presumably due to deformation during cuticle preparation and mounting) were not quantified. For measurements of cuticle areas, cuticles were imaged, and the perimeter was manually traced, and the area of this shape was then calculated. Note that for some embryos, particularly those from the CR43432 lines, the entire cuticle did not fit within the 10X magnification field, causing a slight underestimate of the cuticle areas for these embryos. For plots, areas for each genotype were normalized to the median area of the paired wild-type samples.
Immunoprecipitation of Ago1
Ago1 was isolated using a FLAG-GST-tagged fragment of TNRC6B (Hauptmann et al., 2015) as described (Kingston and Bartel, 2021).
sRNA-seq library preparation
sRNA-seq libraries were constructed as described in the step-by-step protocol found at http://bartellab.wi.mit.edu/protocols.html, with some alterations. Briefly, between 1 and 5 ug of total RNA was mixed with size-selection markers (18- and 32-nt, 5′-radiolabeled RNAs) and 1 uL of quantitative standards (cel-lsy-6 and xtr-427) (ratios of total RNA:quantitative standards for each sample listed in Table S5). This mixture was size-selected on a denaturing gel, and then 2S rRNA was depleted by subtractive hybridization (Seitz et al., 2008). 3′ and 5′ adapters (each containing 4 random-sequence nucleotides at their ligation junctions) were then sequentially ligated using RNL2 truncated K227Q (NEB) and RNLI (NEB), respectively, in the presence of 10% polyethylene glycol (PEG 8000, NEB) and Superasin (Thermo Fischer Scientific), with gel purification following each ligation step. Purified RNA was reverse transcribed using SuperScript III (Thermo Fischer Scientific) and amplified using Kapa HiFi HotStart Ready Mix (Roche Diagnostics). Libraries were sequenced on an Illumina HiSeq platform with 50-nt single-end reads. Oligonucleotides used for markers, subtractive hybridization, adaptors, and primers are listed (Table S4).
RNAseq library preparation
With the exception of the Ago1 RNAi (and control RNAi) experiments, RNA-seq libraries were prepared using the NEXTflex Rapid Directional RNA-seq Kit (Bioo Scientific) following enrichment of polyadenylated mRNAs with NEXTflex Poly(A) Beads (Bioo Scientific). These libraries were sequenced on an Illumina HiSeq platform with 50-nt single-end reads. For the Ago1 RNAi and control RNAi experiments, libraries were prepared with the Kapa RNA Hyperprep Kit with mRNA capture (Roche diagnostics). These libraries were sequenced on an Illumina NovaSeq platform with 50-nt paired-end reads.
Prediction and validation of TDMD triggers
The pipeline that searched for TDMD triggers required for input a list of Dora-sensitive miRNAs with their sequences, raw RNAseq data from a sample in which Dora sensitivity was observed, and a transcript file. In our implementations of the pipeline, the transcript file included annotations for all Drosophila ncRNAs and 3′ UTRs (dmel-all-ncRNA-r6.08.fasta and dmel-all-three_prime_UTR-r6.08.fasta), which had been filtered to retain those with more than 10 reads in the RNAseq data. These expressed transcripts were queried for complementarity to the 3′ region of each Dora-sensitive miRNA (i.e., the region starting at nucleotide 13 and extending to the end of the miRNA), tolerating up to two mismatches (classifying G–U wobbles as mismatches) or bulged nucleotides. For transcripts identified in this search, the 30 nucleotides downstream of the identified site were queried for complementarity to the seed region (nucleotides 2–8 of the miRNA), again allowing at most two mismatches or bulges. Sites containing both 3′ complementarity and seed complementarity were considered candidate TDMD trigger sites.
These candidate sites were then filtered by loop length, requiring that the segments of complementarity to the seed and 3′ regions of the miRNA be between 1 and 15 nt apart. The duplex stability of each site was then predicted using the duplexfold command from the Vienna RNA package 2.0 (Lorenz et al., 2011), and candidate sites were sorted based on predicted duplex energy. Because the central region of the miRNA is typically not paired in target interactions that efficiently trigger TDMD, nucleotides 9–11 of the miRNA were treated as random nucleotides (‘N’s) for this analysis. For each miRNA under consideration, the top 50 candidate sites (listed at https://github.com/erkingston/TDMD_trigger_pipeline) were then assessed for conservation among insects (using the ‘dm6.PhyloP124way.bed’ file downloaded from UCSC), considering the mean PhyloP score across the entire site, and this information, together with manual inspection of pairing architecture was used to select candidates for experimental validation. For miR-7 and miR-277, a second set of candidates were chosen for experimental validation following failure of the first set to validate.
For experimental validation, candidate sites were edited using CRISPR-Cas9 and guides that cut within the candidate site or flanking both sides of the candidate site (Table S4). Clonal lines with defined lesions (Table S3) were established from these CRISPR-edited pools of cells, and changes in miRNA levels were assessed in these clonal lines using either Northern blotting or sRNA-seq.
Compared to another recently published TDMD trigger-prediction pipeline (Simeone et al., 2022), our pipeline was specific to a cell-type or system of interest, restricting its search to transcripts that were expressed in that context and miRNAs that were Dora-sensitive in that context. The efficacy of the two pipelines cannot be compared, as they were applied to different species, and our validation was designed to test whether a candidate endogenously triggered miRNA reduction, whereas the validation of the other pipeline tested whether a candidate triggered miRNA reduction when ectopically overexpressed.
QUANTIFICATION AND STATISTICAL ANALYSIS
sRNA-seq analyses
Sequencing reads were processed and counted as previously described (Kingston and Bartel, 2021). DESeq2 (R v3.5.1) (Love et al., 2014) was used for differential analyses, after first filtering miRNAs to remove those with an average expression less than 5 RPM and a coefficient of variation of expression across all replicates of either genotype >1.0.
For all analyses of miRNA levels following perturbation of candidate triggers, miRNA fold-changes were determined with DESeq2, and differentially expressed miRNAs were identified as those miRNAs with a DESeq-adjusted p value below 0.05. Each set of differentially expressed miRNAs was then manually curated to remove those miRNAs for which all strands expressed from the same transcriptional unit (including passenger strands) increased to a similar degree (i.e., with log2 fold-changes at most 0.5 apart from each other), as upregulation of these miRNAs seemed likely due to transcriptional regulation. This curation removed a single miRNA (miR-932–5p) from one time interval (the 8–12 h interval for CR43432 embryos).
To call differentially expressed miRNAs in dora samples, we used a modified bi-beta-uniform mixture (BBUM) model that detects and removes outliers to approximate the background distribution of p values for those miRNAs that are not directly affected by loss of Dora (Pounds and Morris, 2003; Wang and Bartel, 2022). Briefly, the DESeq raw p values for all miRNAs were classified based on the directional change of the corresponding miRNA upon loss of Dora. Those p values associated with miRNAs that decreased in abundance were modeled with a uniformly distributed component for noise as well as a beta component for secondary effects due to disruption of Dora, as loss of Dora should not directly lead to decreased miRNA abundance. Those p values associated with miRNAs that increased in abundance were modeled with the same two aforementioned components as well as an additional beta component for primary effects of loss of Dora. Both sets of p values were then fit simultaneously with this model, and the resulting parameters were used to determine the corrected and FDR-adjusted p values (Benjamini and Hochberg, 1995) of those miRNAs that were stabilized upon loss of Dora. The model detected and removed one outlier each for the 8–12 h time intervals for both dora[A] (miR-932–5p) and dora[B] (miR-1002–5p). All miRNAs with an FDR-adjusted p value <0.01 were called as differentially expressed. This differentially expressed set was manually curated (as described above) to remove miRNAs likely regulated at the level of transcription. This curation removed a single miRNA (miR-282–3p) from one time interval (the 16–20 h interval for dora[B] embryos).
RNA-seq analyses
RNAseq reads were aligned to the genome (UCSC dm6.08 reference assembly) using STAR (V2.4, with the paramaters “--alignIntronMax 1 --runThreadN 30 --outFilterMultimapNmax 1 --outFilterMismatchNoverLmax 0.04 --outFilterIntronMotifs RemoveNoncanonicalUnannotated – outSJfilterReads”) (Dobin et al., 2013), and alignments to all chromosomal genes were counted using htseq-count (with the parameters “-m union -s reverse” for single-end reads, and with the additional parameter “-r name” for paired-end reads) (Anders et al., 2015). TPM values were determined by dividing these htseq-determined counts for each gene by the median length for all isoforms of that gene, and then normalizing these values for library depth.
Differential analyses of mRNAs were carried out with DESeq2, with the results further filtered to include only those for mRNAs with TPM >10 in all samples. For miRNA-targeting analyses, filtered fold-changes were determined and mRNAs were classified on the basis of whether or not they were predicted to be targets by TargetScanFly (Release 7.2; (Agarwal et al., 2018). For each miRNA, the set of “all targets” included all mRNAs that both passed the expression threshold in the samples of interest and were predicted to be conserved targets of the miRNA, whereas “top targets” were the top 25% (as ranked by the cumulative weighted context score) of the all-targets set. Each set of non-targets was defined by choosing randomly, for each predicted target, five 3′-UTR-length-matched non-target predictions (i.e., mRNAs that were quantified in the sample and had UTR lengths within 2-fold of that of the predicted target but were not predicted to be a conserved or poorly conserved target of the miRNA). Because this selection was done with replacement, an mRNA could be selected as a length-matched non-target for multiple predicted targets. This non-target selection process was performed 51 times, and the non-target cohort with the median difference between the all-target and non-target curves was carried forward for analysis. The difference between the curves was estimated as the cumulative difference of fold-change values of target and the non-target curves at each integer percentile from 5% to 95%.
To assess the degree of contamination of dora samples with embryos stalled earlier in development, we searched for evidence of early-expressed mRNAs in the later embryonic time intervals. Early-expressed mRNAs were identified using RNA-seq data from the two Marge wild-type controls, by comparing average mRNA TPM values at 0–2 h to that observed at later time intervals of 8–12, 12–16, and 16–20 h (requiring TPM > 0 in all samples examined), to generated a set of early-expressed mRNAs that had an average TPM values ≥100-fold greater in the early time interval. The same procedure was used to identify mRNAs with TPM values ≥100-fold greater in the 2–4 h time interval. For each of these early-expressed genes, the dora to wild-type expression ratio was determined at the later time intervals. Ratios greater than one were suggestive of potential contamination with embryos stalled at early stages of embryogenesis.
To identify classes of genes dysregulated in marge embryos, we used GSEAPreranked (version 4.1.0) (Mootha et al., 2003; Subramanian et al., 2005) to preform GSE analysis on mRNAs ranked by fold-change (as determined by DESeq) observed upon disruption of Marge. Gene sets were generated from GO term annotations downloaded from FlyBase (GAF2.2, downloaded 06/07/2020).
Statistical analyses
For all other statistical analyses, the tests used, as well as specifics about the data sets to which these tests were applied, are specified either in the appropriate figure legend or in the text of the results section.
Supplementary Material
Table S1: Changes in miRNAs Observed upon Disruption of TDMD During Embryogenesis, related to Figures 1 and 4, and Figures S2, S3, and S5
Table S1A: Fold-Changes in miRNAs Observed upon Loss of Dora During Embryogenesis, related to Figure 1 and Figure S2
Log2 fold-changes (FC) observed upon loss of Dora and the associated BBUM-corrected and FDR-adjusted p values (padj) (see methods) are tabulated for libraries from both the dora[A] and dora[B] time courses (with the 8–12, 12–16, and 16–20 h time intervals specified with a 1, 2, and 3, respectively). NA values in the FC and padj column indicate those miRNAs that did not pass either the DEseq cutoff or our more stringent expression cutoff, respectively, for a given timepoint.
Table S1B: Fold-Changes Observed for Passenger Strands of the mir-3 and mir-310 Clusters upon Loss of Dora, related to Figure S3
Log2 fold-changes (FC) observed upon loss of Dora and the associated adjusted p values (padj), as determined by DESeq2, are tabulated for the passenger strands of the mir-3 and mir-310 clusters from both the dora[A] and dora[B] time courses (with the 8–12, 12–16, and 16–20 h time intervals specified with a 1, 2, or 3, respectively). NA values in the FC and padj column indicate those miRNAs that did not pass either the DEseq cutoff or our more stringent expression cutoff, respectively, for a given timepoint.
Table S1C: Fold-Changes in miRNAs Observed upon Perturbation of CR43432, related to Figure 4 and Figure S5
Log2 fold-changes (FC) observed upon disruption of the site for the miR-310 family in CR43432 and the associated adjusted p values (padj), as determined by DESeq2, are tabulated for 2–4 (2.4), 4–8 (4.8), 8–12 (8.12), 12–16 (12.16), and 16–20 (16.20) h embryos. NA values in the FC and padj column indicate those miRNAs that did not pass either the DEseq cutoff or our more stringent expression cutoff, respectively, for a given timepoint.
Table S2: Fold-Changes in mRNAs Observed upon Loss of Dora During Embryogenesis, related to Figure S3
Log2 fold-changes (FC) observed upon loss of Dora and the associated adjusted p values (padj), as determined by DESeq2, are tabulated for libraries from both the dora[A] and dora[B] time courses (with the 8–12, 12–16, and 16–20 h time intervals specified with a 1, 2, and 3, respectively). NA values in the FC and padj column indicate those mRNAs that did not pass either the expression cutoff for a given timepoint.
Table S3. Lesions Made to Candidate Trigger Sites, related to Figures 2–4 and Figures S4 and S5
Listed are the lesions present in each clonal S2 cell line screened as a part of the trigger-validation pipeline as well as those present in the two CR43432 fly lines. Lesions are described with reference to the cognate miRNA, and sequences are written 5′ to 3′.
Table S4. Oligonucleotides Used in This Study, related to Figures 1–5, and Figures S1–S5
Table S5. Abundances of Quantitative Standard in sRNA-seq Samples, related to Figures 1 and 4, and Figures S2, S3, and S5
Listed for each sRNA-seq sample used in this study is the amount of total RNA used as well as the volume of quantitative standard added. For each genotype and time interval, the same amount of total RNA and quantitative standard were used for paired mutant and control samples. CR1 and CR2 denote the two CR43432 lines.
Highlights.
Target-directed microRNA degradation (TDMD) is required for proper development
A noncoding RNA directs degradation of miR-310 miRNAs, promoting cuticle integrity
TDMD-deficient embryos also accumulate miR-3/309, which appears to reduce viability
At sites where TDMD competes with miRNA-directed target degradation, TDMD dominates
Acknowledgements
We thank C. Shi, D. Lin, K. Khalizeva, P. Wang, E. Slobodyanyuk, M. Stubna, and other members of the Bartel lab, for helpful discussions, the Whitehead Institute Genome Technology Core for sequencing, and the Whitehead Keck Microscopy Facility for microscopy guidance. This work was supported by N.I.H. grant GM118135 (D.P.B.) and an N.S.F. predoctoral fellowship (E.R.K.). D.P.B. is an investigator of the Howard Hughes Medical Institute.
Footnotes
Declaration of interests
D.P.B. is a member of Molecular Cell’s advisory board. E.R.K. has an immediate family member on Molecular Cell’s advisory board.
Publisher's Disclaimer: This is a PDF file of an unedited manuscript that has been accepted for publication. As a service to our customers we are providing this early version of the manuscript. The manuscript will undergo copyediting, typesetting, and review of the resulting proof before it is published in its final form. Please note that during the production process errors may be discovered which could affect the content, and all legal disclaimers that apply to the journal pertain.
References
- Agarwal V, Subtelny AO, Thiru P, Ulitsky I, and Bartel DP (2018). Predicting microRNA targeting efficacy in Drosophila. Genome biology 19, 152. 10.1186/s13059-018-1504-3 [DOI] [PMC free article] [PubMed] [Google Scholar]
- Ameres SL, Horwich MD, Hung J-H, Xu J, Ghildiyal M, Weng Z, and Zamore PD (2010). Target RNA–directed trimming and tailing of small silencing RNAs. Science 328, 1534–1539. 10.1126/science.1187058 [DOI] [PMC free article] [PubMed] [Google Scholar]
- Anders S, Pyl PT, and Huber W (2015). HTSeq—a Python framework to work with high-throughput sequencing data. Bioinformatics 31, 166–169. 10.1093/bioinformatics/btu638 [DOI] [PMC free article] [PubMed] [Google Scholar]
- Aravin AA, Lagos-Quintana M, Yalcin A, Zavolan M, Marks D, Snyder B, Gaasterland T, Meyer J, and Tuschl T (2003). The small RNA profile during Drosophila melanogaster development. Dev cell 5, 337–350. 10.1016/S1534-5807(03)00228-4 [DOI] [PubMed] [Google Scholar]
- Baccarini A, Chauhan H, Gardner TJ, Jayaprakash AD, Sachidanandam R, and Brown BD (2011). Kinetic analysis reveals the fate of a microRNA following target regulation in mammalian cells. Current biology 21, 369–376. 10.1016/j.cub.2011.01.067 [DOI] [PMC free article] [PubMed] [Google Scholar]
- Bartel DP (2018). Metazoan MicroRNAs. Cell 173, 20–51. 10.1016/j.cell.2018.03.006 [DOI] [PMC free article] [PubMed] [Google Scholar]
- Bassett AR, Tibbit C, Ponting CP, and Liu J-L (2014). Mutagenesis and homologous recombination in Drosophila cell lines using CRISPR/Cas9. Biology open 3, 42–49. 10.1242/bio.20137120 [DOI] [PMC free article] [PubMed] [Google Scholar]
- Benjamini Y, and Hochberg Y (1995). Controlling the false discovery rate: a practical and powerful approach to multiple testing. Journal of the Royal statistical society: series B (Methodological) 57, 289–300. [Google Scholar]
- Berezin C, Glaser F, Rosenberg J, Paz I, Pupko T, Fariselli P, Casadio R, and Ben-Tal N (2004). ConSeq: the identification of functionally and structurally important residues in protein sequences. Bioinformatics 20, 1322–1324. 10.1093/bioinformatics/bth070 [DOI] [PubMed] [Google Scholar]
- Bitetti A, Mallory AC, Golini E, Carrieri C, Gutierrez HC, Perlas E, Pérez-Rico YA, Tocchini-Valentini GP, Enright AJ, and Norton WH (2018). MicroRNA degradation by a conserved target RNA regulates animal behavior. Nature structural & molecular biology 25, 244. 10.1038/s41594-018-0032-x [DOI] [PubMed] [Google Scholar]
- Bushati N, Stark A, Brennecke J, and Cohen SM (2008). Temporal reciprocity of miRNAs and their targets during the maternal-to-zygotic transition in Drosophila. Current Biology 18, 501–506. 10.1016/j.cub.2008.02.081 [DOI] [PubMed] [Google Scholar]
- Cazalla D, Yario T, and Steitz JA (2010). Down-regulation of a host microRNA by a Herpesvirus saimiri noncoding RNA. Science 328, 1563–1566. 10.1126/science.1187197 [DOI] [PMC free article] [PubMed] [Google Scholar]
- Chen Y-W, Song S, Weng R, Verma P, Kugler J-M, Buescher M, Rouam S, and Cohen SM (2014). Systematic study of Drosophila microRNA functions using a collection of targeted knockout mutations. Dev cell 31, 784–800. 10.1016/j.devcel.2014.11.029 [DOI] [PubMed] [Google Scholar]
- Czech B, Malone CD, Zhou R, Stark A, Schlingeheyde C, Dus M, Perrimon N, Kellis M, Wohlschlegel JA, and Sachidanandam R (2008). An endogenous small interfering RNA pathway in Drosophila. Nature 453, 798–802. 10.1038/nature07007 [DOI] [PMC free article] [PubMed] [Google Scholar]
- de la Mata M, Gaidatzis D, Vitanescu M, Stadler MB, Wentzel C, Scheiffele P, Filipowicz W, and Großhans H (2015). Potent degradation of neuronal miRNAs induced by highly complementary targets. EMBO reports 16, 500–511. 10.15252/embr.201540078 [DOI] [PMC free article] [PubMed] [Google Scholar]
- Dobin A, Davis CA, Schlesinger F, Drenkow J, Zaleski C, Jha S, Batut P, Chaisson M, and Gingeras TR (2013). STAR: ultrafast universal RNA-seq aligner. Bioinformatics 29, 15–21. 10.1093/bioinformatics/bts635 [DOI] [PMC free article] [PubMed] [Google Scholar]
- Donnelly BF, Yang B, Grimme AL, Vieux K-F, Liu C-Y, Zhou L, and McJunkin K (2022). The developmentally timed decay of an essential microRNA family is seed-sequence dependent. Cell Reports 40, 111154. 10.1016/j.celrep.2022.111154 [DOI] [PMC free article] [PubMed] [Google Scholar]
- Ghini F, Rubolino C, Climent M, Simeone I, Marzi MJ, and Nicassio F (2018). Endogenous transcripts control miRNA levels and activity in mammalian cells by target-directed miRNA degradation. Nature communications 9, 3119. 10.1038/s41467-018-05182-9 [DOI] [PMC free article] [PubMed] [Google Scholar]
- Förstemann K, Horwich MD, Wee L, Tomari Y, and Zamore PD (2007). Drosophila microRNAs are sorted into functionally distinct argonaute complexes after production by dicer-1. Cell 130, 287–297. 10.1016/j.cell.2007.05.056 [DOI] [PMC free article] [PubMed] [Google Scholar]
- Haelterman NA, Jiang L, Li Y, Bayat V, Sandoval H, Ugur B, Tan KL, Zhang K, Bei D, and Xiong B (2014). Large-scale identification of chemically induced mutations in Drosophila melanogaster. Genome Res 24, 1707–1718. 10.1101/gr.174615.114 [DOI] [PMC free article] [PubMed] [Google Scholar]
- Han J, LaVigne CA, Jones BT, Zhang H, Gillett F, and Mendell JT (2020). A ubiquitin ligase mediates target-directed microRNA decay independently of tailing and trimming. Science 370. 10.1126/science.abc9546 [DOI] [PMC free article] [PubMed] [Google Scholar]
- Hauptmann J, Schraivogel D, Bruckmann A, Manickavel S, Jakob L, Eichner N, Pfaff J, Urban M, Sprunck S, and Hafner M (2015). Biochemical isolation of Argonaute protein complexes by Ago-APP. Proceedings of the National Academy of Sciences 112, 11841–11845. 10.1073/pnas.1506116112 [DOI] [PMC free article] [PubMed] [Google Scholar]
- Kingston ER, and Bartel DP (2021). Ago2 protects Drosophila siRNAs and microRNAs from target-directed degradation, even in the absence of 2′-O-methylation. RNA 27, 710–724. 10.1261/rna.078746.121 [DOI] [PMC free article] [PubMed] [Google Scholar]
- Kleaveland B, Shi CY, Stefano J, and Bartel DP (2018). A network of noncoding regulatory RNAs acts in the mammalian brain. Cell 174, 350–362. e317. 10.1016/j.cell.2018.05.022 [DOI] [PMC free article] [PubMed] [Google Scholar]
- Lee M, Choi Y, Kim K, Jin H, Lim J, Nguyen TA, Yang J, Jeong M, Giraldez AJ, and Yang H (2014). Adenylation of maternally inherited microRNAs by Wispy. Molecular cell 56, 696–707. 10.1016/j.molcel.2014.10.011 [DOI] [PMC free article] [PubMed] [Google Scholar]
- Lee S, Song J, Kim S, Kim J, Hong Y, Kim Y, Kim D, Baek D, and Ahn K (2013). Selective degradation of host MicroRNAs by an intergenic HCMV noncoding RNA accelerates virus production. Cell host & microbe 13, 678–690. 10.1016/j.chom.2013.05.007 [DOI] [PubMed] [Google Scholar]
- Li L, Sheng P, Li T, Fields CJ, Hiers NM, Wang Y, Li J, Guardia CM, Licht JD, and Xie M (2021). Widespread microRNA degradation elements in target mRNAs can assist the encoded proteins. Genes & Development 35, 1595–1609. 10.1101/gad.348874.121 [DOI] [PMC free article] [PubMed] [Google Scholar]
- Libri V, Helwak A, Miesen P, Santhakumar D, Borger JG, Kudla G, Grey F, Tollervey D, and Buck AH (2012). Murine cytomegalovirus encodes a miR-27 inhibitor disguised as a target. Proceedings of the National Academy of Sciences 109, 279–284. 10.1073/pnas.1114204109 [DOI] [PMC free article] [PubMed] [Google Scholar]
- Lorenz R, Bernhart SH, Zu Siederdissen CH, Tafer H, Flamm C, Stadler PF, and Hofacker IL (2011). ViennaRNA Package 2.0. Algorithms for molecular biology 6, 1–14. 10.1186/1748-7188-6-26 [DOI] [PMC free article] [PubMed] [Google Scholar]
- Love MI, Huber W, and Anders S (2014). Moderated estimation of fold change and dispersion for RNA-seq data with DESeq2. Genome Biol 15, 550. 10.1186/s13059-014-0550-8 [DOI] [PMC free article] [PubMed] [Google Scholar]
- Marcinowski L, Tanguy M, Krmpotic A, Rädle B, Lisnić VJ, Tuddenham L, Chane-Woon-Ming B, Ruzsics Z, Erhard F, and Benkartek C (2012). Degradation of cellular mir-27 by a novel, highly abundant viral transcript is important for efficient virus replication in vivo. PLoS pathogens 8, e1002510. 10.1371/journal.ppat.1002510 [DOI] [PMC free article] [PubMed] [Google Scholar]
- McEwen TJ, Yao Q, Yun S, Lee C-Y, and Bennett KL (2016). Small RNA in situ hybridization in Caenorhabditis elegans, combined with RNA-seq, identifies germline-enriched microRNAs. Developmental biology 418, 248–257. 10.1016/j.ydbio.2016.08.003 [DOI] [PMC free article] [PubMed] [Google Scholar]
- McGeary SE, Bisaria N, Pham TM, Wang PY, and Bartel DP (2022). MicroRNA 3′-compensatory pairing occurs through two binding modes, with affinity shaped by nucleotide identity and position. Elife 11, e69803. 10.7554/eLife.69803 [DOI] [PMC free article] [PubMed] [Google Scholar]
- Mootha VK, Lindgren CM, Eriksson K-F, Subramanian A, Sihag S, Lehar J, Puigserver P, Carlsson E, Ridderstråle M, and Laurila E (2003). PGC-1α-responsive genes involved in oxidative phosphorylation are coordinately downregulated in human diabetes. Nature genetics 34, 267–273. 10.1038/ng1180 [DOI] [PubMed] [Google Scholar]
- Mulvey BB, Olcese U, Cabrera JR, and Horabin JI (2014). An interactive network of long non-coding RNAs facilitates the Drosophila sex determination decision. Biochimica et Biophysica Acta (BBA)-Gene Regulatory Mechanisms 1839, 773–784. 10.1016/j.bbagrm.2014.06.007 [DOI] [PMC free article] [PubMed] [Google Scholar]
- Nüsslein-Volhard C, Wieschaus E, and Kluding H (1984). Mutations affecting the pattern of the larval cuticle in Drosophila melanogaster. Wilhelm Roux’s archives of developmental biology 193, 267–282. 10.1007/BF00848156 [DOI] [PubMed] [Google Scholar]
- Okamura K, Chung W-J, Ruby JG, Guo H, Bartel DP, and Lai EC (2008). The Drosophila hairpin RNA pathway generates endogenous short interfering RNAs. Nature 453, 803–806. 10.1038/nature07015 [DOI] [PMC free article] [PubMed] [Google Scholar]
- Okamura K, Ishizuka A, Siomi H, and Siomi MC (2004). Distinct roles for Argonaute proteins in small RNA-directed RNA cleavage pathways. Genes & development 18, 1655–1666. 10.1101/gad.1210204 [DOI] [PMC free article] [PubMed] [Google Scholar]
- Okumura F, Oki N, Fujiki Y, Ikuta R, Osaki K, Hamada S, Nakatsukasa K, Hisamoto N, Hara T, and Kamura T (2021). ZSWIM8 is a myogenic protein that partly prevents C2C12 differentiation. Scientific reports 11, 1–14. 10.1038/s41598-021-00306-6 [DOI] [PMC free article] [PubMed] [Google Scholar]
- Petruk S, Sedkov Y, Riley KM, Hodgson J, Schweisguth F, Hirose S, Jaynes JB, Brock HW, and Mazo A (2006). Transcription of bxd noncoding RNAs promoted by trithorax represses Ubx in cis by transcriptional interference. Cell 127, 1209–1221. 10.1016/j.cell.2006.10.039 [DOI] [PMC free article] [PubMed] [Google Scholar]
- Pounds S, and Morris SW (2003). Estimating the occurrence of false positives and false negatives in microarray studies by approximating and partitioning the empirical distribution of p-values. Bioinformatics 19, 1236–1242. 10.1093/bioinformatics/btg148 [DOI] [PubMed] [Google Scholar]
- Rio DC (2013). Expression and purification of active recombinant T7 RNA polymerase from E. coli. Cold Spring Harbor Protocols 2013, pdb. prot078527. 10.1101/pdb.prot078527 [DOI] [PubMed] [Google Scholar]
- Rowling J.K.a. (1999). Harry Potter and the prisoner of Azkaban (First edition. Arthur A. Levine Books; ). [Google Scholar]
- Ruby JG, Stark A, Johnston WK, Kellis M, Bartel DP, and Lai EC (2007). Evolution, biogenesis, expression, and target predictions of a substantially expanded set of Drosophila microRNAs. Genome research 17, 1850–1864. 10.1101/gr.6597907 [DOI] [PMC free article] [PubMed] [Google Scholar]
- Sampath K, and Ephrussi A (2016). CncRNAs: RNAs with both coding and non-coding roles in development. Development 143, 1234–1241. 10.1242/dev.133298 [DOI] [PubMed] [Google Scholar]
- Schindelin J, Arganda-Carreras I, Frise E, Kaynig V, Longair M, Pietzsch T, Preibisch S, Rueden C, Saalfeld S, and Schmid B (2012). Fiji: an open-source platform for biological-image analysis. Nature methods 9, 676–682. 10.1038/nmeth.2019 [DOI] [PMC free article] [PubMed] [Google Scholar]
- Seitz H, Ghildiyal M, and Zamore PD (2008). Argonaute loading improves the 5′ precision of both MicroRNAs and their miRNA* strands in flies. Current Biology 18, 147–151. 10.1016/j.cub.2007.12.049 [DOI] [PMC free article] [PubMed] [Google Scholar]
- Sheu-Gruttadauria J, Pawlica P, Klum SM, Wang S, Yario TA, Oakdale NTS, Steitz JA, and MacRae IJ (2019). Structural basis for target-directed microrna degradation. Molecular cell 75, 1243–1255. e1247. 10.1016/j.molcel.2019.06.019 [DOI] [PMC free article] [PubMed] [Google Scholar]
- Shi CY, Kingston ER, Kleaveland B, Lin DH, Stubna MW, and Bartel DP (2020). The ZSWIM8 ubiquitin ligase mediates target-directed microRNA degradation. Science 370. 10.1126/science.abc9359 [DOI] [PMC free article] [PubMed] [Google Scholar]
- Simeone I, Rubolino C, Noviello TMR, Farinello D, Cerulo L, Marzi MJ, and Nicassio F (2022). Prediction and pan-cancer analysis of mammalian transcripts involved in target directed miRNA degradation. Nucleic acids research 50, 2019–2035. 10.1093/nar/gkac057 [DOI] [PMC free article] [PubMed] [Google Scholar]
- Stern DL, and Sucena E (2011). Preparation of cuticles from unhatched first-instar Drosophila larvae. Cold Spring Harbor Protocols 2011, pdb. prot065532. doi: 10.1101/pdb.prot065532 [DOI] [PubMed] [Google Scholar]
- Subramanian A, Tamayo P, Mootha VK, Mukherjee S, Ebert BL, Gillette MA, Paulovich A, Pomeroy SL, Golub TR, and Lander ES (2005). Gene set enrichment analysis: a knowledge-based approach for interpreting genome-wide expression profiles. Proceedings of the National Academy of Sciences 102, 15545–15550. 10.1073/pnas.0506580102 [DOI] [PMC free article] [PubMed] [Google Scholar]
- UCSC genome browswer. Multiz Alignment & Conservation (124 insects). https://genome.ucsc.edu. [Google Scholar]
- Wang PY, and Bartel DP (2022). A statistical approach for identifying primary substrates of ZSWIM8-mediated microRNA degradation in small-RNA sequencing data. bioRxiv. 10.1101/2022.02.17.480958 [DOI] [PMC free article] [PubMed] [Google Scholar]
- Wang Z, Hou Y, Guo X, van der Voet M, Boxem M, Dixon JE, Chisholm AD, and Jin Y (2013). The EBAX-type Cullin-RING E3 ligase and Hsp90 guard the protein quality of the SAX-3/Robo receptor in developing neurons. Neuron 79, 903–916. 10.1016/j.neuron.2013.06.035 [DOI] [PMC free article] [PubMed] [Google Scholar]
- Wen K, Yang L, Xiong T, Di C, Ma D, Wu M, Xue Z, Zhang X, Long L, and Zhang W (2016). Critical roles of long noncoding RNAs in Drosophila spermatogenesis. Genome research 26, 1233–1244. 10.1101/gr.199547.115 [DOI] [PMC free article] [PubMed] [Google Scholar]
- Xie J, Ameres SL, Friedline R, Hung J-H, Zhang Y, Xie Q, Zhong L, Su Q, He R, and Li M (2012). Long-term, efficient inhibition of microRNA function in mice using rAAV vectors. Nature methods 9, 403. 10.1038/nmeth.1903 [DOI] [PMC free article] [PubMed] [Google Scholar]
- Yamamoto S, Jaiswal M, Charng W-L, Gambin T, Karaca E, Mirzaa G, Wiszniewski W, Sandoval H, Haelterman NA, and Xiong B (2014). A drosophila genetic resource of mutants to study mechanisms underlying human genetic diseases. Cell 159, 200–214. 10.1016/j.cell.2014.09.002 [DOI] [PMC free article] [PubMed] [Google Scholar]
Associated Data
This section collects any data citations, data availability statements, or supplementary materials included in this article.
Supplementary Materials
Table S1: Changes in miRNAs Observed upon Disruption of TDMD During Embryogenesis, related to Figures 1 and 4, and Figures S2, S3, and S5
Table S1A: Fold-Changes in miRNAs Observed upon Loss of Dora During Embryogenesis, related to Figure 1 and Figure S2
Log2 fold-changes (FC) observed upon loss of Dora and the associated BBUM-corrected and FDR-adjusted p values (padj) (see methods) are tabulated for libraries from both the dora[A] and dora[B] time courses (with the 8–12, 12–16, and 16–20 h time intervals specified with a 1, 2, and 3, respectively). NA values in the FC and padj column indicate those miRNAs that did not pass either the DEseq cutoff or our more stringent expression cutoff, respectively, for a given timepoint.
Table S1B: Fold-Changes Observed for Passenger Strands of the mir-3 and mir-310 Clusters upon Loss of Dora, related to Figure S3
Log2 fold-changes (FC) observed upon loss of Dora and the associated adjusted p values (padj), as determined by DESeq2, are tabulated for the passenger strands of the mir-3 and mir-310 clusters from both the dora[A] and dora[B] time courses (with the 8–12, 12–16, and 16–20 h time intervals specified with a 1, 2, or 3, respectively). NA values in the FC and padj column indicate those miRNAs that did not pass either the DEseq cutoff or our more stringent expression cutoff, respectively, for a given timepoint.
Table S1C: Fold-Changes in miRNAs Observed upon Perturbation of CR43432, related to Figure 4 and Figure S5
Log2 fold-changes (FC) observed upon disruption of the site for the miR-310 family in CR43432 and the associated adjusted p values (padj), as determined by DESeq2, are tabulated for 2–4 (2.4), 4–8 (4.8), 8–12 (8.12), 12–16 (12.16), and 16–20 (16.20) h embryos. NA values in the FC and padj column indicate those miRNAs that did not pass either the DEseq cutoff or our more stringent expression cutoff, respectively, for a given timepoint.
Table S2: Fold-Changes in mRNAs Observed upon Loss of Dora During Embryogenesis, related to Figure S3
Log2 fold-changes (FC) observed upon loss of Dora and the associated adjusted p values (padj), as determined by DESeq2, are tabulated for libraries from both the dora[A] and dora[B] time courses (with the 8–12, 12–16, and 16–20 h time intervals specified with a 1, 2, and 3, respectively). NA values in the FC and padj column indicate those mRNAs that did not pass either the expression cutoff for a given timepoint.
Table S3. Lesions Made to Candidate Trigger Sites, related to Figures 2–4 and Figures S4 and S5
Listed are the lesions present in each clonal S2 cell line screened as a part of the trigger-validation pipeline as well as those present in the two CR43432 fly lines. Lesions are described with reference to the cognate miRNA, and sequences are written 5′ to 3′.
Table S4. Oligonucleotides Used in This Study, related to Figures 1–5, and Figures S1–S5
Table S5. Abundances of Quantitative Standard in sRNA-seq Samples, related to Figures 1 and 4, and Figures S2, S3, and S5
Listed for each sRNA-seq sample used in this study is the amount of total RNA used as well as the volume of quantitative standard added. For each genotype and time interval, the same amount of total RNA and quantitative standard were used for paired mutant and control samples. CR1 and CR2 denote the two CR43432 lines.
Data Availability Statement
Small-RNA sequencing and RNA sequencing data has been deposited at GEO. Accession numbers are listed in the key resources table. Microscopy data has been deposited at Mendeley. DOIs are listed in the key resources table.
All original code has been deposited at GitHub. DOIs are listed in the key resources table.
Any additional information required to reanalyze the data reported in this paper is available from the lead contact upon request.
Key resources table.
| REAGENT or RESOURCE | SOURCE | IDENTIFIER |
|---|---|---|
| Bacterial and virus strains | ||
| MAX Efficiency DH5a Competent Cells | Life Technologies | 18258012 |
| Chemicals, peptides, and recombinant proteins | ||
| [γ-32P]ATP | PerkinElmer | NEG035C001MC |
| TRI Reagent Solution | Life Technologies | AM9738 |
| Chloroform | J.T. Baker Analytical | 9180-01 |
| Yeast tRNA | Life Technologies | 15401011 |
| Superase-In | Life Technologies | AM2696 |
| GE Healthcare Hybond-NX Membrane | VWR | 95038-412 |
| ULTRAhyb-Oligo hybridization buffer | Life Technologies | AM8663 |
| EDC (N-(3-dimethylaminopropyl)-N′-ethylcarbodiimide) | Thermo Scientific | 22891 |
| 1-methylimidazole | Sigma Aldrich | M50834 |
| Spin-X Centrifuge Tube Filters | Corning | CLS8162 |
| Puromycin dihydrochloride | Life Technologies | A1113803 |
| Halocarbon oil 700 | Sigma Aldrich | H8898 |
| BSA | Research Products International | A30075 |
| Triton X-100 | Sigma Aldrich | T8787 |
| DAPI | Sigma Aldrich | 10236276001 |
| Vectashield | Vector Laboraties | H-1000 |
| Methanol | Fischer chemical | A456-4 |
| Heptane | Sigma Aldrich | 246654 |
| Hoyer’s medium | Stern and Sucena, 2011 | N/A |
| Lactic Acid | Sigma Aldrich | 252476 |
| FLAG-GST-TNRC6B | Hauptmann et al., 2015 | N/A |
| Quickextract | Lucigen | QE09050 |
| beta-Mercaptoethanol | Sigma Aldrich | M6250 |
| cOmplete, Mini, EDTA-free Protease Inhibitor | Roche diagnostics | 11836170001 |
| NuPAGE LDS loading buffer | Life Technologies | NP0007 |
| Restore PLUS Western Blot Stripping Buffer | Life Technologies | 46430 |
| Anti-Ago1 antibody | Abcam | ab5070 |
| Anti-β-Actin antibody | Santa Cruz Biotechnology | sc-47778 |
| Anti-HA antibody | Cell signaling technologies | 3724 |
| ECL Anti-Rabbit IgG, HRP-linked whole antibody | GE Healthcare | # NA934 |
| ECL Anti-Mouse IgG, HRP-linked whole antibody | GE Healthcare | # NA931 |
| Critical commercial assays | ||
| NEXTflex stranded RNA-seq kit | Bioo Scientific | 5138-10 |
| Effectene | Qiagen | 301425 |
| QuikChange Lightning Multi Site-Directed Mutagenesis | Agilent | 210515 |
| KAPA HiFi HotStart ReadyMix | Roche | KK2601 |
| Micro Bio-Spin P30 gell columns | Bio-Rad | 7326250 |
| T4 PNK | New England Biolabs | 101228-172 |
| T4 RNL2 truncated K227Q | New England Biolabs | MO239 |
| T4 RNL1 | New England Biolabs | MO204 |
| KAPA mRNA Hyperprep kit | Roche Diagnostics | 8098115702 |
| Turbo DNase | Thermo Fisher Scientific | AM2238 |
| NuPAGE Bis-Tris 4–12% gel | Life Technologies | NP0322BOX |
| MES running buffer | Life Technologies | NP0002 |
| PVDF membrane | Life Technologies | LC2002 |
| XCell SureLock Mini-Cell | Thermo Fisher Scientific | EI0001 |
| Mini Gel Tank and Blot Module | Thermo Fisher Scientific | A25977 |
| SuperSignal West Femto Maximum Sensitivity Substrate Detection Reagent | Thermo Fisher Scientific | PI34095 |
| Deposited data | ||
| RNA-seq | This paper | GEO: GSE196837 |
| Small-RNA sequencing | This paper | GEO: GSE196837 |
| Imaging data | This paper | DOI: 10.17632/p6sgkky8y3.1 |
| Experimental models: Cell lines | ||
| Drosophila: WT clonal S2 cells | Shi et. al, 2020 | N/A |
| Drosophila: dora clonal S2 cells | Shi et. al, 2020 | N/A |
| Drosophila: ago1 clonal S2 cells | This paper | N/A |
| Drosophila: h clonal S2 cells | This paper | N/A |
| Drosophila: kah clonal S2 cells | This paper | N/A |
| Drosophila: mus308 clonal S2 cells | This paper | N/A |
| Drosophila: wgn clonal S2 cells | This paper | N/A |
| Drosophila: zfh1 clonal S2 cells | This paper | N/A |
| Drosophila: Rfx clonal S2 cells | This paper | N/A |
| Drosophila: CG11248 clonal S2 cells | This paper | N/A |
| Drosophila: Sam clonal S2 cells | This paper | N/A |
| Drosophila: mus81 clonal S2 cells | This paper | N/A |
| Drosophila: wnd clonal S2 cells | This paper | N/A |
| Experimental models: Organisms/strains | ||
| Fly: dora[A] line | Bloomington Drosophila Stock Center (BDSC) | 52333 |
| Fly: dora[B] line | BDSC | 52334 |
| Fly: Dp(1;3)DC353 | BDSC | 30763 |
| Fly: FM7a | BDSC | 35522 |
| Fly: vasa-Cas9 | BDSC | 51323 |
| Fly: Tm3/Tm6 | Gift from the Orr-Weaver lab | N/A |
| Fly: OreR | Gift from the Orr-Weaver lab | N/A |
| Fly: CR43432 Line 1 (WT and mutant pair) | This paper | N/A |
| Fly: CR43432 Line 2 (WT and mutant pair) | This paper | N/A |
| Fly: miR-309 cluster deletion line | BDSC | 58922 |
| Oligonucleotides | ||
| See Table S6 | This paper | N/A |
| miR-7 LNA northern probe | Qiagen | YD00610687-BEA |
| Recombinant DNA | ||
| pAc-sgRNA-Cas9 | Addgene | 49330 |
| pU6-2-BbsI-gRNA | Drosophila Genomics Resource Center | 1363 |
| dora WT rescue construct | This paper | N/A |
| dora[A] rescue construct | This paper | N/A |
| dora[B] rescue construct | This paper | N/A |
| HA-dora WT rescue construct | This paper | N/A |
| HA-dora[A] rescue construct | This paper | N/A |
| HA-dora[B] rescue construct | This paper | N/A |
| HA-GFP rescue construct | This paper | N/A |
| pAc-sgRNA-Cas9.scr_1 | Shi et al., 2020 | N/A |
| pAc-sgRNA-Cas9.scr_2 | Shi et al., 2020 | N/A |
| pAc-sgRNA-Cas9.scr_3 | Shi et al., 2020 | N/A |
| pAc-sgRNA-Cas9.dora_1 | Shi et al., 2020 | N/A |
| pAc-sgRNA-Cas9.dora_2 | Shi et al., 2020 | N/A |
| pAc-sgRNA-Cas9.dora_3 | Shi et al., 2020 | N/A |
| pAc-sgRNA-Cas9.ago1_1 | This paper | N/A |
| pAc-sgRNA-Cas9.ago1_2 | This paper | N/A |
| pAc-sgRNA-Cas9.h_1 | This paper | N/A |
| pAc-sgRNA-Cas9.h_2 | This paper | N/A |
| pAc-sgRNA-Cas9.kah_1 | This paper | N/A |
| pAc-sgRNA-Cas9.kah_2 | This paper | N/A |
| pAc-sgRNA-Cas9.wgn_1 | This paper | N/A |
| pAc-sgRNA-Cas9.wgn_2 | This paper | N/A |
| pAc-sgRNA-Cas9.zfh1_1 | This paper | N/A |
| pAc-sgRNA-Cas9.Rfx_1 | This paper | N/A |
| pAc-sgRNA-Cas9.CG11248_1 | This paper | N/A |
| pAc-sgRNA-Cas9.CG11248_2 | This paper | N/A |
| pAc-sgRNA-Cas9.mus81_1 | This paper | N/A |
| pAc-sgRNA-Cas9.mus81_2 | This paper | N/A |
| pAc-sgRNA-Cas9.Sam_1 | This paper | N/A |
| pAc-sgRNA-Cas9.Sam_2 | This paper | N/A |
| pAc-sgRNA-Cas9.wnd_1 | This paper | N/A |
| pAc-sgRNA-Cas9.mus308_1 | This paper | N/A |
| pU6-2-BbsI-gRNA.CR43432 | This paper | N/A |
| Software and algorithms | ||
| ImageQuant TL | GE Healthcare | v8.1.0.0 |
| Fiji (v2.0.0) | Schindelin et al., 2012 | https://imagej.net/software/fiji/ |
| DESeq2 | Love et al., 2014 | https://bioconductor.org/packages/release/bioc/html/DESeq2.html |
| Beta-uniform mixutre modeling | Pounds et al., 2003 | |
| Benjamini and Hochberg correction | Benjamini and Hochberg, 1995 | Benjamini and Hochberg correction |
| STAR RNA-seq aligner | Dobin et al., 2013 | https://github.com/alexdobin/STAR |
| Htseq-count | Anders et al., 2015 | https://htseq.readthedocs.io/en/release_0.9.1/ |
| TargetScanFly (Release 7.2) | Agarwal et al., 2018 | http://www.targetscan.org/fly_72/ |
| GSEAPreranked (v 4.1.0) | Mootha et al., 2003 and Subramanian et al., 2005 | https://www.gsea-msigdb.org |
| R (v3.5.1) | The R Foundation | https://www.r-project.org |
| Vienna RNA Package 2.0 | Lorenz et al., 2011 | https://www.tbi.univie.ac.at/RNA/ |
| Python (v3.6.9) | Python Software Foundation | https://www.python.org |
| Trigger search pipeline | This paper | DOI: 10.5281/zenodo.6991124 |
| Other | ||
| Small-RNA sequencing protocol, step-by-step | Fang and Bartel, 2015 | http://bartellab.wi.mit.edu/protocols.html |
| Small-RNA blot protocol, step-by-step | Fang and Bartel, 2015 | http://bartellab.wi.mit.edu/protocols.html |
| CRISPR guide cloning protocol, step-by-step | Bassett et al., 2014 | N/A |
| Immunoprecipitation of Ago1 using FLAG-GST-Tnrc6b protocol, step-by-step | Hauptmann et al., 2015; Kingston and Bartel 2021 | N/A |