

Abstract
X chromosome inactivation center (Xic) pairing occurs during the differentiation of embryonic stem (ES) cells from female mouse embryos, and is related to X chromosome inactivation, the circadian clock, intra-nucleus architecture, and metabolism. However, the mechanisms underlying the identification and approach of X chromosome pairs in the crowded nucleus are unclear. To elucidate the driving force of Xic pairing, we developed a coarse-grained molecular dynamics model of intranuclear chromosomes in ES cells and in cells 2 days after the onset of differentiation (2-day cells) by considering intrachromosomal epigenetic-structural feature-dependent mechanics. The analysis of the experimental data showed that X-chromosomes exhibit the rearrangement of their distributions of open/closed chromatin regions on their surfaces during cell differentiation. By simulating models where the excluded volume effects of closed chromatin regions are stronger than those of open chromatin regions, such rearrangement of open/closed chromatin regions on X-chromosome surfaces promoted the mutual approach of the Xic pair. These findings suggested that local intrachromosomal epigenetic features may contribute to the regulation of cell species-dependent differences in intranuclear architecture.
Keywords: X chromosome, embryonic stem cells, Xic pairing
Significance
Since the discovery of X chromosome inactivation center (Xic) pairing during cell differentiation of mouse embryonic stem cells, their physiological roles have been variously suggested. However, the driving force promoting such a dynamical process in crowded nuclei was not elucidated. The present study developed mathematical models of chromosomes in ES cells and early-differentiated cells based on their structural and epigenomic features. The experimental data analysis showed the drastic change in the distributions of open and closed chromatin regions on the X-chromosome during cell differentiation. The simulations of these models suggested such epigenomic changes promoted Xic pairing.
Introduction
The pairing between X chromosomes, particularly between the regions called X chromosome inactivation center (Xic) regions, occurs during the early differentiation of embryonic stem (ES) cells from female mouse embryos [1–4]. A recent study suggested that transient pairing is associated with biallelic expression of genes related to X chromosome inactivation (XCI), such as Xist/Tsix RNA that initiates XCI-related processes and Kdm6a and Kdm5c that repress these processes [4]. Furthermore, changes in the expression levels of various genes such as Lmnb, Glut8, and Per2, which are respectively known to regulate intranuclear architectures, metabolic programs, and the circadian clock, were found to correlate with temporal dynamics of the Xic-Xic distance distribution [4]. Thus, Xic pairing is expected to play an important role in promoting various physiological processes during embryo development.
Additionally, understanding of the physiological and biophysical mechanisms of XCI-related X chromosome behaviors in mouse embryos may provide insights into the mechanisms of XCI in various mammals, including humans [5]. Indeed, various models have recently been proposed for post pairing processes of X chromosomes, such as XCI promotion and Xic pairing stabilization [6–12], which are expected to occur in the inter-X chromosome compartment with a width ~100 nm [13]. However, the mechanisms through which X chromosome pairs can find and approach each other in a large, crowded nucleus (diameter ~10 μm, containing 40 total chromosomes) have not yet been clarified.
In studies using mouse ES cells, various epigenomic features, such as histone modification distributions and positions of chromatin domain boundaries in the X chromosome, show major differences among cells at the onset of differentiation and 2 days later; subsequently, X chromosome pairing can be observed [2–4]. Recent studies of intranuclear chromosome structural dynamics have suggested that genomic features such as chromosome size and the ratio of transcribed genome regions, and epigenomic features such as histone modifications and specific protein binding, may influence intranuclear chromosomes and intrachromosomal chromatin domain positioning [14–28]. Additionally, some theoretical studies based on polymer chains with heterogeneities assuming genomic and epigenomic feature-dependent physical properties of local chromatin succeeded in reproducing experimentally observed nucleus-wide genome structures, such as transcriptionally active/inactive chromatin distributions in interphase of human cells [24] and mouse rod cells [25,26], as well as the pairing of homologous chromosomes in the meiotic prophase of fission yeast [27]. These facts suggest that epigenomic state changes in X chromosomes may promote Xic pairing during the differentiation of mouse ES cells.
Accordingly, in this study, we developed coarse-grained molecular dynamics models of nuclei (containing 40 chromosomes) from mouse ES cells (the ES cell model) and cells at 2 days following differentiation (the 2-day cell model) to test this hypothesis. Chromosomes were described by blob chains with heterogeneity of physical properties based on their respective high-throughput chromosome conformation capture (Hi-C) data [28].
Materials and Methods
Determination of A-, B-, and M-Regions in Chromosomes from ES Cells and 2-Days Cells
A- and B-compartments for the first and second replicates of ES cells and 2-day cells were obtained as previously proposed, using Hi-C data (GSM3127755, GSM3127759, GSM3127756, GSM3127760) and GC-content of local chromatin regions of the mouse genome (mm9) [28].
Each genome region was defined as an A- or B-region if the region was labeled as an A- or B-compartment in the results from two biological replicates of each experiment. The genome region was defined as an M-region if the region was labeled as a different compartment in results from two replicates for each experiment. Regions with no Hi-C data were defined as NA regions and were expected to correspond to centromere or telomere regions.
Estimation of the Basic Conformations of Chromosomes Using Polymer from Hi-C Data and Radial Distributions of Each Region
A polymer exhibiting the average three-dimensional conformation of each chromosome was constructed using Hi-C data for ES cells and 2-day cells (https://doi.org/10.5281/zenodo.3371884) [28] based on a recently proposed consensus method [29–31] implemented in PASTIS as an MDS2 method [32]. Here, the MDS2 method is an extended multidimensional scaling (MDS)-based method that constructs the model of each chromosome as a strand of beads. In the first step of this method, the contact frequency between each pair of genome regions is converted to the pairwise distance between them by assuming a biophysical model of DNA, where the pairwise distance is assumed to be inversely proportional to the cube of the contact frequency. Next, a multidimensional scaling problem is solved to obtain the 3D structure that best matches the pairwise distance. This MDS-based method is known to well reproduce the global structure of chromosome territories and TAD-like structures.
For both ES and 2-day cells, merged Hi-C data obtained from two biological replicates were analyzed. The three-dimensional spatial position of each monomer in each polymer for each chromosome provided that of the corresponding genome region analyzed in the previous section (Supplementary Table S1). Based on our results, each monomer was attributed to the A-, B-, or M-region (Supplementary Figure S1a).
According to these position data, NDA, NDB, and NDM were evaluated in ES and 2-day cells (Figure 2). The overall chromosome shapes and their epigenetic features were confirmed to be unchanged qualitatively, even if the three-dimensional structure of each chromosome was constructed using other methods implemented in PASTIS with the NMDS, PM1, and PM2 methods [32] (Supplementary Table S2–4). Therefore, the polymer inferred by the MDS2 method was defined as that of basic conformations of chromosomes for the following construction of coarse-grained blob models.
Determination of A-, B-, and M-Domains and Domain Groups in Each Chromosome
Each polymer model for each chromosome was divided into groups of successively connected monomers, called domains (Supplementary Figure S1a). Monomers acting as domain boundaries (boundary monomers) were obtained based on boundary scores of each genome region (monomer) that could be calculated from merged Hi-C data using a previously proposed method with the same parameter values (Supplementary Table S1) [28]. Here, the boundary score was obtained by smoothing the insulation score along the genome regions. The insulation score of each genome region was estimated as the interaction probability between the upper 200 kbp part and the lower 200 kbp part of each region calculated from the Hi-C contact matrix data, where the regions with lower scores exhibit stronger insulation (see [28] for more details). In this study, each domain was assumed to consist of one boundary monomer and the monomers between this boundary monomer and the upstream boundary monomers (Supplementary Figure S1a).
The epigenetic attribute of each domain was defined as the A-domain if more than 50% of the domain occupied the A-region, as the B-domain if more than 50% of the domain occupied the A-region, or as the M-domain if the domain was neither an A-domain nor a B-domain (Supplementary Figure S1a). Notably, the NA region was considered a B-region when determining the domain attributes because the NA region was expected to correspond to the centromere or telomere regions forming heterochromatin. Additionally, the domain group was defined as the group containing domains with the same epigenetic attributes successively connected along the polymer (Supplementary Figure S1a).
Description of Each Domain Group Using Blobs to Construct Coarse-Grained Models of Chromosomes
Each domain group was divided into blobs, forming a similar envelope shape as the monomer population in the blob (Supplementary Figure S1b), with elimination of small structural noise as follows (Supplementary Figure S1a).
First, k-means clustering of the three-dimensional coordinates of monomers in each domain group was performed. For this clustering, the number of clusters dividing each domain group in the n-th chromosome was assumed as the integer value with [number of domains in the domain group]/CNDn truncated. Here, CNDn was the characteristic number of domains in the n-th chromosome and was defined as the number of domains for which the physical distance between two loci increased successively on average with the increases in the domain number between the two loci. In other words, CNDn could be considered to have a value similar to that of the persistent length of n-th chromosome obtained when the chromosome was described as a chain consisting of domains as the units. By this definition, each domain group containing more domains than CNDn was divided into multiple clusters, enabling imitation of its curved shape by connection of these cluster centers. Here, each blob is defined as a particle that represents the chromatin region containing the domain of each cluster, and CNDn gives the scale of typical blob size as the number of domains. CNDn was evaluated by comparing the decay rate of the average PDND ([physical distance between two domains]/[number of domain connections between these domains]) as a function of the number of domain connections between the two domains. It was noted that the average PDND in each chromosome decreased monotonically (Supplementary Figure S2). Therefore, in this study, PDND in each chromosome was simply fit using a function ~ exp(-[number of domains between two loci]/L), and CNDn was assumed as L.
Next, each domain group was described by distinct blobs based on the results of clustering. If the monomer cluster consisted of only a set of monomers successively connected along the polymer, the set of monomers was described as one blob. If not, the monomer cluster was divided to subclusters in which monomers were successively connected along the polymer in each subcluster, and each set of monomers in each subcluster was described as one blob.
The coordinate and radius of each blob were defined as the centroid coordinate of blobs containing monomers and the standard deviation of the distance from the blob centroid to the contained monomers. The epigenetic attribute of each blob was given by that of the corresponding domain group and designated the A-, B-, and M-blobs. By connecting the neighboring blobs along the polymer, a coarse-grained model of chromosomes was constructed as blob chains involving structural, genomic, and epigenomic features (Supplementary Figure S1a, Supplementary Table S5). In this model, the distance between each pair of blobs in the same chain was defined as that in the basic structure of the blob chain model of chromosomes.
In recently proposed coarse-grained models of large-scale genome structures, each chromosome has been represented by a chain of particles with a constant radius, assuming that the length of the DNA sequence contained in each particle is constant [33–36]. Conversely, in the present model, the radius of each blob was given non-uniform because each blob was assumed to contain a DNA region of varying length depending on the characteristics of local chromatin structures. Using such blobs with heterogeneous radii, the shape of each chromosome could be more appropriately described with fewer particles.
Equation of Motion for Each Blob in the Coarse-Grained Model of Chromosomes
The dynamics of all intranuclear chromosomes (chromosomes 1–19 and the X chromosomes) of ES cells and 2-day cells were simulated using the motion of each blob (Supplementary Table S5), which was affected by the interaction potential and noise from the nucleoplasm. The motion of the i-th blob was assumed to obey the overdamped Langevin equation, as follows:
| (1) |
where xi=(xi,yi,zi) is the position of the i-th blob, V indicates the potential of the system, and γi and Ri(t) were the coefficient of drag force and the random force working on i-th blob from the nucleoplasm, respectively, where γi=6πηri with a nucleoplasm viscosity η and a radius of the i-th blob ri. Ri(t) was given as Gaussian white noise and satisfied 〈Ri(t)〉=0, and 〈Ri(t)Rj(s)〉=2γikBTδijδ(t–s), where kB is the Boltzmann constant, T is the temperature, δij indicates the Kronecker delta, and δ indicates the Dirac delta function.
The first term of the right-hand side of Eq. (1) indicates forces working on the i-th blob provided by the potential of the system, as follows:
| (2) |
where Vcol is the potential of the force excluding the volume effects among blobs, Vchr is the interaction potential of the force sustaining the shape of each chromosome, and Vmem is the potential of the force to confine blobs within the nuclear envelope.
The potential Vcol was denoted by
| (3) |
where ri indicates the radius of the i-th blob, indicates the basic distance between the i-th and j-th blobs, dij=|xi–xj|, and θ is the Heaviside step function defined by the following function:
| (4) |
was given as the distance between the i-th and j-th blobs in the basic structure of the blob chain if the blobs belonged to the same blob chain and were given as infinity if not. provided the coefficient of the elastic repulsion working when the i-th and j-th blobs came in contact with each other, where qi indicates the nondimensional parameter of rigidity of the i-th blob dependent on its epigenetic attribute.
The potential Vchr was denoted by
| (5) |
| (6) |
| (7) |
where and are the elastic constants sustaining the shape of the basic structure of each chain. The Σ in Eq. (6) indicates the sum over the set of i-th and j-th blobs that belong to the same blob chain and adjacent to each other along the chain. The Σ in Eq. (7) indicates the sum over the set of i-th and j-th blobs belonging to the same blob chain and coming in contact with each other on the basic structure of the chain but not adjacent along the chain.
The potential Vmem was denoted by
| (8) |
where di=|xi|, R is the radius of the nuclear envelope, and is the coefficient of the elastic repulsion working when the i-th blob came in contact with the nuclear envelope.
Simulation Method
To simulate the model, the time integral of the Langevin Eq. (1) was calculated numerically using the Eular-Maruyama method with a unit step of 10–5 s. The parameters of the nucleoplasm features were given as η=0.64 kg m–1 s–1, kBT=4.141947×10⁻²¹ kg m2 s–2 (T=300 K).
Because A-, B-, and M-blobs described the open flexible chromatin regions, the closed dense chromatin regions, and the region with intermediate features, respectively, M-blobs were assumed to be more rigid than A-blobs and less rigid than B-blobs. In the current study, qi was assumed to be 0.1, 10.0, and 1.0 for A-, B-, and M-blobs, respectively. Other parameters were assumed to be , , , and . Note that physiologically precise determinations of these parameter values were difficult. Therefore, these values were chosen to be sufficiently large to avoid the crossing of two local blob chains with each other. The qualitative features of the simulation results and conclusions of the current study were not changed, even if the detail factors of these parameters were changed.
The blob chain models of homologous chromosomes were assumed to have the same basic structures, and the blob chains were randomly placed in a spherical shell with a radius of 5 μm for the initial condition of each simulation.
Statistical Analysis of Simulation Data
The probability distributions of the distance between two blobs containing Xic pairs were plotted with a bin interval of 1 μm, consistent with that used in previous reports of experimental results [1,2]. Those of distances between pairs of homologous chromosomes were also plotted with the same bin interval. For both models of ES cells and 2-day cells, 30 simulations with different initial configurations of blob chains were performed. The probability distributions of these distances for each simulation were evaluated using data for blob coordinates from 18 to 36 s. For both models, the average values and 95% confidence intervals (error bars) of the probability of exhibiting each distance were calculated using 30 probability distribution profiles. The significance of the difference in the probability of exhibiting each distance between ES cell and 2-day cell models was examined by Welch’s t-test.
Results
A/B-Compartment Distributions of X Chromosomes in ES Cells Were Unstable but Stabilized during Differentiation
To evaluate chromosome states, A/B-compartments of ES cells and cells 2 days after the onset of differentiation (2-day cells) were evaluated using two biological replicates of Hi-C data drawn from these cell populations (GSM3127755, GSM3127759, GSM3127756, GSM3127760) and GC-content of local chromatin regions of the mouse genome (mm9) [28]. Here, regions corresponding to open chromatin were labeled as A-compartment regions, whereas those corresponding to closed chromatin were labeled as B-compartment regions [37]. In ES cells, the profile of A/B-compartment locations in X chromosomes showed large deviations among the results from two biological replicates, although those of autosomes were robust (Figure 1a). Accordingly, the genomic region in which both replicates exhibited A-compartments or B-compartments was defined as the A-region or B-region, respectively, whereas the genomic region in which different compartments were obtained among the results from two replicates was defined as the M-region.
Figure 1 .

Intragenomic distributions and ratios of A-, B-, and M-regions on autosomal and X chromosomes in ES cells and 2-day cells: (a) Example distribution profiles of A/B compartments in two biological replicates and those of A-, B-, and M-regions on chromosomes 1 and X (4×107 bp to 5×10⁷ bp). The M-regions were broadly distributed on X chromosomes of ES cells but showed decreased distributions in 2-day cells. (b) Ratios of A-, B-, and M-regions on each chromosome. Both ES cells and 2-day differentiated cells contained few M-regions on autosomes. The ratio of the M-region on the X chromosome was larger in ES cells and dramatically reduced in 2-day cells. The NA region is the region with no Hi-C data, which was expected to correspond to the region containing the centromere or telomere.
The M-region was distributed broadly and occupied the largest genomic region among X chromosomes from ES cells (Figure 1b). The epigenetic state of the M-region was expected to change temporally and to exhibit intermediate features of the A- and B-regions on average. By contrast, in 2-day cells, the M-region was dramatically reduced across the entire chromosome, whereas the B-region was increased (Figure 1b). Compared with the X chromosome, the intrachromosomal occupation of the A-, B-, and M-regions did not exhibit large variations in autosomes during this cell differentiation process.
Spatial Distributions of Open/Closed Chromatin Regions on the X Chromosome Changed Following Differentiation
Next, the spatial distributions of A-, B-, and M-regions in each chromosome in ES cells and 2-day cells were measured based on previous results obtained from Hi-C data [28] (https://doi.org/10.5281/zenodo.3371884) and the following procedure: First, the average three-dimensional conformation of each chromosome as the basic conformation was inferred as a polymer by analysis of the Hi-C contact matrices based on a recently proposed consensus method [29–31] implemented in PASTIS as an MDS2 method [32] (see Materials and Methods). Here, since the bin width of the focused Hi-C matrix data was 40 kbp, each monomer composing the polymer was assumed as each local chromatin region with 40 kbp DNA. The position of each monomer in the obtained polymer provided the intrachromosomal spatial position of each region (Supplementary Table S1). Second, the number distributions of monomers with A-, B-, and M-regions as a function of the distance from the center of each chromosome to these monomers (DCC) were evaluated and were, respectively, designated NDA, NDB, and NDM (Figure 2a). NDα was defined as the number of monomers with α-region between DCC–0.05 (μm) and DCC+0.05 (μm). Third, the radial distributions of A-, B-, and M-regions, designated RDA, RDB, and RDM, respectively, and the radial probability distributions of monomers, RPD, for each chromosome were evaluated as a function of DCC, where RDX and RPD were defined as RDX=NDX/4π(DCC)2 (X=A, B, or M) and RPD=(NDA+NDB+NDM)/4π(DCC)2NC (NC=the number of monomers in each chromosome), respectively.
Figure 2 .

Intrachromosomal spatial distributions of open and closed chromatin regions. (a) NDA, NDB, and NDM of chromosome 1 and the X chromosome in ES cells and 2-day cells. Insets show typical distributions of A- (green), B- (red), and M-regions (blue) on chromosome surfaces, as observed from one viewpoint (see data in Supplementary Table S1). (b) Average RPD values and 95% confidence intervals (error bars) for all chromosomes. Stars between two neighboring DCC values indicated that two average RPD values were significantly different (p<0.01 using Welch’s test; p values are plotted in Supplementary Figure S3). (c) RDB+M–A at DCC>1.2 for each chromosome. (d) CL for each chromosome.
The RPDs of chromosomes in both ES cells and 2-day cells exhibited dramatic decreases, with DCC values greater than ~1.2, where the average RPD over all chromosomes showed a significant decrease (DCC≥1.25; Figure 2b, Supplementary Figure S3). Accordingly, monomers showing values of DCC≥1.25 were expected to be localized on the surface of each chromosome.
For DCC≥1.25, RDB+M–A=RDB+RDM–RDA was measured as a function of DCC (Figure 2c), and the chromatin closedness of each chromosome surface (CL=ΣDCC>1.2RDB+M–A) was evaluated in both ES cells and 2-day cells (Figure 2d). From the results, we observed that only X chromosomes in 2-day cells exhibited negative CL values, indicating that the surface of the chromosome was predominantly occupied by open chromatin regions, although other chromosomes were predominantly surrounded by closed or potentially closed chromatin regions.
These results were qualitatively unchanged, even when the basic conformation of each chromosome was inferred using other methods implemented in PASTIS with NMDS, PM1, and PM2 methods [32] (Supplementary Table S2–S4). Therefore, in the following arguments, the polymer constructed by MDS2 method was defined as that of basic conformations of chromosomes.
Simulations of the Coarse-Grained Blob Chain Model Showed Mutual Approach of Xic Pairs in Differentiated Cells
Simulations of models of intranuclear chromosome dynamics in ES cells (ES cell model) and 2-day cells (2-day cell model) were performed using coarse-grained blob chain models. These models were constructed using the previously obtained polymers that gave the basic conformations of chromosomes and the distributions of A-, B-, and M-regions. The populations of monomers successively connected along the polymer were divided into blobs containing local chromatin parts with around 0.1–10 Mbp based on estimations of boundary scores (see Materials and Methods) [28] and appropriate chromosome-dependent characteristic distances along genome sequences. The coordinate and radius of each blob was defined as the centroid coordinate of the blob containing monomers and the standard deviation of the distance from the blob centroid to the monomers, where blob radii were approximately 0.15–1 μm.
Here, the scale of typical blob sizes was similar to that of the persistent length of chromosomes obtained when each chromosome was described as a chain consisting of domains as the units; each domain was defined as a local part of each chromosome divided by the domain boundaries determined by boundary scores (see Materials and Methods). Such chains of blobs provided the basic structure for the coarse-grained model of chromosomes, showing an envelope shape similar to that of the original polymer by elimination of small structural noises expected to be due to the noise of Hi-C data. Additionally, the epigenetic attribute, A, B, or M, of each blob was added based on the epigenetic attributes of monomers contained in each blob (see Materials and Methods) (Figure 3a, b).
Figure 3 .
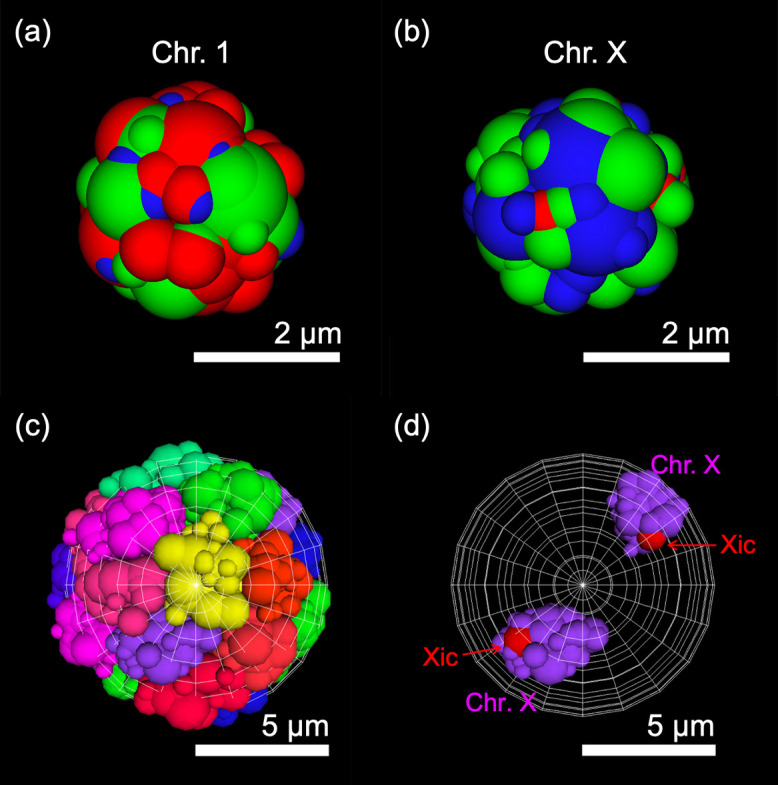
Snapshots of simulations of the coarse-grained blob chain model of chromosomes. (a, b) Examples of snapshots of blob chain models of chromosome 1 (a) and the X chromosome (b) in the ES cell model (see Supplementary Table S5 for results of other chromosomes in both the ES cell and 2-day cell models). Green, red, and blue spheres indicate A-blob, B-blob, and M-blob, respectively. (c, d) Snapshot of all chromosomes in the ES cell model (c) and positioning of two X chromosomes (d). Blob chains with different colors indicate models of different chromosomes.
Each simulation was performed by considering the force required to maintain the basic structure of blob chains and the repulsion between blobs due to their excluded volumes. The A-blob consisted predominantly of open chromatin regions, which were sparse and flexible, whereas the B-blob consisted predominantly of closed chromatin regions, which contained condensed nucleosomes and proteins. Thus, the rigidity of the blob was assumed to increase in the order A < M < B. The nuclear membrane was assumed to be a spherical shell with a radius of 5 μm (Figure 3c, d).
Thirty simulations were performed for both the ES cell model and the 2-day cell model from different initial configurations, and the time course and probability distributions of the distance between two blobs containing Xic regions were plotted (Supplementary Figure S4, Figure 4a). Significantly higher probability values at small distances and significantly smaller probability values at large distances were obtained in the 2-day cell model compared with those in the ES cell model. This result indicated that two blobs with Xic regions in the 2-day cell model tended to approach each other significantly more frequently than those in the ES cell model, consistent with experimental observations [1–4]. The probability distributions of the distance between the pair of X chromosomes also exhibited similar model-dependent features (Figure 4b). By contrast, for most homologous autosomes except chromosomes 4 and 19, the features of the probability distribution of the distances did not show significant changes between ES cell and 2-day cell models (Figure 4c, Supplementary Figure S5).
Figure 4 .

Probability distributions of the distance between the Xic pair and between homologous chromosomes. (a) Average and 95% confidence interval (error bar) of probability distributions of the distance between the pair of blobs containing Xic in the ES cell and 2-day cell models (left), and p values (Welch’s test) between two probability values of the two models at each distance (right). (b, c) The same plots as the left for (a) between an X chromosome pair (b) and between a chromosome 1 pair (c). The average and 95% confidence interval were evaluated using results from 30 simulations for each model. Distances with asterisks indicate that differences in probability values between the two models were significant (p<0.05 using Welch’s test; see also Supplementary Figures S5 and S6).
Discussion
From simulations of the coarse-grained model of intranuclear chromosome dynamics, we found that two X chromosomes approached each other more frequently in the 2-day cell model than in the ES cell model. This result was consistent with recently reported experiments [1–4].
Now, we will consider the driving force that promotes this intranuclear phenomenon based on the mechanical properties of chromosomes given by their intrastructural epigenetic features. Analysis of Hi-C data revealed that the X chromosome showed dramatic changes in its epigenetic state during the differentiation process, as follows. The chromatin region, for which the epigenetic state was not determined, was stably distributed broadly in X chromosomes in ES cells. These unstable regions could also be regarded as potential closed chromatin regions. By contrast, in all chromosomes in 2-day cells, most chromatin regions were stably open or closed. Additionally, both open chromatin regions and (true and potential) closed chromatin regions were also located at the surface of the X chromosome in ES cells, whereas an open-chromatin-dominant region was predominantly located at the surface of the X chromosome in 2-day cells. Autosomes exhibited minor changes in such structural epigenetic states during differentiation.
In 2-day cells, X chromosomes were predominantly surrounded by open chromatin regions, whereas the surfaces of autosomes were predominantly occupied by closed chromatin regions. Note that the volume fraction of chromatin fiber and their binding proteins in closed chromatin regions were naturally expected to be larger than that of open chromatin regions. Thus, X chromosomes and autosomes may be regarded as soft and rigid objects, respectively, and repulsion caused by the excluded volume between X chromosomes was much weaker than that between other chromosome pairs. Therefore, the pair of adjoining X chromosomes could form a more compact shape, providing a larger intranuclear space for the other chromosomes. Thus, the number of states correlating with the entropy of the system was expected to be larger when two X chromosomes were spatially close than when other chromosomes were located between the X chromosomes. This can easily be visualized using a simple lattice-block model consisting of soft and rigid blocks allowing the number of states to be immediately estimated (Figure 5). This entropic effect was expected to be the driving force for the mutual approach of X chromosomes, similar to the force known as depletion force [38–40] or to that inducing the phase separation of polymers with different rigidities [22,41–45].
Figure 5 .

Illustrations showing the simple 1-d lattice-block model consisting of soft and rigid blocks providing an intuitive understanding of the mechanism by which X chromosomes tend to exhibit mutual approach in 2-day cell model. (a) The model consists of nine sites with edge walls, two yellow blocks, and two green blocks. It is assumed that the width of each block=2 sites, and that two soft blocks can overlap with each other by half (1 site). (b) Illustrations of all states when all blocks were assumed to be rigid blocks. The number of all states was obtained as 30, and the number of states that two green blocks contact (or overlap) with each other was obtained as 12. Therefore, the probability that two green blocks contact (or overlap) with each other was estimated to be 12/30=0.4. (c) Illustrations of all states when green and yellow blocks were respectively assumed as soft and rigid blocks, and two green blocks overlap with each other. By the combination of states in (b) and (c), when the increase in the potential energy with the overlap between two green blocks was assumed to be U, the probability that two green blocks make contact or overlap with each other was estimated as (12+30e–U/kBT)/(30+30e–U/kBT)>0.4 (kB is the Boltzmann constant, and T is the temperature). This probability approaches 42/60=0.7 for U→0. These facts suggested that when two green blocks were soft, like the X chromosomes in the 2-day cell model, mutual approaches occur more frequently than when the green blocks were rigid like the X chromosomes in the ES cell model.
In ES cells, the large area of the X chromosome surface was occupied by closed and potentially closed chromatin regions. Thus, the excluded volume effect between X chromosomes in ES cells was not higher than that between other chromosome pairs but was sufficiently higher than that between X chromosomes in 2-day cells. Based on this, we concluded that the mutual approach of X chromosomes occurred less frequently in ES cells than in 2-day cells because of weakening of this driving force owing to entropic effects.
One study suggested the attractive interactions among B-regions mediated by multivalent heterochromatin binding proteins determine both intra- and inter-chromosome configuration [46]. The present study did not consider the effects of such proteins. These effects enhance the aggregation of autosomes promoting separation between autosomes and X-chromosomes; however, the pairing of X-chromosomes in the 2-day cell model might be more enhanced if such effects were added to the present model.
The main purpose of this study was to explore the driving force of nucleus-wide chromosome migration, resulting in X chromosome pairing, which preceded the local short-range interaction between two Xic pairs through specific molecules such as Xist and Tsix RNAs. Thus, any effect of Xist RNA was not considered explicitly. It should also be noted that the detailed structural dynamics of the local chromatin region around Xics could not be revealed by the present model because of the larger characteristic scale of blobs than those of TADs or chromatin compartments. From a combination of the current model and other recently proposed models of Xic interactions based on microscopic molecular processes [6–12], a model may be developed to explain all processes involved in Xic pairing and stabilization.
Additionally, recent experimental data have demonstrated that Xic tends to localize to the nuclear periphery owing to the association between lamin-binding receptors (Lbrs) and Xist RNA; this tendency is weakened by the inhibition of Xist RNA [47]. Because our current model did not consider the effects of such RNA, Xic did not exhibit strong specific localization to the nuclear periphery (Supplementary Figure S7), consistent with recent experiments. In future studies, a modified model with nontrivial interactions between Xic and the nuclear periphery through the Lbr-Xist association and the Xist-Tsix-driven inter-Xic interaction should be developed to consider the entirety of Xic behaviors during the early differentiation process of ES cells.
In the present study, two biological replicates of Hi-C data of ES and 2-day cells were analyzed. The positioning of A- and B-regions in autosomes of ES cells and all chromosomes of 2-day cells was considered robust because the A/B compartment profiles were well matched over a wide range of chromosomes between two biological replicates. Conversely, the A/B compartment profiles of X chromosomes in ES cells were unstable and formed a wide range of M regions. In these chromosomes, the A/B compartment profiles might change temporally and/or exhibit large cell-dependent variability. In this case, M or M-like regions may expand in X chromosomes in ES cells with an increase in biological replicates of the Hi-C data. This conjecture should be verified in future studies.
The present results of Hi-C data analysis suggested the surfaces of chromosomes, except X-chromosomes, in 2-day cells were predominantly occupied by closed chromatin regions. Such features seem to contradict the microscopic observation that various cells in mouse fetal liver [48] that open chromatin regions tend to gather near-surface on the chromosome surface. This difference in intrachromosomal structure may be due to the difference in the stage of cell differentiation between ES or early-differentiated cells and cells in the tissue. To validate this conjecture, the detailed microscopic imaging analysis of ES and early-differentiated cells should be performed in the future. Additionally, the viscoelastic features of A- and B-regions on chromosome surfaces should be inferred experimentally in the future, which might be estimated by the live imaging observations of diffusive motions of loci in these regions based on the arguments of polymer rheology.
The simulation of the coarse-grained blob chain model of chromosomes demonstrated that not only X chromosomes but also chromosomes 4 and 19 showed significant changes in the profiles of the probability distribution of distance between the pair of homologous chromosomes between ES cell and 2-day cell models (Supplementary Figure S5). However, the mechanism of such behaviors of chromosomes 4 and 19 was still unclear differently from that for the X chromosome. Theoretical studies as well as experimental verification of this phenomenon should also be conducted.
Conclusion
Overall, intrachromosomal structural epigenetic features and their changes play important roles in regulating intranuclear positioning and transitions. Application of such arguments is expected to provide important insights into the mechanisms underlying cell species- and cell cycle-dependent behaviors of intranuclear architecture.
Conflict of Interest
The authors declare that they have no competing interests.
Author Contributions
T.K. and A.A. conceived and designed the study; T.K. and A.A. conducted the mathematical model construction and simulations; T.K., M.F., and A.A. analyzed the data; T.K, M.F., and A.A. wrote the manuscript.
A preliminary version of this work, doi: 10.1101/2021.10.25.465811, was deposited in the bioRxiv on October 26, 2021.
Acknowledgements
Computations were partially performed on the NIG supercomputer at ROIS National Institute of Genetics. This work was supported by JSPS KAKENHI grants (award numbers 17K05614 and 21K06124 to A.A. and 19K20382 to M.F).
Supplementary Material
References
- [1].Bacher, C. P., Guggiari, M., Brors, B., Augui, S., Clerc, P., Avner, P., et al. Transient colocalization of X-inactivation centres accompanies the initiation of X inactivation. Nat. Cell Biol. 8, 293–299 (2006). https://doi.org/10.1038/ncb1365 [DOI] [PubMed] [Google Scholar]
- [2].Xu, N., Tsai, C.-L., Lee, J. T.. Transient homologous chromosome pairing marks the onset of X inactivation. Science 311, 1149–1152 (2006). https://doi.org/10.1126/science.1122984 [DOI] [PubMed] [Google Scholar]
- [3].Masui, O., Bonnet, I., Le Baccon, P., Brito, I., Pollex, T., Murphy, N., et al. Live-cell chromosome dynamics and outcome of X chromosome pairing events during ES cell differentiation. Cell 145, 447–458 (2011). https://doi.org/10.1016/j.cell.2011.03.032 [DOI] [PMC free article] [PubMed] [Google Scholar]
- [4].Pollex, T., Heard, E.. Nuclear positioning and pairing of X-chromosome inactivation centers are not primary determinants during initiation of random X-inactivation. Nat. Genet. 51, 285–295 (2019). https://doi.org/10.1038/s41588-018-0305-7 [DOI] [PMC free article] [PubMed] [Google Scholar]
- [5].Payer, B., Lee, J. T.. X chromosome dosage compensation: How mammals keep the balance. Annu. Rev. Genet. 42, 733–772 (2008). https://doi.org/10.1146/annurev.genet.42.110807.091711 [DOI] [PubMed] [Google Scholar]
- [6].Nicodemi, M., Prisco, A.. Symmetry-breaking model for X-chromosome inactivation. Phys. Rev. Lett. 98, 108104 (2007). https://doi.org/10.1103/PhysRevLett.98.108104 [DOI] [PubMed] [Google Scholar]
- [7].Nicodemi, M., Prisco, A.. Self-assembly and DNA binding of the blocking factor in X chromosome inactivation. PLoS Comput. Biol. 3, e210 (2007). https://doi.org/10.1371/journal.pcbi.0030210 [DOI] [PMC free article] [PubMed] [Google Scholar]
- [8].Scialdone, A., Nicodemi, M.. Mechanics and dynamics of X-chromosome pairing at X inactivation. PLoS Comput. Biol. 4, e1000244 (2008). https://doi.org/10.1371/journal.pcbi.1000244 [DOI] [PMC free article] [PubMed] [Google Scholar]
- [9].Scialdone, A., Nicodemi, M.. DNA loci cross-talk through thermodynamics. J. Biomed. Biotechnol. 2009, 1–8 (2009). https://doi.org/10.1155/2009/516723 [DOI] [PMC free article] [PubMed] [Google Scholar]
- [10].Scialdone, A., Cataudella, I., Barbieri, M., Prisco, A., Nicodemi, M.. Conformation regulation of the X chromosome inactivation center: A model. PLoS Comput. Biol. 7, e1002229 (2011). https://doi.org/10.1371/journal.pcbi.1002229 [DOI] [PMC free article] [PubMed] [Google Scholar]
- [11].Bianco, V., Scialdone, A., Nicodemi, M.. Colocalization of multiple DNA loci: a physical mechanism. Biophys. J. 103, 2223–2232 (2012). https://doi.org/10.1016/j.bpj.2012.08.056 [DOI] [PMC free article] [PubMed] [Google Scholar]
- [12].Mutzel, V., Okamoto, I., Dunkel, I., Saitou, M., Giorgetti, L., Heard, E., et al. A symmetric toggle switch explains the onset of random X inactivation in different mammals. Nat. Struct. Mol. Biol. 26, 350–360 (2019). https://doi.org/10.1038/s41594-019-0214-1 [DOI] [PMC free article] [PubMed] [Google Scholar]
- [13].Cremer, T., Cremer, M., Hübner, B., Silahtaroglu, A., Hendzel, M., Lanctôt, C., et al. The interchromatin compartment participates in the structural and functional organization of the cell nucleus. BioEssays 42, e1900132 (2020). https://doi.org/10.1002/bies.201900132 [DOI] [PubMed] [Google Scholar]
- [14].Croft, J. A., Bridger, J. M., Boyle, S., Perry, P., Teague, P., Bickmore, W. A.. Differences in the localization and morphology of chromosomes in the human nucleus. J. Cell Biol. 145, 1119–1131 (1999). https://doi.org/10.1083/jcb.145.6.1119 [DOI] [PMC free article] [PubMed] [Google Scholar]
- [15].Habermann, F. A., Cremer, M., Walter, J., Kreth, G., von Hase, J., Bauer, K., et al. Arrangements of macro- and microchromosomes in chicken cells. Chromosome Res. 9, 569–584 (2001). https://doi.org/10.1023/a:1012447318535 [DOI] [PubMed] [Google Scholar]
- [16].Boyle, S., Gilchrist, S., Bridger, J. M., Mahy, N. L., Ellis, J. A., Bickmore, W. A.. The spatial organization of human chromosomes within the nuclei of normal and emerin-mutant cells. Hum. Mol. Genet. 10, 211–219 (2001). https://doi.org/10.1093/hmg/10.3.211 [DOI] [PubMed] [Google Scholar]
- [17].Tanabe, H., Muller, S., Neusser, M., von Hase, J., Calcagno, E., Cremer, M., et al. Evolutionary conservation of chromosome territory arrangements in cell nuclei from higher primates. Proc. Natl. Acad. Sci. U.S.A. 99, 4424–4429 (2002). https://doi.org/10.1073/pnas.072618599 [DOI] [PMC free article] [PubMed] [Google Scholar]
- [18].Mayer, R., Brero, A., von Hase, J., Schroeder, T., Cremer, T., Dietzel, S.. Common themes and cell type specific variations of higher order chromatin arrangements in the mouse. BMC Cell Biol. 6, 44 (2005). https://doi.org/10.1186/1471-2121-6-44 [DOI] [PMC free article] [PubMed] [Google Scholar]
- [19].Neusser, M., Schubel, V., Koch, A., Cremer, T., Müller, S.. Evolutionarily conserved, cell type and species-specific higher order chromatin arrangements in interphase nuclei of primates. Chromosoma 116, 307–320 (2007). https://doi.org/10.1007/s00412-007-0099-3 [DOI] [PubMed] [Google Scholar]
- [20].Solovei, I., Kreysing, M., Lanctôt, C., Kösem, S., Peichl, L., Cremer, T., et al. Nuclear architecture of rod photoreceptor cells adapts to vision in mammalian evolution. Cell 137, 356–368 (2009). https://doi.org/10.1016/j.cell.2009.01.052 [DOI] [PubMed] [Google Scholar]
- [21].Koehler, D., Zakhartchenko, V., Froenicke, L., Stone, G., Stanyon, R., Wolf, E., et al. Changes of higher order chromatin arrangements during major genome activation in bovine preimplantation embryos. Exp. Cell Res. 315, 2053–2063 (2009). https://doi.org/10.1016/j.yexcr.2009.02.016 [DOI] [PubMed] [Google Scholar]
- [22].Finan, K., Cook, P. R., Marenduzzo, D.. Non-specific (entropic) forces as major determinants of the structure of mammalian chromosomes. Chromosom Res. 19, 53–61 (2011). https://doi.org/10.1007/s10577-010-9150-y [DOI] [PubMed] [Google Scholar]
- [23].Solovei, I., Wang, A. S., Thanisch, K., Schmidt, C. S., Krebs, S., Zwerger, M., et al. LBR and lamin A/C sequentially tether peripheral heterochromatin and inversely regulate differentiation. Cell 152, 584–598 (2013). https://doi.org/10.1016/j.cell.2013.01.009 [DOI] [PubMed] [Google Scholar]
- [24].Ganai, N., Sengupta, S., Menon, G. I.. Chromosome positioning from activity-based segregation. Nucleic Acids Res. 42, 4145–4159 (2014). https://doi.org/10.1093/nar/gkt1417 [DOI] [PMC free article] [PubMed] [Google Scholar]
- [25].Awazu, A. Nuclear dynamical deformation induced hetero- and euchromatin positioning. Phys. Rev. E Stat. Nonlin. Soft Matter Phys. 92, 032709 (2015). https://doi.org/10.1103/PhysRevE.92.032709 [DOI] [PubMed] [Google Scholar]
- [26].Lee, S. S., Tashiro, S., Awazu, A., Kobayashi, R.. A new application of the phase-field method for understanding the mechanisms of nuclear architecture reorganization. J. Math. Biol. 74, 333–354 (2017). https://doi.org/10.1007/s00285-016-1031-3 [DOI] [PMC free article] [PubMed] [Google Scholar]
- [27].Takao, K., Takamiya, K., Ding, D.-Q., Haraguchi, T., Hiraoka, Y., Nishimori, H., et al. Torsional turning motion of chromosomes as an accelerating force to align homologous chromosomes during meiosis. J. Phys. Soc. Jpn. 88, 023801 (2019). https://doi.org/10.7566/JPSJ.88.023801 [Google Scholar]
- [28].Miura, H., Takahashi, S., Poonperm, R., Tanigawa, A., Takebayashi, S.-I., Hiratani, I.. Single-cell DNA replication profiling identifies spatiotemporal developmental dynamics of chromosome organization. Nat. Genet. 51, 1356–1368 (2019). https://doi.org/10.1038/s41588-019-0474-z [DOI] [PubMed] [Google Scholar]
- [29].Baù, D., Sanyal, A., Lajoie, B. R., Capriotti, E., Byron, M., Lawrence, J. B., et al. The three-dimensional folding of the α-globin gene domain reveals formation of chromatin globules. Nat. Struct. Mol. Biol. 18, 107–114 (2011). https://doi.org/10.1038/nsmb.1936 [DOI] [PMC free article] [PubMed] [Google Scholar]
- [30].Duan, Z., Andronescu, M., Schutz, K., Mcllwain, S., Kim, Y. J., Lee, C., et al. A three-dimensional model of the yeast genome. Nature 465, 363–367 (2010). https://doi.org/10.1038/nature08973 [DOI] [PMC free article] [PubMed] [Google Scholar]
- [31].Tanizawa, H., Iwasaki, O., Tanaka, A., Capizzi, J. R., Wickramasinghe, P., Lee, M., et al. Mapping of long-range associations throughout the fission yeast genome reveals global genome organization linked to transcriptional regulation. Nucleic Acids Res. 38, 8164–8177 (2010). https://doi.org/10.1093/nar/gkq955 [DOI] [PMC free article] [PubMed] [Google Scholar]
- [32].Varoquaux, N., Ay, F., Noble, W. S., Vert, J.-P.. A statistical approach for inferring the 3D structure of the genome. Bioinformatics 30, i26–i33 (2014). https://doi.org/10.1093/bioinformatics/btu268 [DOI] [PMC free article] [PubMed] [Google Scholar]
- [33].Johnstone, S. E., Reyes, A., Qi, Y., Adriaens, C., Hegazi, E., Pelka, K., et al. Large-scale topological changes restrain malignant progression in colorectal cancer. Cell 182, 1474–1489 (2020). https://doi.org/10.1016/j.cell.2020.07.030 [DOI] [PMC free article] [PubMed] [Google Scholar]
- [34].Zhou, Q., Fidalgo, J., Calvi, L., Bernabeu, M. O., Hoskins, P. R., Oliveira, M. S. N., et al. Spatiotemporal dynamics of dilute red blood cell suspensions in low-inertia microchannel flow. Biophys. J. 118, 2561–2573 (2020). https://doi.org/10.1016/j.bpj.2020.03.019 [DOI] [PMC free article] [PubMed] [Google Scholar]
- [35].Lappala, A., Wang, C.-Y., Kriz, A., Michalk, H., Tan, K., Lee, J. T., et al. Four-dimensional chromosome reconstruction elucidates the spatiotemporal reorganization of the mammalian X chromosome. Proc. Natl. Acad. Sci. U.S.A. 118, e2107092118 (2021). https://doi.org/10.1073/pnas.2107092118 [DOI] [PMC free article] [PubMed] [Google Scholar]
- [36].Banigan, E. J., van den Berg, A. A., Brandão, H. B., Marko, J. F., Mirny, L. A.. Chromosome organization by one-sided and two-sided loop extrusion. eLife 9, e53558 (2020). https://doi.org/10.7554/eLife.53558 [DOI] [PMC free article] [PubMed] [Google Scholar]
- [37].Lieberman-Aiden, E., van Berkum, N. L., Williams, L., Imakaev, M., Ragoczy, T., Telling, A., et al. Comprehensive mapping of long-range interactions reveals folding principles of the human genome. Science 326, 289–293 (2009). https://doi.org/10.1126/science.1181369 [DOI] [PMC free article] [PubMed] [Google Scholar]
- [38].Asakura, S., Oosawa, F.. On interaction between two bodies immersed in a solution of macromolecules. J. Chem. Phys. 22, 1255–1256 (1954). https://doi.org/10.1063/1.1740347 [Google Scholar]
- [39].Marenduzzo, D., Finan, K., Cook, P. R.. The depletion attraction: An underappreciated force driving cellular organization. J. Cell Biol. 175, 681–686 (2006). https://doi.org/10.1083/jcb.200609066 [DOI] [PMC free article] [PubMed] [Google Scholar]
- [40].Zosel, F., Soranno, A., Buholzer, K. J., Nettels, D., Schuler, B.. Depletion interactions modulate the binding between disordered proteins in crowded environments. Proc. Natl. Acad. Sci. U.S.A. 117, 13480–13489 (2020). https://doi.org/10.1073/pnas.1921617117 [DOI] [PMC free article] [PubMed] [Google Scholar]
- [41].Adhikari, N. P., Auhl, R., Straube, E.. Interfacial properties of flexible and semiflexible polymers. Macromol Theory Simul. 11, 315–325 (2002). https://doi.org/10.1002/1521-3919(20020301)11:3<315::AID-MATS315>3.0.CO;2-6 [Google Scholar]
- [42].Egorov, S. A., Milchev, A., Nikoubashman, A., Binder, K.. Phase separation and nematic order in lyotropic solutions: two types of polymers with different stiffnesses in a common solvent. J. Phys. Chem. B 125, 956–969 (2021). https://doi.org/10.1021/acs.jpcb.0c10411 [DOI] [PubMed] [Google Scholar]
- [43].Milchev, A., Egorov, S. A., Midya, J., Binder, K., Nikoubashman, A.. Entropic unmixing in nematic blends of semiflexible polymers. ACS Macro Lett. 9, 1779–1784 (2020). https://doi.org/10.1021/acsmacrolett.0c00668 [DOI] [PubMed] [Google Scholar]
- [44].Fujishiro, S., Sasai, M. Generation of dynamic three-dimensional genome structure through phase separation of chromatin. bioRxiv (2021). https://doi.org/10.1101/2021.05.06.443035 [DOI] [PMC free article] [PubMed]
- [45].Nakahata, S., Komoto, T., Fujii, M., Awazu, A.. Mathematical model of chromosomal dynamics during DNA double strand break repair in budding yeast. Biophys. Physicobiol. 19, e190012 (2022). https://doi.org/10.2142/biophysico.bppb-v19.0012 [DOI] [PMC free article] [PubMed] [Google Scholar]
- [46].Falk, M., Feodorova, Y., Naumova, N., Imakaev, M., Lajoie, B. R., Leonhard, H., et al. Heterochromatin drives compartmentalization of inverted and conventional nuclei. Nature 570, 395–399 (2019). https://doi.org/10.1038/s41586-019-1275-3 [DOI] [PMC free article] [PubMed] [Google Scholar]
- [47].Chen, C.-K., Blanco, M., Jackson, C., Aznauryan, E., Ollikainen, N., Surka, C., et al. Xist recruits the X chromosome to the nuclear lamina to enable chromosome-wide silencing. Science 354, 468–472 (2016). https://doi.org/10.1126/science.aae0047 [DOI] [PubMed] [Google Scholar]
- [48].Liu, M., Lu, Y., Yang, B., Chen, Y., Radda, J. S. D., Hu, M., et al. Multiplexed imaging of nucleome architectures in single cells of mammalian tissue. Nat. Commun. 11, 1–14 (2020). https://doi.org/10.1038/s41467-020-16732-5 [DOI] [PMC free article] [PubMed] [Google Scholar]
Associated Data
This section collects any data citations, data availability statements, or supplementary materials included in this article.