

Abstract
Inactivating mutations in the PPT1 gene encoding palmitoyl-protein thioesterase-1 (PPT1) underlie the CLN1 disease, a devastating neurodegenerative lysosomal storage disorder. The mechanism of pathogenesis underlying CLN1 disease has remained elusive. PPT1 is a lysosomal enzyme, which catalyzes the removal of palmitate from S-palmitoylated proteins (constituents of ceroid lipofuscin) facilitating their degradation and clearance by lysosomal hydrolases. Thus, it has been proposed that Ppt1-deficiency leads to lysosomal accumulation of ceroid lipofuscin leading to CLN1 disease. While S-palmitoylation is catalyzed by palmitoyl acyltransferases (called ZDHHCs), palmitoyl-protein thioesterases (PPTs) depalmitoylate these proteins. We sought to determine the mechanism by which Ppt1-deficiency may impair lysosomal degradative function leading to INCL pathogenesis. Here we report that in Ppt1−/− mice, which mimic CLN1 disease, low level of inositol 3-phosphate receptor-1 (IP3R1) that mediates Ca++-transport from the ER to the lysosome dysregulated lysosomal Ca++ homeostasis. Intriguingly, the transcription factor NFATC4, which regulates IP3R1-expression, required S-palmitoylation for trafficking from the cytoplasm to the nucleus. We identified two palmitoyl acyltransferases, ZDHHC4 and ZDHHC8, which catalyzed S-palmitoylation of NFATC4. Notably, in Ppt1−/− mice, reduced ZDHHC4 and ZDHHC8 levels markedly lowered S-palmitoylated NFATC4 (active) in the nucleus, which inhibited IP3R1-expression, thereby, dysregulating lysosomal Ca++ homeostasis. Consequently, Ca++-dependent lysosomal enzyme activities were markedly suppressed. Impaired lysosomal degradative function impaired autophagy, which caused lysosomal storage of undigested cargo. Importantly, IP3R1-overexpression in Ppt1−/− mouse fibroblasts ameliorated this defect. Our results reveal a previously unrecognized role of Ppt1 in regulating lysosomal Ca++-homeostasis and suggest that this defect contributes to pathogenesis of CLN1 disease.
Keywords: Neurodegeneration, Lysosomal storage disease, Neuronal ceroid lipofuscinosis, Batten disease, Infantile neuronal ceroid lipofuscinosis, Palmitoyl-protein thioesterase-1, S-palmitoylation
Introduction
The lysosome1 is an organelle long known for mediating degradation and clearance of cellular waste. In recent years, it has emerged as a highly dynamic structure that also plays important roles in cell metabolism in response to environmental cues2. Impaired lysosomal degradative function leads to a family of ~60 inherited diseases called lysosomal storage disorders (LSDs)3–5. Dysregulation of cellular Ca++ homeostasis is reported to play important roles in the pathogenesis of several human diseases including the LSDs6. Defective lysosomal Ca++ homeostasis has also been reported to impair autophagy7–9. In most of the LSDs, defective autophagy leads to neurodegeneration8, 10. Neuronal ceroid lipofuscinoses (NCLs), commonly known as Batten disease11–14, constitute a group of the most common neurodegenerative LSDs caused by mutations in at least 13 different genes (called CLNs)15, 16. Among all the NCLs, infantile neuronal ceroid lipofuscinosis (INCL)17 is one of the most lethal neurodegenerative LSD, caused by mutations in the PPT1 gene18. The PPT1 gene encodes palmitoyl-protein thioesterase-1 (PPT1)19, a lysosomal depalmitoylating enzyme that catalyzes the removal of fatty acids (generally palmitic acid) from S-palmitoylated proteins (constituents of ceroid lipofuscin) 19, 20.
S-palmitoylation (also called S-acylation) is a reversible posttranslational modification of proteins in which a 16-carbon saturated fatty acid (generally palmitic acid) is attached to specific cysteine residues in polypeptides via thioester linkage21–23. S-palmitoylation, like phosphorylation, has emerged as an important posttranslational modification essential for the regulation of function of numerous important proteins22, 23. It confers hydrophobicity to soluble proteins promoting membrane-anchorage, protein-protein interactions, and protein trafficking22, 23. However, the S-palmitoylated proteins also require depalmitoylation to detach from the membrane or other interacting proteins to recycle or to undergo degradation and clearance by lysosomal hydrolases20. Thus, dynamic palmitoylation (palmitoylation-depalmitoylation)24, like phosphorylation-dephosphorylation, plays critical roles in regulating the functions of many important proteins, especially in the central nervous system23. In mammals, S-palmitoylation is catalyzed by a family of 23 palmitoyl acyltransferases (PATs)25. These zinc finger (Z) proteins share a common epitope consisting of Asp-His-His-Cys (DHHC) and are called ZDHHC-PATs or simply ZDHHCs22, 23, 25. Dynamic S-palmitoylation24 requires coordinated actions of both ZDHHCs25 and thioesterases26. Mutations in either ZDHHCs and/or thioesterases contribute to human diseases22, 23. This notion is supported by the fact that mutations in a lysosomal thioesterase, PPT1, cause a neurodegenerative LSD, CLN1 disease18 and mutations in ZDHHC9, a palmitoyl acyltransferase, causes X-linked mental retardation27. Moreover, targeted disruption of the Ppt1 gene in mice28 recapitulates human INCL phenotype29. Previously, we reported that Ppt1−/− mice manifest severe endoplasmic reticulum (ER)-stress leading to unfolded protein response and neuronal apoptosis30. The ER is the major Ca++repository in the cell31 and Ca++ plays a key regulatory role in autophagy32. Autophagy is an intracellular degradative process that requires Ca++-dependent lysosomal hydrolases for the degradation and clearance of the cargo contained in autophagosomes.
Lysosomal Ca++homeostasis is mediated by inositol 3-phosphate receptor 1(IP3R1)-mediated transport of Ca++ from the ER to the lysosome33. It has also been reported that selective interaction of IP3Rs with the ER-lysosome contact sites is required for the delivery of Ca++ to the lysosome34. Moreover, antagonists of IP3Rs rapidly and completely block lysosomal Ca++-refilling35. Interestingly, IP3R1 has been reported to undergo S-palmitoylation for regulating Ca++ flux in immune cells36. Furthermore, disruption of Ca++ homeostasis may dysregulate neurotransmitter release37 contributing to neurodegeneration. Even though several mutant CLN genes (CLN1-CLN14) underlie various forms of NCLs, the physiological functions of these genes and how mutations in these genes contribute to NCL pathogenesis have remained unclear. Autophagy is impaired by dysregulation of Ca++homeostasis in many LSDs8, 9, 37 including Ppt1−/− mice38. We sought to test a hypothesis that PPT1-mutations may dysregulate lysosomal Ca++homeostasis and suppress the catalytic activities of Ca++-dependent lysosomal hydrolases, which impair the degradation of undigested cargo in autophagosomes causing neuropathology in CLN1 disease.
Results
Defective lysosomal Ca++-homeostasis in cultured fibroblasts from INCL patients
The PPT1 gene is ubiquitously expressed in all tissues and cell types39. Therefore, to determine whether lysosomal Ca++-homeostasis is dysregulated in CLN1 disease, we first measured lysosomal Ca++ release using cultured INCL fibroblasts and compared the results with that in normal fibroblasts. More specifically, we used some pharmacological agents which are known to induce Ca++ release from the acidic compartments such as the lysosome. Gly-Phe β-naphthylamide (GPN)6 is one of them which permeabilizes lysosomal membrane by acting on cathepsin C, releasing Ca++ from lysosome. When GPN was added in the normal cells, it showed a significant Ca++ release compared to INCL cells (Figure 1A). We also used Bafilomycin A1 (an inhibitor of the vacuolar-ATPase) or NAADP-AM, a cell membrane-permeable derivative of nicotinamide adenine dinucleotide phosphate (NAADP)40 which trigger Ca++ release from lysosomes by acting on Ca++ release channels on the lysosomes. Our results showed that Ca++-release from INCL fibroblasts by these two agents was also markedly lower compared with that from normal control fibroblasts (Figure 1B – 1C). These results suggested that the level of lysosomal Ca++ is lower in the INCL cells compared with that of their normal counterparts attributing the defects of lysosomal Ca++ homeostasis from INCL patients.
FIGURE 1. Defective lysosomal calcium homeostasis in INCL fibroblasts.
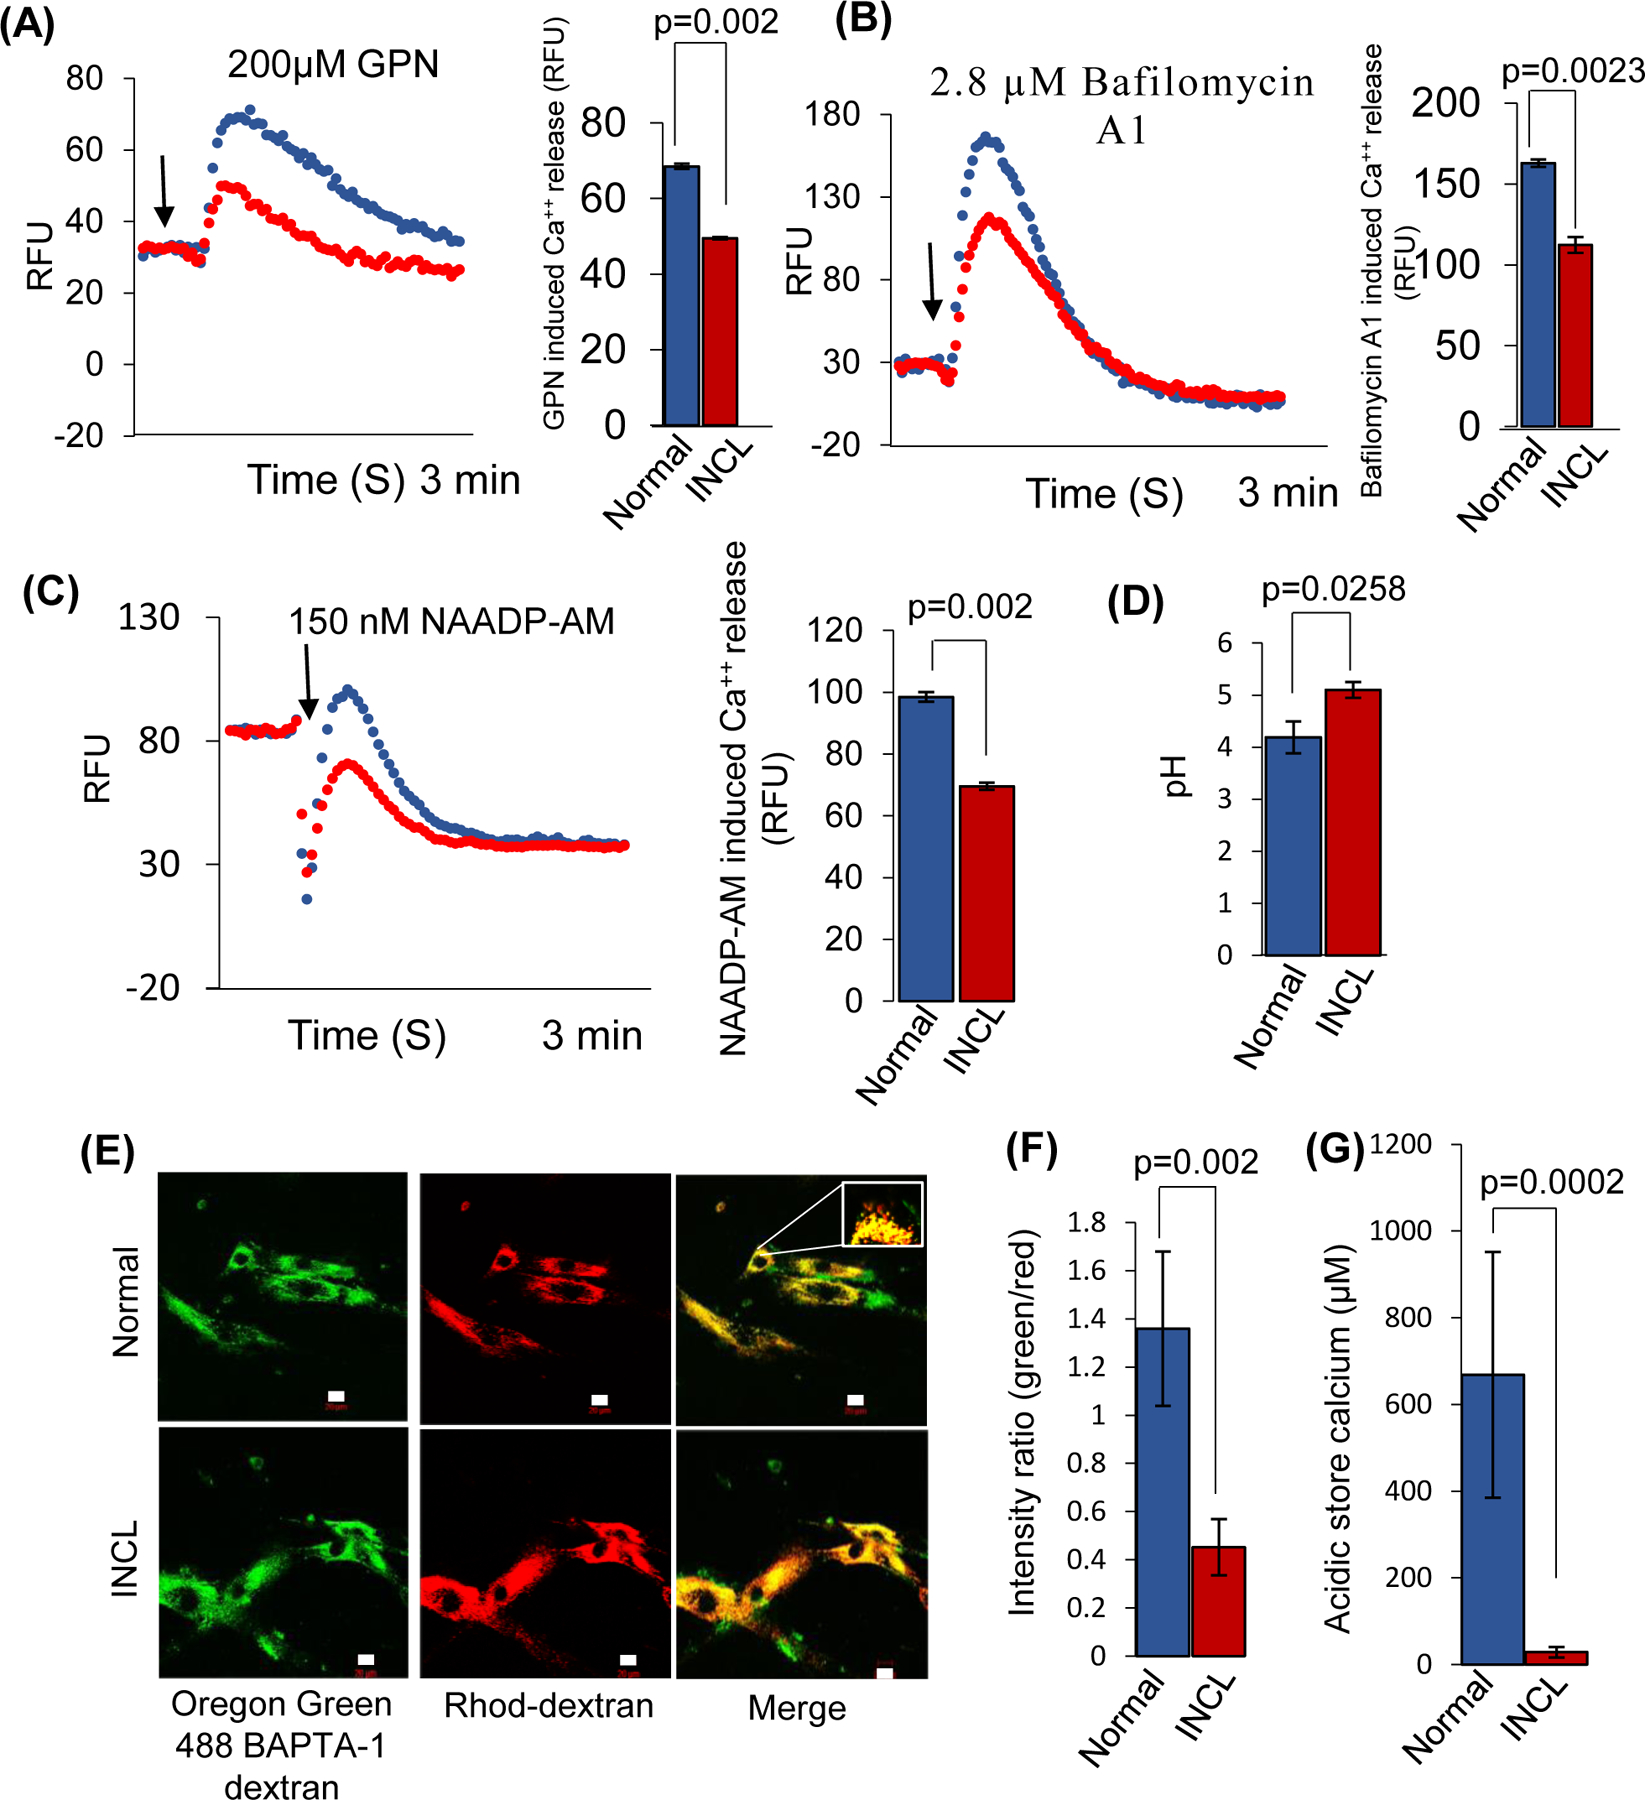
Normal and INCL fibroblasts, respectively, were loaded with the dye provided by FLIPR® Calcium 6 Assay Kit. The cells were then treated with the indicated pharmacological agents, GPN (A), Bafilomycin A1 (B) and NAADP-AM (C) to release Ca++ at the specified time shown by an arrow. Note that all the pharmacological agents used elevated cytosolic Ca++ in normal fibroblasts (blue) but not in INCL fibroblasts (red). The curves shown here are the mean of three independent measurements for both normal and INCL fibroblasts. The corresponding bar graph shows quantification of Ca++ release induced by the pharmacological agents from the normal and INCL fibroblasts (data are presented as the mean (n = 3) ± SD, p<0.05). (D), Lysosomal pH in normal and INCL fibroblasts. Note that the lysosomal pH in INCL fibroblasts is significantly higher compared with that in normal fibroblasts (Normal: ~ 4.2 versus INCL: ~ 5.2, n= 3, p<0.05). (E), Confocal imaging showing intralumenal Ca++ in normal and INCL fibroblasts; Green, Ca++-sensitive Oregon Green 488 BAPTA-1 dextran (OGD); Red, Ca++-insensitive Rhod-dextran; Inset in the right panel shows colocalization of the two dyes in lysosomes (n=30 for normal and n=30 for INCL, p<0.05; scale bars 20 µm). (F), Intensity ratio of green vs red fluorescence from Normal and INCL fibroblasts. (G), Ca++ concentration in the intralumenal acidic compartment in normal and INCL fibroblasts. Note that lysosomal Ca++ in INCL fibroblasts is substantially lower compared with that in normal fibroblasts (n=30 for normal and n=30 for INCL, p<0.05).
Lysosomal Ca++-levels in various organelles are significantly lower in INCL fibroblasts
Since endoplasmic reticulum (ER) is the major Ca++repository in the cell, we sought to determine whether the release of Ca++ from the ER in INCL fibroblasts is altered. Accordingly, we treated the cells with 10µM of ionomycin or 2.8 µM thapsigargin both of which induce Ca++- release from the ER41 and measured the Ca++ efflux. We found that there was a significant reduction in the release of Ca++ from INCL fibroblasts compared with that from normal controls (Figure S1A and S1B). To confirm these results, we measured the lysosomal Ca++ levels in INCL fibroblasts using dextran-conjugated fluorescent Ca++ probe (Oregon Green™ 488 BAPTA-1 dextran), which binds to Ca++ in the lysosome. Since the Kd of this Ca++ probe varies with varying pH of the buffers used to determine lysosomal Ca++concentration, we first determined the lysosomal pH in normal and INCL fibroblasts using Lyso Sensor Yellow/Blue DND-160 as the pH probe42. First, we qualitatively assessed the lysosomal pH in normal and INCL fibroblasts using a pH-sensitive fluorescent probe, Lyso Sensor™ Green DND-18943. In this method, the fluorescence intensity of the probe inversely correlates with the lysosomal pH. We found that compared with the normal fibroblasts (Figure S1C) the INCL fibroblasts had a markedly reduced fluorescence intensity (Figure S1D), indicating elevated lysosomal pH. To further confirm these results, we performed a quantitative fluorometric assay using DND-160, which allowed us to generate a standard curve (Figure S1E). Using this standard curve, we determined the lysosomal pH in normal and INCL fibroblasts. Consistent with our previous finding43, we found that the INCL fibroblasts had a significantly higher lysosomal pH (Normal: 4.2±0.05 vs INCL: 5.1±0.02; n=3; p<0.05) compared with that in their normal counterparts (Figure 1D). Next, we measured the Kd of the Ca++ probe, Oregon Green™ 488 BAPTA-1 dextran, at two different pH levels (Figure. S1F and S1G), which allowed us to calculate the lysosomal Ca++levels in normal and INCL fibroblasts. In this method, the cells were first loaded with Ca++-sensitive, Oregon green dextran (green fluorescence), and Ca++-insensitive dextran tetramethyl Rhodamine (red fluorescence) for ratio-metric calculation of lysosomal calcium level (Figure 1E). We found that the fluorescence intensity (green / red) of the probe in the lysosome of INCL fibroblasts was significantly lower compared with that of the normal fibroblasts (Figure 1F). Since the fluorescence intensity of the Ca++probe is directly proportional to Ca++ concentration, we used the fluorescence intensity to measure Ca++concentration in a cell. Our results showed that compared with the normal cells, INCL fibroblasts contained significantly lower level of Ca++ in the lysosomes (Normal vs INCL: ~668µM: vs ~ 30 µM; p<0.001) (Figure 1G). Taken together, these results showed that Ca++-homeostasis in INCL cells is dysregulated.
Expression of IP3R1 is suppressed in the brain of Ppt1−/− mice
Previously, it has been reported that inhibition of ER-associated IP3R1 suppressing Ca++-release from the ER causes lysosomal dysfunction manifested as an LSD-like phenotype34. Accordingly, we determined the levels of IP3R1-mRNA and IP3R1-protein in brain tissues from 2-, 4- and 6-month-old WT and Ppt1−/− mice. Since Ppt1−/− mice manifest the disease symptoms at around 6 months of age29, we sought to determine the age at which IP3R1-expression begins to decline. We found that in the brain of Ppt1−/−mice at two age groups (4- and 6- month), the levels of both IP3R1-mRNA (Figure 2A) and IP3R1-protein (Figure 2B) were significantly lower compared with those in their WT littermates. These results may suggest that dysregulation of IP3R1-levels in the brain of Ppt1−/− mice is a potential contributor to the disease pathology and not a likely effect of the disease. To determine whether these results in mice are replicable in humans, we determined the levels of both IP3R1-mRNA and IP3R1-protein in normal and in INCL fibroblasts. The results showed that the levels of both IP3R1-mRNA (Figure 2C) and IP3R1-protein (Figure 2D) were significantly lower in INCL fibroblasts. To further confirm these results, we immunostained histological sections of the cerebral cortex from WT mice and those of their Ppt1−/− littermates using anti-IP3R1 antibody. We also performed confocal microscopy to analyze the intensity of IP3R1-immunofluoresecnce in cortical neurons from WT and Ppt1−/− mice of varying age, which were labeled with a neuronal marker, NeuN. The results showed that the level of IP3R1-fluorescence in the cerebellar cortex of the brain from 2-, 4- and 6-month-old Ppt1−/− mice was significantly lower compared with that of their WT counterparts (Figure 2E-2G).
FIGURE 2. Reduced level of IP3R1-mRNA, IP3R1-protein in the brain of Ppt1−/− mice.
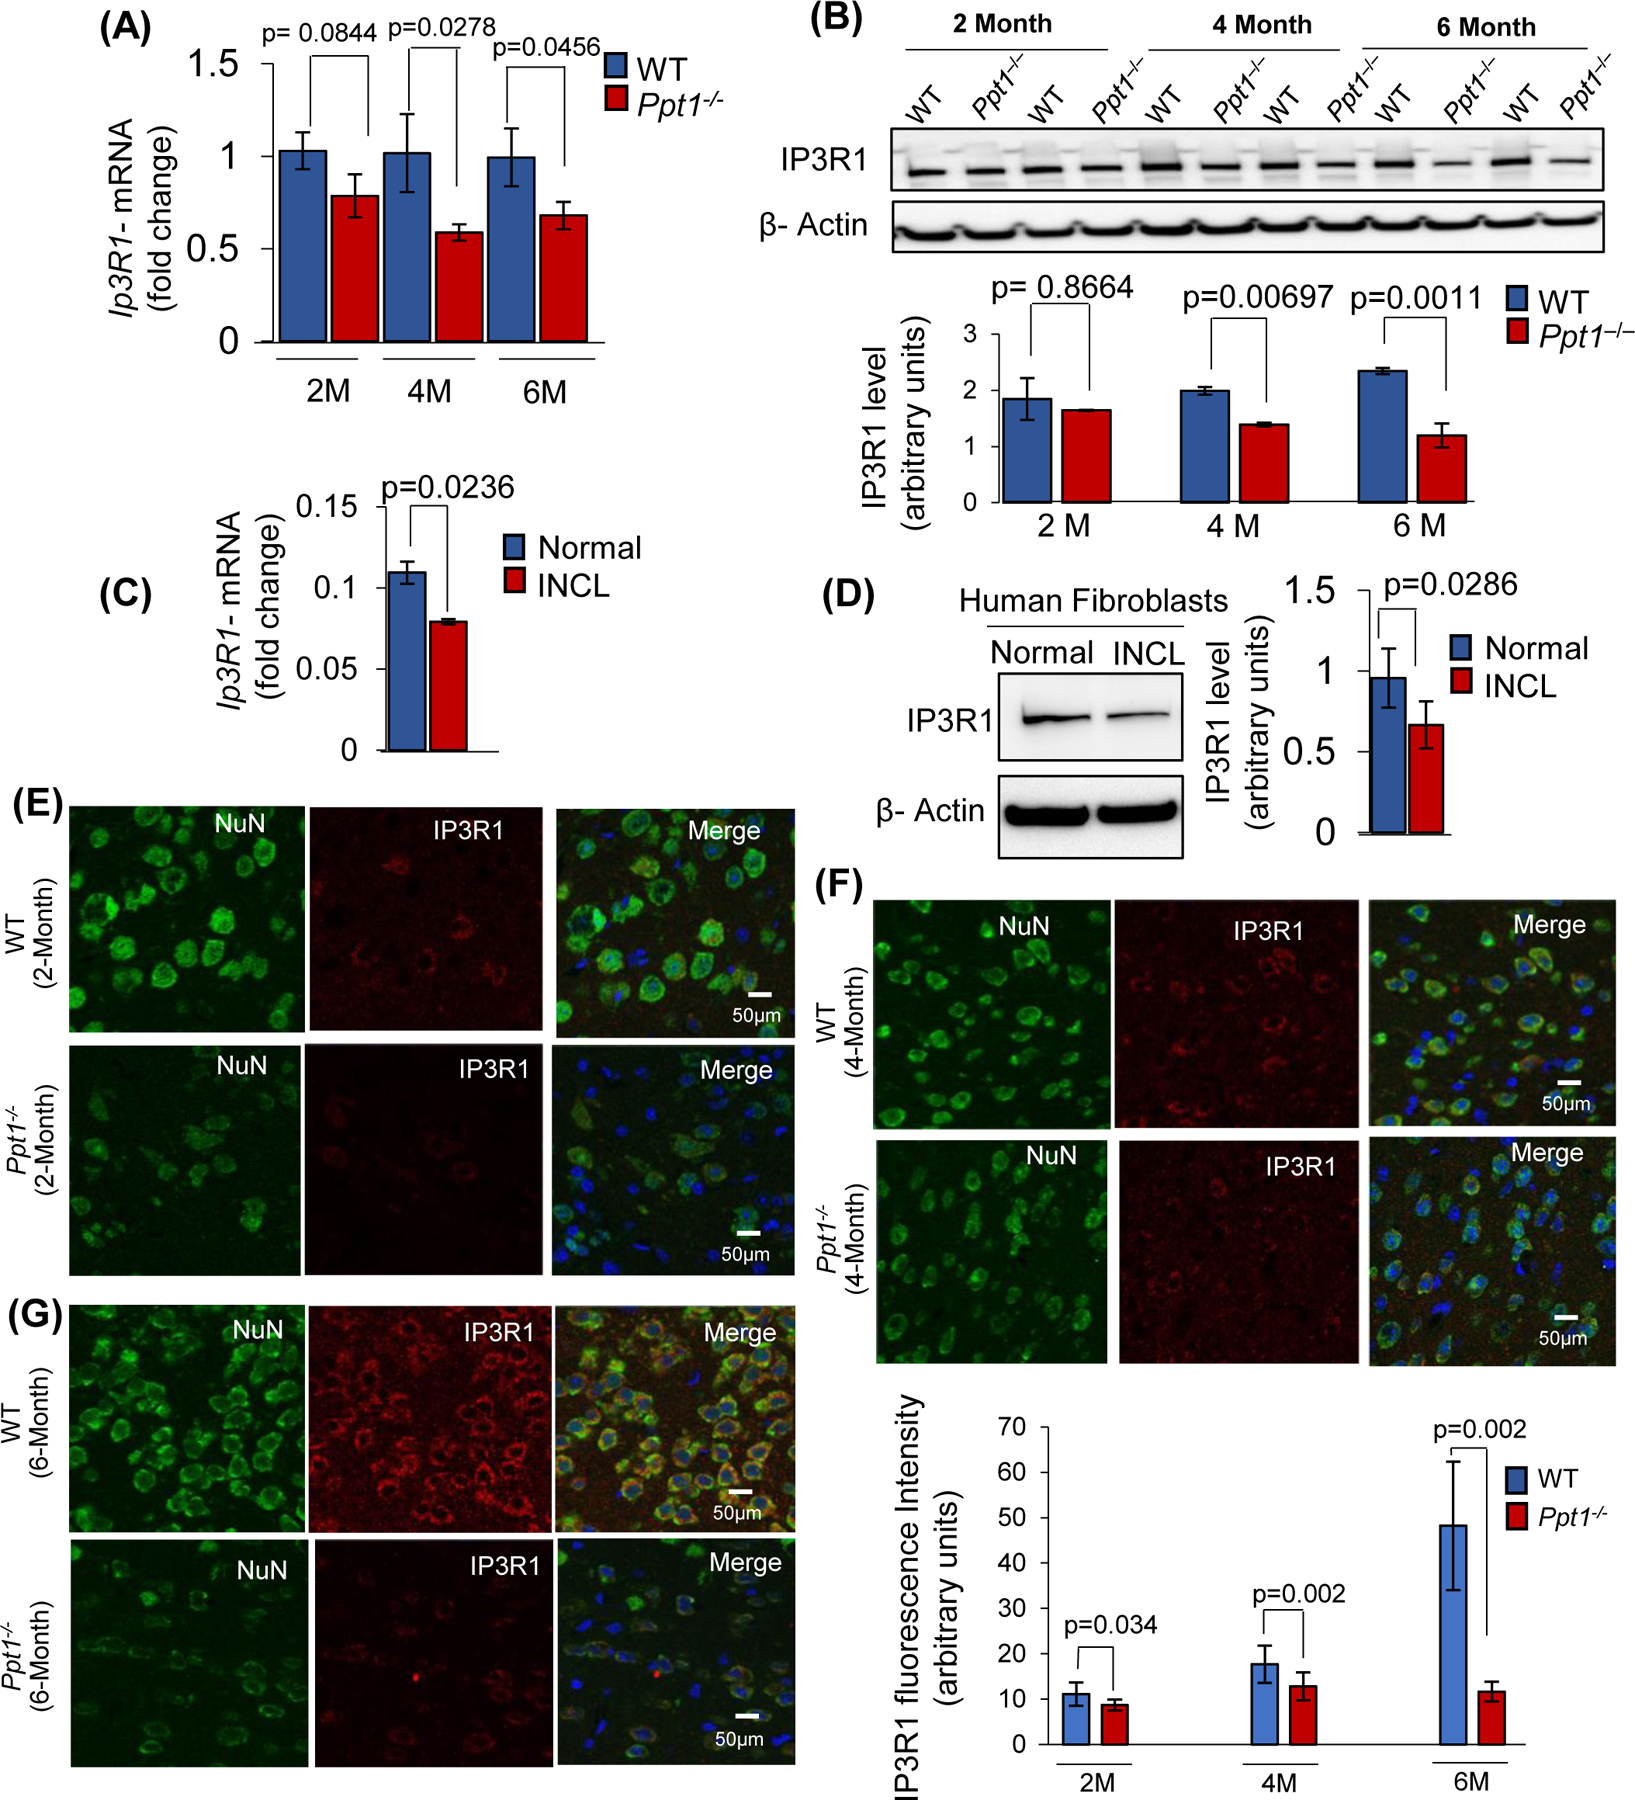
(A), IP3R1-mRNA and (B), Western blot analysis of IP3R1-protein in the brain of WT and Ppt1−/− mice at 2-, 4- and 6- month of age (n=4 animals in each group, p<0.05; NS=non-significant). (C), IP3R1-mRNA expression and (D), IP3R1-protein levels in normal and INCL-fibroblasts (data are presented as the mean ± SD (n = 3), p<0.05). Immunohistochemical analysis of IP3R1 expression in the brain from 2- (E), 4- (F) and 6-month-old (G) WT (upper panels) and Ppt1−/− (lower panels) mice. Fifteen randomly chosen different regions in cortical sections (CA1 region) from each group of animals were analyzed (n=4 animals in each group, p<0.05). Note that the IP3R1-expression (red) in the neurons (green) immuno-stained with Neuronal nuclei (NeuN) marker is significantly lower in Ppt1−/− mice compared with that in the WT littermates.
Since it has been reported that IP3Rs preferentially associate with the ER-lysosome contact sites and mediate the transport of Ca++ to the lysosome34, we sought to determine the levels of IP3R1-protein in the lysosomal fractions of cortical tissues from WT and Ppt1−/− mice by Western blot analysis. The results showed that the IP3R1-protein levels in the lysosome purified from the brain of Ppt1−/− mice were significantly lower compared with those of the WT mice (Figure 3A). To confirm these results, we performed proximity ligation assay (PLA)44 to determine the interaction of IP3R1 with lysosomes using antibodies to IP3R1 and LAMP2, which are the markers for the ER and lysosomal membrane, respectively. Consistent with the above results, PLA also showed that in Ppt1−/− cells the interaction of IP3R1 with lysosomal marker LAMP2 is significantly lower compared with that in WT controls (Figure 3B). To further confirm the PLA results, we also performed confocal microscopy to determine the level of colocalization of IP3R1-immunofluorescence with that of lysosomal marker LAMP2 and ER marker Calnexin (Figure 3C). We found that while in WT fetal mouse fibroblasts there was a significantly higher level of colocalization of IP3R1 with LAMP2-immunofluorescence whereas in those from the Ppt1−/− fetal mice such colocalization was significantly lower (Figure 3D). Notably, IP3R1 was significantly less colocalized with that of the ER-marker calnexin, in Ppt1−/− mouse fibroblasts (Figure 3E). As inter-organelle membrane contact sites (MCS) are reported to be responsible for transferring signaling molecules45, we compared the ER-endocytic MCS in the brain of WT vs Ppt1−/− mice and/or of normal vs INCL fibroblasts by electron microscopy (EM) in addition to performing confocal and PLA experiments. We compared the distance between the ER-lysosomal MCS from the brain WT and Ppt1−/− mice or normal and INCL fibroblasts to rule out any changes in the MCS. Interestingly, the results of EM showed that there were no significant changes between the ER-lysosomal MCS of WT vs Ppt1−/− mouse brain and/or normal vs INCL cells (Figure S2A and S2B). Cumulatively, these results strongly suggested that both the lysosome and the ER in Ppt1−/− cells contain lower level of IP3R1 while the inter organelle membrane contact sites between the ER and the lysosome remained unchanged.
FIGURE 3. Lysosomal- and ER- localization of IP3R1 in the brain of WT and Ppt1−/− mice.
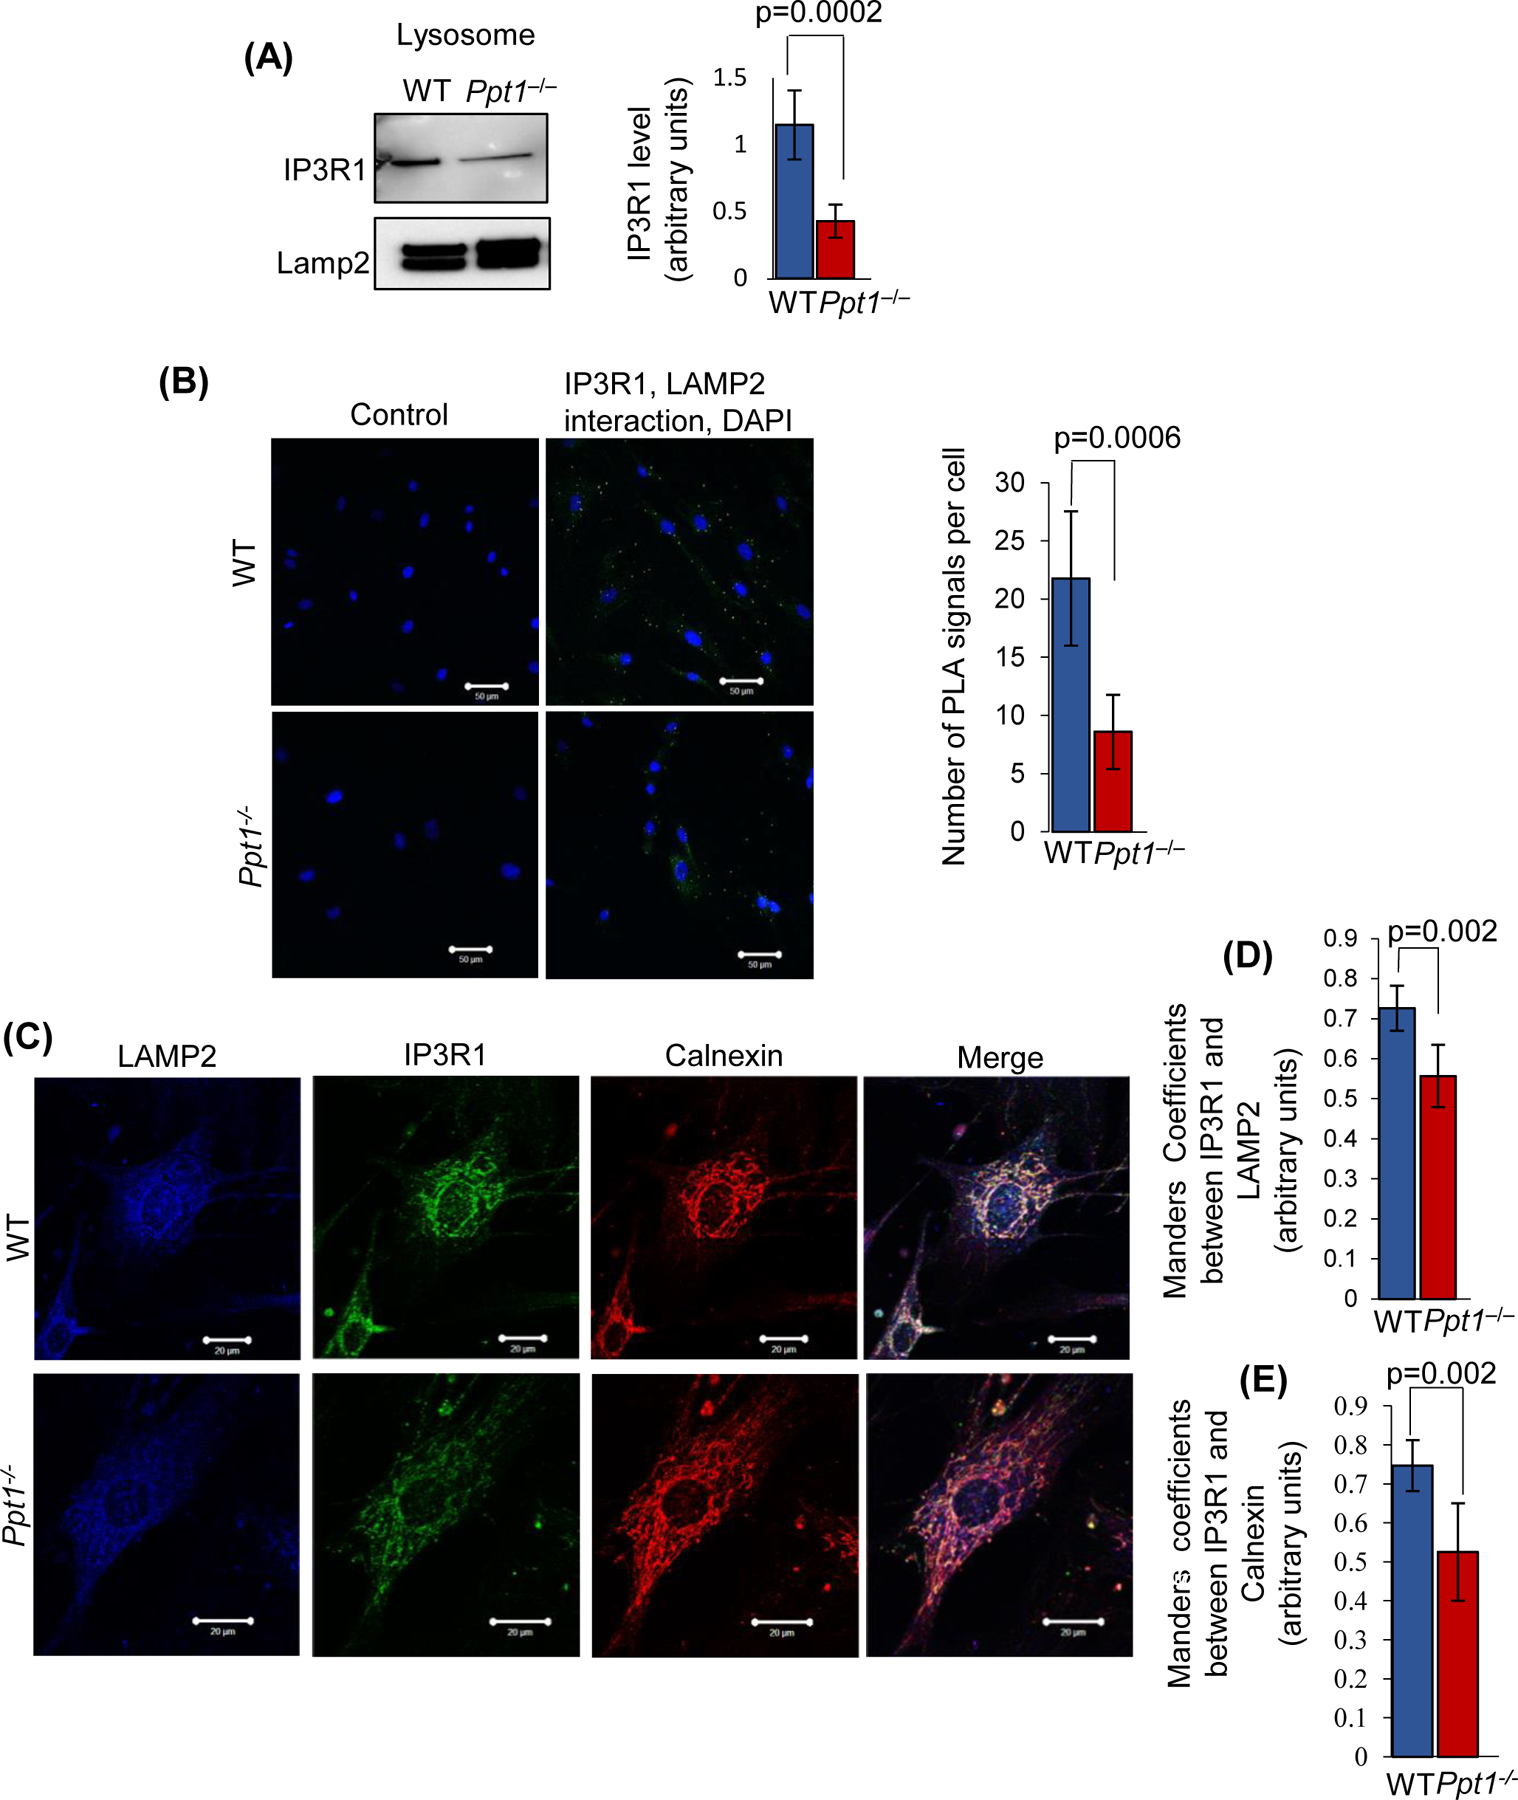
(A), Lysosomal IP3R1 level in the brain of WT mice and in that of their Ppt1−/− littermates (n=4 animals in each group, p<0.05; NS=non-significant). (B), Confocal imaging of cultured fibroblasts cells isolated from WT and Ppt1−/− mouse were performed to determine interaction of IP3R1 with LAMP2 by PLA reaction (n= 74 for WT and n=62 for Ppt1−/−, p<0.001; scale bars, 50µm). The green dots are the positive signals in PLA reactions, showing IP3R1–LAMP2 interaction in WT and Ppt1−/− cells. WT and Ppt1−/− cells with no primary antibody served as the controls. (C), Colocalization of IP3R1 with the lysosomal marker, LAMP2 and with ER-marker, calnexin in fibroblasts from WT and Ppt1−/− mice. Colocalization of IP3R1 with LAMP2 (D) and calnexin (E) was assessed using the Manders’ coefficients (n=20 for WT and n=30 for Ppt1−/−, p<0.05; scale bars, 20µm).
Defective ER to lysosome trafficking of NFATC4 suppresses IP3R1-expression in Ppt1−/− mice
The IP3R1 expression has been reported to be regulated by the transcription factor, NFATC446. Moreover, it has been reported that phosphorylation-dephosphorylation status of NFATC4 determines its localization in the cytoplasm or in the nucleus47. Notably, in its phosphorylated state NFATC4 is inactive and is localized to the cytoplasm, whereas the dephosphorylated (active) form is translocated to the nucleus where it transcriptionally regulates the expression of the IP3R1 gene48. Since we found that IP3R1-protein level is lower in the Ppt1−/− mouse brain, we sought to determine the intracellular localization of NFATC4. We found that in the Ppt1−/− mouse brain the level of NFATC4 was substantially lower in the nucleus (Figure 4A) and higher in the cytoplasm (Figure 4B), whereas the total level of the NFATC4-protein remained unaltered (Figure 4C). We then determined the levels of phosphorylated NFATC4 (pNFATC4) in the brain of Ppt1−/− mice and in INCL fibroblasts by Western blot analysis. The results showed that the levels of pNFATC4 in the brain of Ppt1−/− mice were significantly higher compared with those in their WT littermates (Figure 4D). Similarly, pNFATC4 level in INCL fibroblasts was also significantly higher compared with that in their normal counterparts (Figure 4E). To further confirm these results, we performed confocal imaging to determine the nuclear localization of NFATC4. Consistent with the results of Western blot analysis, confocal imaging of cultured fibroblasts from WT and Ppt1−/− mice confirmed that in Ppt1−/− mouse fibroblasts, the localization of NFATC4 in the nucleus was significantly lower compared with that in WT fibroblasts (Figure 4F). Taken together these results suggest that in Ppt1−/− mice, higher levels of pNFATC4 may cause its retention in the cytoplasm and hinder its translocation to the nucleus.
Figure 4. Enhanced NFATC4- phosphorylation in Ppt1−/− mice suppresses nuclear translocation.
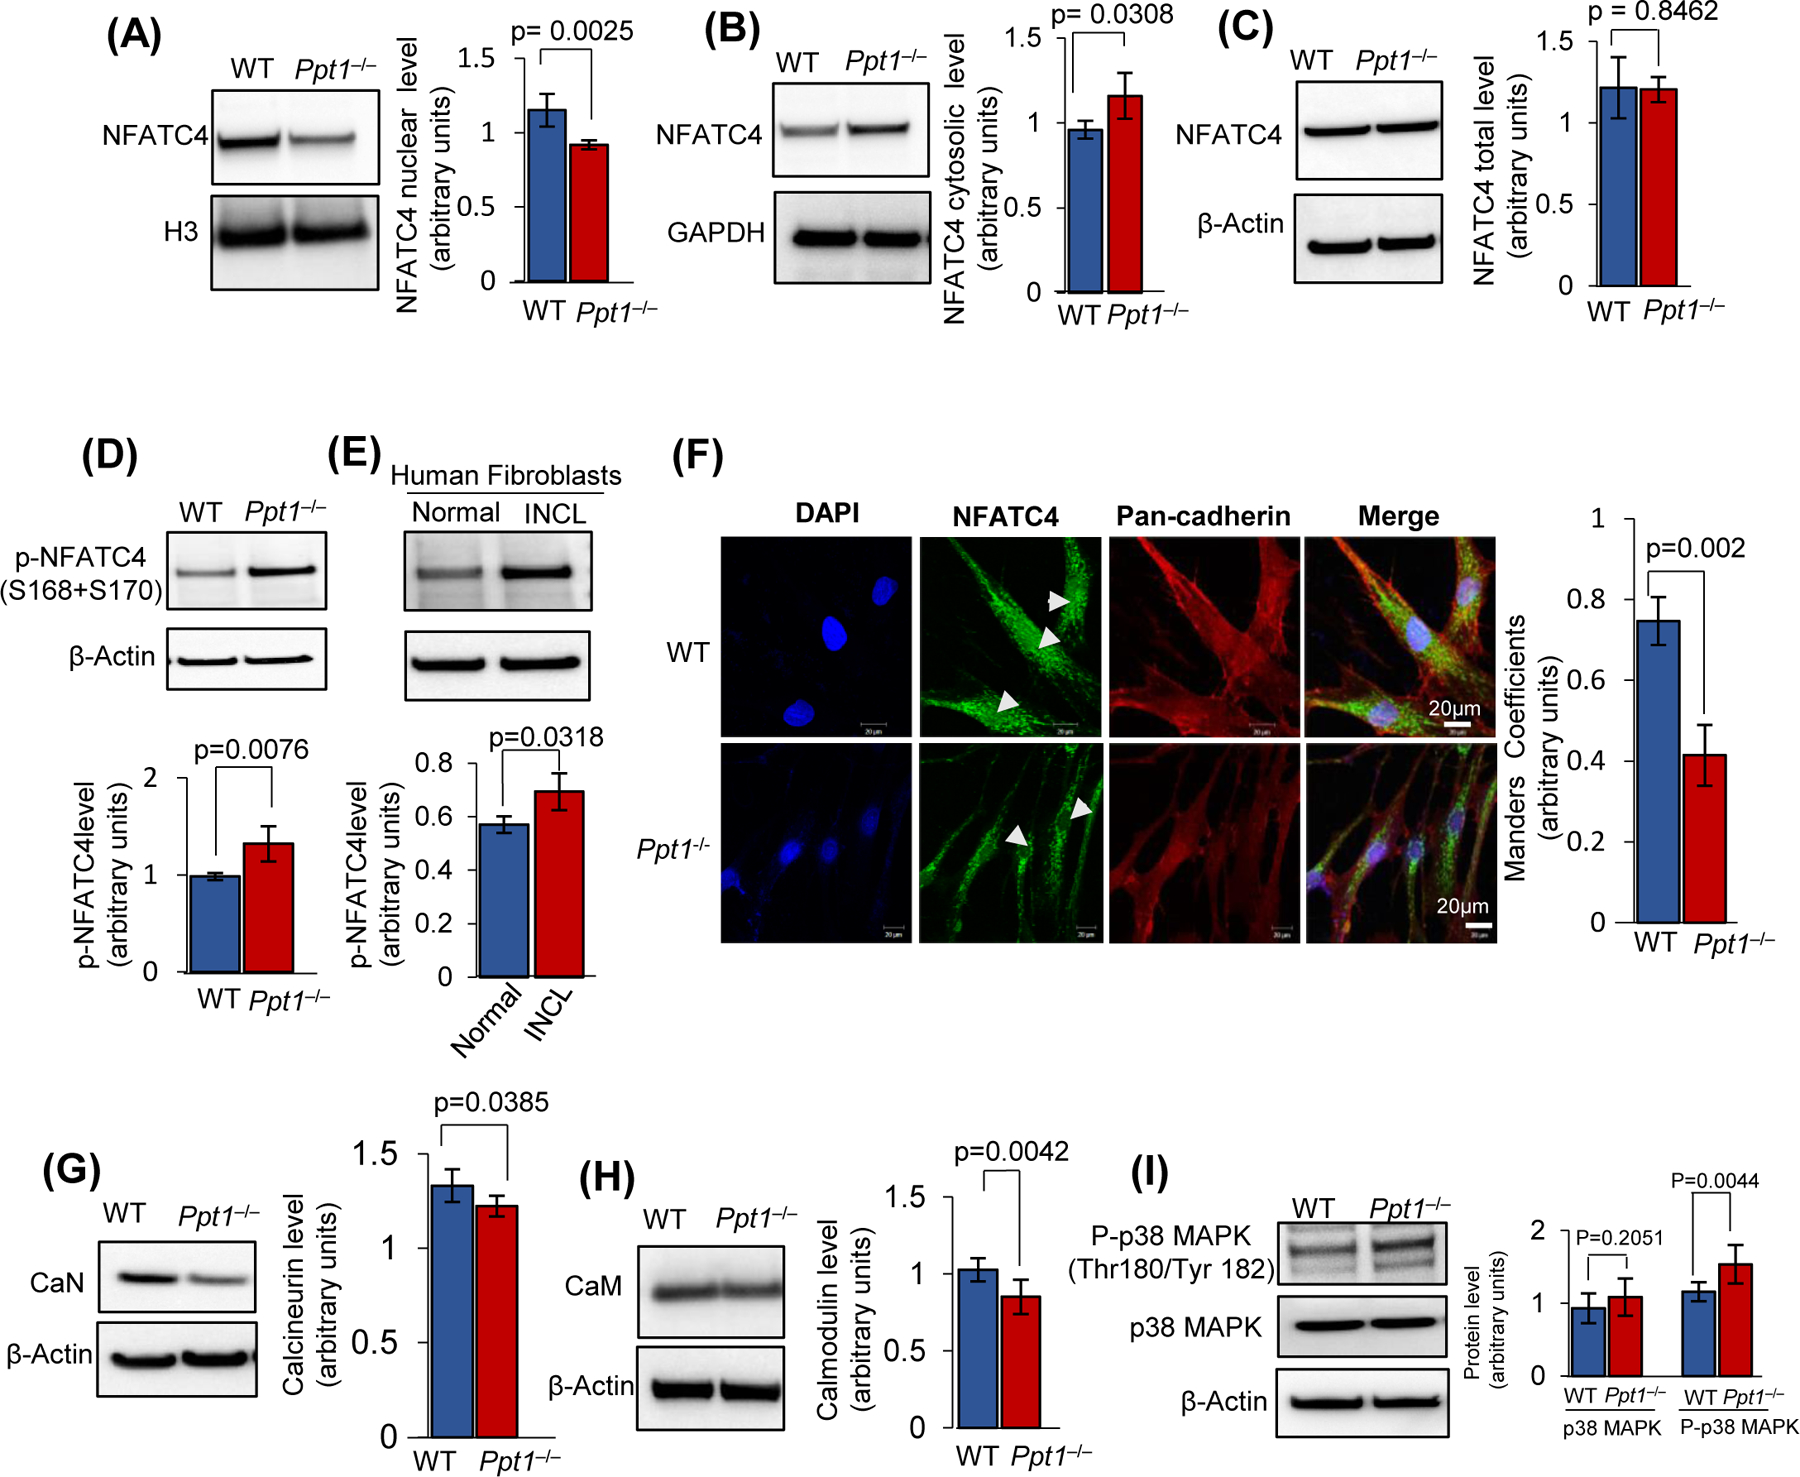
Levels of NFATC4 protein in the nuclear fraction (A), cytosolic fraction (B) and in total cortical lysates (C) from WT and Ppt1−/− mice. (n=4, p<0.05; NS=non-significant). (D), Phospho-NFATC4 levels in the brain of WT and Ppt1−/− mice (n=4, p<0.05; NS=non-significant). (E), Phospho-NFATC4 levels in normal and INCL fibroblasts (n = 3; p<0.05). (F), Colocalization of NFATC4 with nuclear marker, DAPI in fibroblasts from WT and Ppt1−/− mice using Manders’ colocalization coefficients (n=20 for WT and n=30 for Ppt1−/−, p<0.05; scale bars, 20µm). Pancadherin was used as membrane marker. Protein levels of Calcineurin (G) and Calmodulin (H) in total brain tissue lysate from WT and Ppt1−/− mice. The values are expressed as the mean ±SD (n=4 animals in each group, p<0.05; NS=non-significant). (I), Level of p38MAPK and phopho-p38MAPK levels in the brain of Ppt1−/− mice compared with that in WT littermates. (n=4 animals in each group, p<0.05; NS=non-significant).
Next, we sought to determine the cause of lower level of NFATC4 in the nucleus of Ppt1−/− fibroblasts. It has been reported that calcineurin, a Ca++ / calmodulin-dependent phosphatase, dephosphorylates NFATC4 causing it to translocate to the nucleus from the cytoplasm48. Indeed, in CLN3 disease Ca++ signaling has been reported to be defective49 and interestingly, calmodulin which is a major facilitator of Ca++ signaling pathway regulates some of the same cellular processes affected in the NCLs50. Since we found that the level of p-NFATC4 in Ppt1−/− mouse brain was substantially higher than that in WT littermates, we determined the levels of calcineurin- and calmodulin-protein levels, respectively, in the brain of Ppt1−/− mice. We found that the levels of both proteins were significantly lower in Ppt1−/−mice (Figure 4G and 4H). Since NFATC4 is phosphorylated by p38 mitogen-activated protein kinase (MAPK)51, which phosphorylates Ser168 and Ser170 residues in NFAT homology domain of NFATC4, we evaluated the levels of pMAPK (active) in the brain of WT and Ppt1−/− mice. The results showed that the level of p38MAPK was significantly higher in Ppt1−/− mouse brain compared with that in WT littermates (Figure 4I). These results provided at least one of the explanations for the observed higher level of p-NFATC4 in Ppt1−/− mice compared with that in WT littermates.
NFATC4 requires S-palmitoylation on Cysteine residue 43 for trafficking to the nucleus
S-palmitoylation facilitates protein-trafficking, protein-stability, and protein-protein interactions22, 52. Recently, it has been reported that S-palmitoylation of some transcription factors is required for their translocation from the cytoplasm to the nucleus53. Thus, we reasoned that NFATC4 may also require S-palmitoylation for its trafficking from cytosol to the nucleus and in Ppt1−/− mice this process is dysregulated. To determine whether NFATC4 undergoes S-palmitoylation, we first analyzed the peptide sequence of this protein using CSS-Palm54, a computer program that predicts potential S-palmitoylation sites in a polypeptide. The results of this analysis predicted that Cys-6 and Cys-43 are the likely S-palmitoylation sites in NFATC4 (Figure S3A). Accordingly, we performed acyl-Rac assay55 using cortical homogenates from WT mice to determine whether NFATC4 is S-palmitoylated. The results, for the first time, demonstrated that NFATC4 from WT mouse brain undergoes S-palmitoylation (Figure 5A). To identify whether both Cys-6, Cys-43 in NFATC4 is S-palmitoylated, we transfected HEK-293T cells with WT NFATC4-cDNA construct or constructs in which either Cys-6 or Cys-43 or both were mutated to Ala and performed acyl-Rac assay to determine S-palmitoylation status of NFATC4. The results showed that only Cys43Ala and not Cys6Ala mutation abrogated S-palmitoylation (Figure 5B; Figure S3B). Taken together, these results confirmed that Cys-43 in NFATC4 is the only S-palmitoylation site in this protein, which is evolutionarily conserved across the class Mammalia, phylum Chordata (Figure S3A).
FIGURE 5. Reduced S-palmitoylated NFATC4 suppresses its nuclear translocation in Ppt1−/− mice.
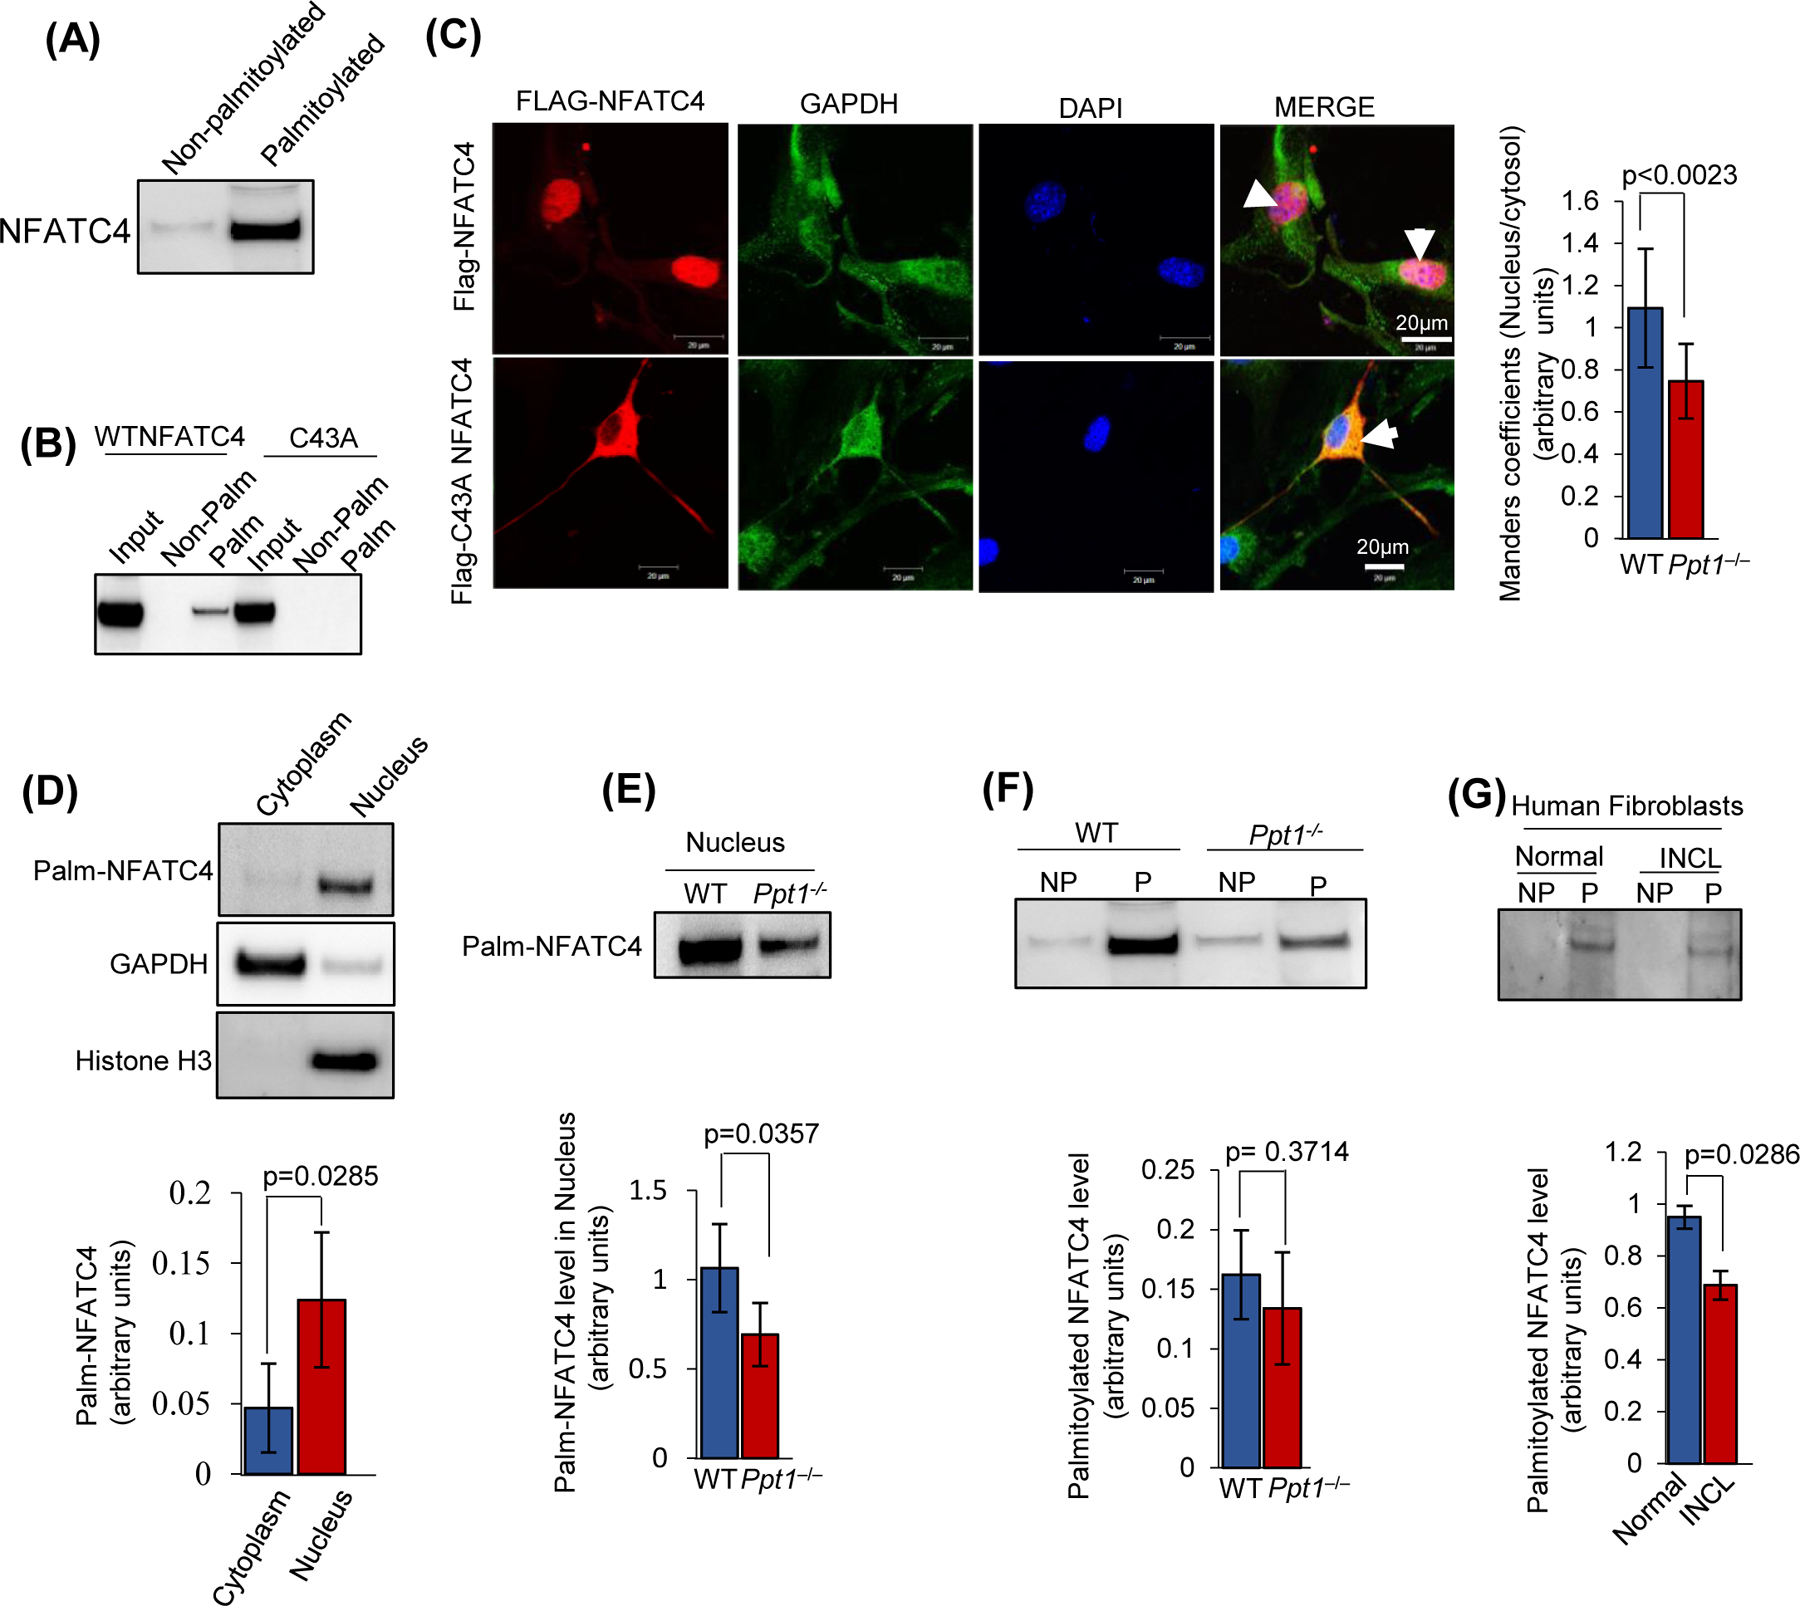
(A), Analysis of NFATC4 S-palmitoylation in WT mouse brain by Acyl-Rac assay. (B), Acyl Rac assay of WT and mutant (C43A) NFATC4 to determine the S-pamitoylated residue. (C), Colocalization of Flag-NFATC4 and Flag-NFATC4 mutant (C43A) with nuclear marker, DAPI, in WT (upper panels) and Ppt1−/− (lower panels) mouse fibroblasts. Colocalization was assessed by Manders’ colocalization coefficients (n=20 for WT and Ppt1−/−, p<0.05; scale bars, 20µm). (D), Level of S-palmitoylated NFATC4 in the cytoplasmic and nuclear fractions of WT mouse brain. GAPDH and Histone H3 were used as the markers for cytoplasmic and nuclear fractions, respectively. Palm–NFATC4 bands indicates S-palmitoylated NFATC4. Note that the nuclear level of S-palmitoylated NFATC4 is significantly high compared to cytosolic level. (E), S-palmitoylated NFATC4 in the nuclear fraction of WT and Ppt1−/− mouse brain (n=4 animals in each group, p<0.05; NS, Non-significant). (F), S-palmitoylation status of NFATC4 in WT and Ppt1−/− mouse brain. NP, non-palmitoylated and P, S-palmitoylated, respectively (n=4 animals in each group, p<0.05; NS=non-significant). (G), Levels of S-palmitoylated NFATC4 in normal and INCL fibroblasts (n = 3), p<0.05).
S-palmitoylation of NFATC4 is essential for its translocation from the cytosol to the nucleus
To determine whether S-palmitoylation on Cys43 facilitated cytosol to nuclear translocation of NFATC4, we transfected Flag-tagged WT or C43A mutant constructs to WT mouse fibroblasts to delineate whether S-palmitoylation of NFATC4 had any effect on its localization in the cytosol or in the nucleus. Confocal microscopic analyses showed that C43A mutation significantly suppressed its translocation from the cytosol to the nucleus, compared with WT NFATC4 (Figure 5C). These results suggested that S-palmitoylation of NFATC4 may have an important role in its translocation from the cytosol to the nucleus. To further confirm these results, we isolated the cytosolic and nuclear fractions of cortical tissues from WT and Ppt1−/− mice brain and performed Acyl-Rac assay to determine the level of S-palmitoylated NFATC4 in those fractions. As the results from the WT mouse brain showed that the nuclear fractions contained significantly higher amount of S-palmitoylated NFATC4 compared with that of the cytosolic fractions (Figure 5D) indicating S- palmitoylated NFATC4 mostly remains in the nucleus, we compared the level of S-palmitoylated NFATC4 in the nuclear fraction from WT and Ppt1−/− mice brain. The results showed that the level of S-palmitoylated NFATC4 in the nuclear fractions from Ppt1−/−mouse brain was significantly lower than that of their WT counterparts (Figure 5E) Since the active form of NFATC4 in the nucleus regulates the expression of Ip3r1, we determined the levels of S-palmitoylated NFATC4 in the brain of WT and Ppt1−/−mice. We found that the level of S-palmitoylated NFATC4 in total homogenates of cortical tissues from Ppt1−/− mice was markedly lower compared to that in their WT littermates (Figure 5F). Similarly, the INCL fibroblasts also showed significantly lower level of S-palmitoylated NFATC4 compared with that in normal fibroblasts (Figure 5G).
Reduced ZDHHC4 and ZDHHC8 levels in Ppt1−/− mouse brain reduce S-palmitoylated NFATC4
How might Ppt1-deficiency dysregulate the cytosol to nuclear translocation of NFATC4 and suppress IP3R1-expression in Ppt1−/− mice? To address this question, we first sought to identify the palmitoyl-acyltransferase(s) (called ZDHHCs), which catalyze the S-palmitoylation of NFATC4. The mammalian genome encodes a family of 23 ZDHHCs, which catalyze S-palmitoylation of various proteins56. To identify which ZDHHC or ZDHHCs S-palmitoylated NFATC4, we first co-transfected HEK293T cells with cDNA constructs of NFATC4 and each of the 23 ZDHHCs and determined the levels of S-palmitoylated NFATC4. In the first screen, we identified seven ZDHHCs (ZDHHC 2, −4, −6, −8, −9, −11 and −22), which appeared to increase the level of S-palmitoylated NFATC4 (Figure 6A). In the second screen, we sought to determine whether the increase in S-palmitoylation of NFATC4 contributed to its nuclear translocation. Accordingly, we evaluated the levels of S-palmitoylated NFATC4 in the nuclear fractions of HEK293T cells co-transfected with each of the 7-ZDHHCs along with Flag-NFATC4. In the second screen, we sorted these seven ZDHHCs out of 23 ZDHHCs because they elevated the level of S-palmitoylated NFATC4 in HEK293T cells compared with that of other ZDHHCs. The results showed an increased level of S-palmitoylated NFATC4 in the nucleus of those HEK293T cells that were transfected with ZDHHC4-, ZDHHC8- and ZDHHC11-constructs (Figure 6B). At this point, we sought to determine the status of these three ZDHHCs level in WT and Ppt1−/− mice brain as we found S-palmitoylated NFATC4 is markedly lower in Ppt1−/− mice brain compared to that of WT. The results showed that the protein level of only ZDHHC4 and ZDHHC8 are significantly lower in Ppt1−/− mice compared with those in WT littermates (Figure 6C and 6D), while the levels of ZDHHC11 between WT and Ppt1−/− mice were unaltered (Figure S3C). These results suggest that ZDHHC4 and ZDHHC8 are the likely enzymes that catalyze S-palmitoylation of NFATC4. To further confirm these results, we conducted shRNA knocked-down experiments to suppress ZDHHC4 and ZDHHC8 in HEK293T cells (Figure S3D and S3E) and determined the levels of S-palmitoylated NFATC4. The results showed that the level of S-palmitoylated NFATC4 is substantially lower (Figure 6E and 6F) in cells in which ZDHHC4- or ZDHHC8-expression was suppressed. Taken together, these results indicated that ZDHHC4 and ZDHHC8 are the likely enzymes that catalyze S-palmitoylation of NFATC4, which appears to be required for its nuclear localization. We also found that the protein level of ZDHHC4 and ZDHHC8 are significantly lower in INCL fibroblasts compared with that in normal fibroblasts (Figure 6G and 6H). While a precise reason for the lower levels of ZDHHC4- and ZDHHC8-proteins in Ppt1−/− mouse brain, remains to be determined, one likely possibility is that these proteins may be degraded via proteasomal pathway. Accordingly, we measured the proteasomal activity in the brain of 2-, 4-, and 6-month-old WT and Ppt1−/− mice. The results showed that proteasomal activities in the brain of Ppt1−/− mice of all ages were significantly higher compared with those in the brain of WT mice (Figure S3F). Cumulatively, these results suggested that a likely cause of the reduced levels of S-palmitoylated NFATC4 in Ppt1−/− mouse brain is the proteasomal degradation of ZDHHC4 and ZDHHC8 and this defect may have adversely affected the translocation of NFATC4 from the cytosol to the nucleus, thereby, downregulating the expression of IP3R1.
FIGURE 6. Identification of ZDHHC(s), catalyzing S-palmitoylation of NFATC4.
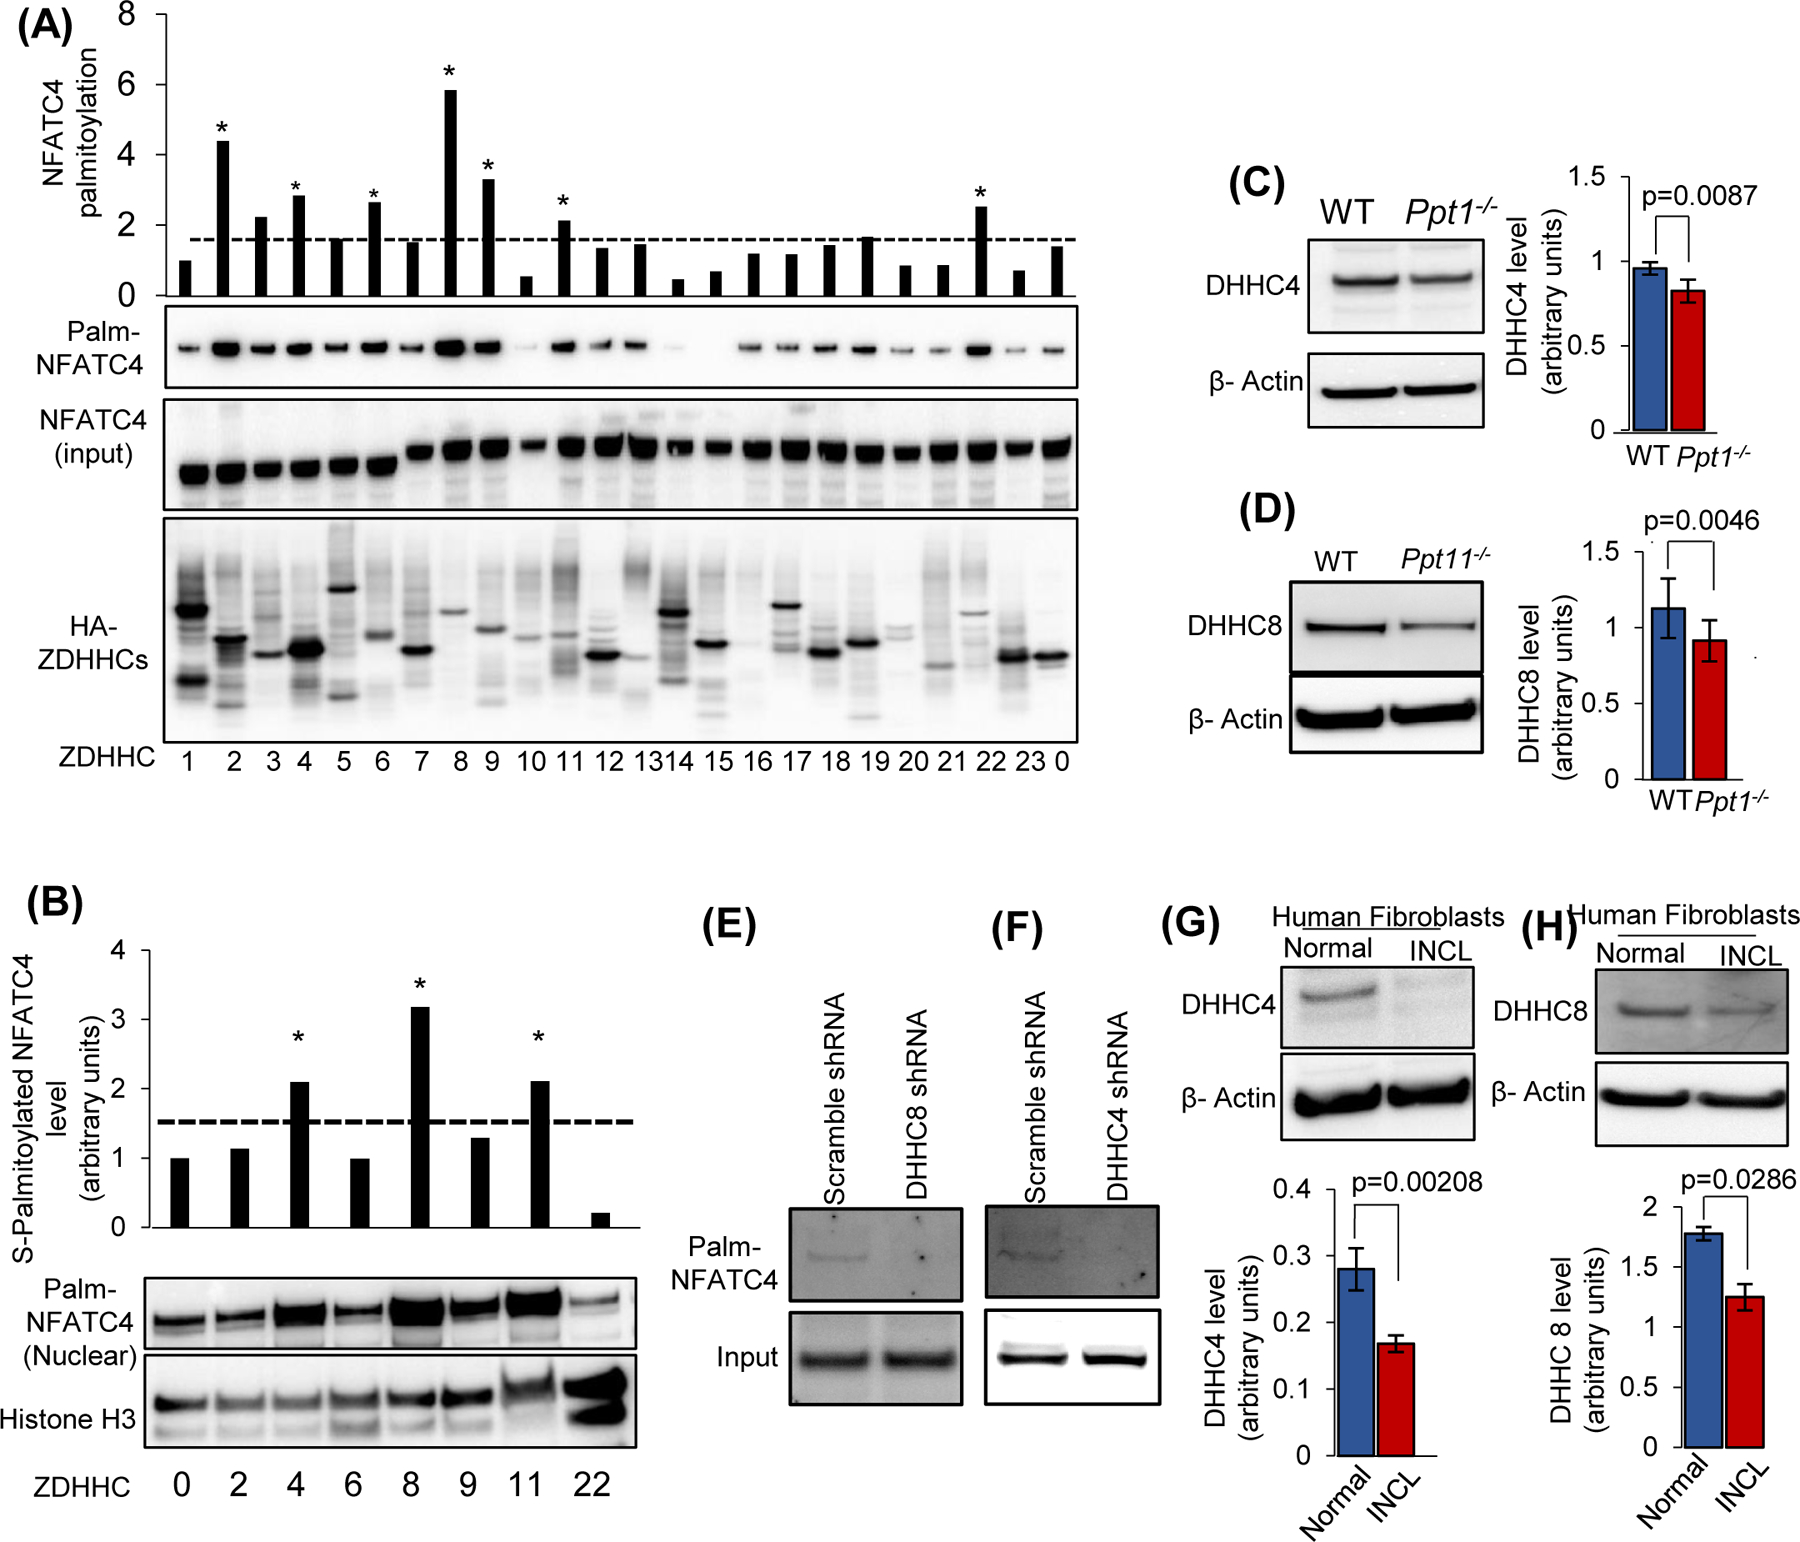
(A), Identification of candidate ZDHHCs that may catalyze S-palmitoylation of NFATC4. Acyl Rac assay to detect S-palmitoylation of NFATC4 expressed in HEK293T cells co-transfected with FLAG-NFATC4 and HA-ZDHHC constructs. Top panel: quantitation of S-palmitoylated NFATC4 catalyzed by each of the 23 ZDHHCs. S-palmitoylation is normalized to the amount of total S-palmitoylated NFATC4 in cells transfected with the empty vector (#0). The dotted line indicates markedly higher level of S-palmitoylated NFATC4 in cells transfected with putative ZDHHCs catalyzing S-palmitoylation compared with those levels in cells transfected with the empty vector. In the second panel, Western blot of S-palmitoylated NFATC4 (Palm-NFATC4) from a representative Acyl Rac assay in which all 23 ZDHHC proteins are shown. In the third panel, a corresponding immunoblot comparing total amounts of NFATC4 in the same reactions (NFATC4 input) are shown. In the fourth panel, a corresponding immunoblot in which various ZDHHC proteins tagged with HA (HA-ZDHHCs) are shown. Note that in the first screening, a markedly higher level of NFATC4 S-palmitoylation was observed (indicated by an asterisk) only with ZDHHCs 2-, 4-, 6-, 8-, 9-, 11-, and 22. (B), HEK293T cells were co-transfected with Flag-NFATC4 and HA-ZDHHCs (ZDHHC 2-, 4-, 6-, 8-, 9-,11- and 22- and the nuclear fraction was isolated for Acyl Rac assay followed by quantification of S-palmitoylated NFATC4 in the nuclear fraction catalyzed with ZDHHC2, ZDHHC4, ZDHHC6, ZDHHC8, ZDHHC9, ZDHHC11 and ZDHHC22, normalized to the amount of NFATC4 observed with an empty vector (#0). Note that in the second screen, the levels of only ZDHHCs 4, 8, and 11 elevated S-palmitoylation of NFATC4 compared to the other ZDHHCs. Levels of ZDHHC4 (C) and ZDHHC8 (D) in WT and Ppt1−/− mouse brain (n = 4 animals of each group, p < 0.05). The effect of shRNA suppression of ZDHHC8 (E) and ZDHHC4 (F) on NFATC4 S-palmitoylation in HEK293T cells. Note that shRNA treatment efficiently suppressed S-palmitoylation of NFATC4 while the scrambled shRNA failed to do so. Levels of DHHC4 (G) and DHHC8 (H) in normal and INCL fibroblasts (data are presented as mean ± SD (n = 3; p<0.05).
Suppressed IP3R1 expression in Ppt1−/− mice and in INCL fibroblasts dysregulate Ca++ homeostasis
It has been reported that dysregulated autophagy underlies neurodegeneration in most LSDs8. Previously, we reported that autophagy is dysregulated in INCL fibroblasts and in Ppt1−/− mouse brain38. In this study, we confirmed those results by measuring the level of an autophagosome marker, LC3-II. Consistent with our previous finding, the results showed that LC3-II level is significantly elevated in Ppt1−/− mouse brain compared with that in their WT littermates (Figure 7A). Similarly, in INCL fibroblasts LC3-II level was also higher compared with that in normal fibroblasts (Figure 7B). These results suggested that the autophagosomes are accumulated in the brain of Ppt1−/− mice as well as in cultured INCL fibroblasts. Since serum starvation induces autophagy, we sought to test whether induction of autophagy in INCL is defective. Accordingly, we serum-starved normal and INCL fibroblasts and measured LC3-II levels to determine whether this treatment induced autophagy in INCL cells. We found that compared with normal fibroblasts, the INCL fibroblasts contained significantly higher level of LC3-II (Figure 7C). Moreover, using cortical tissues from WT and Ppt1−/− mice and cultured normal and INCL fibroblasts, respectively, we measured the level of p62/SQSTM1 as the level of this marker increases when autophagy is impaired57. We found that the level of p62/SQSTM1 in the brain of Ppt1−/− mice (Figure 7D) and in INCL fibroblasts (Figure 7E) was significantly elevated. We reasoned that if decreased IP3R1-mRNA and protein levels were responsible for the defective lysosomal Ca++-homeostasis, the INCL phenotype may be rescued by over-expressing IP3R1 in the INCL patient fibroblasts. To test this hypothesis, we overexpressed IP3R1 by transfecting cultured INCL fibroblasts with IP3R1-cDNA construct and determined whether IP3R1-overexpression ameliorated the dysregulated lysosomal Ca++ homeostasis. Accordingly, we overexpressed IP3R1 in INCL fibroblasts (Figure S3G) and found that IP3R1-overexpression in these cells significantly increased Ca++ release when stimulated with bafilomycin A1 (Figure 8A) or NAADP-AM (Figure 8B). We further tested whether IP3R1-overexpression normalized autophagy by determining the levels of LC3-II protein in those INCL fibroblasts in which IP3R1-protein was overexpressed. We found that overexpression of IP3R1 significantly lowered LC3-II level compared with that of the control INCL fibroblasts in which IP3R1 was not overexpressed (Figure 8C). To further confirm these results, we monitored the distribution of endogenous LC3-II in IP3R1-transfected INCL fibroblasts by immunostaining and confocal microscopic imaging. The results showed that autophagosome accumulation was significantly lower in INCL fibroblasts, which were transfected with IP3R1-construct compared with that in non-transfected control INCL cells (Figure 8D). These results suggested that reduced level of IP3R1 in INCL fibroblasts may at least in part contribute to the dysregulation of lysosomal Ca++ homeostasis, which impaired autophagy. Taken together, our results demonstrate that Ppt1-deficiency dysregulating lysosomal Ca++ homeostasis in Ppt1−/− mice may impair lysosomal degradative function and autophagy, which underlie neurodegeneration in most LSDs8, 9 including the CLN1 disease38.
FIGURE 7. Dysregulation of autophagy in Ppt1−/− mouse brain and in INCL patient’s fibroblasts.
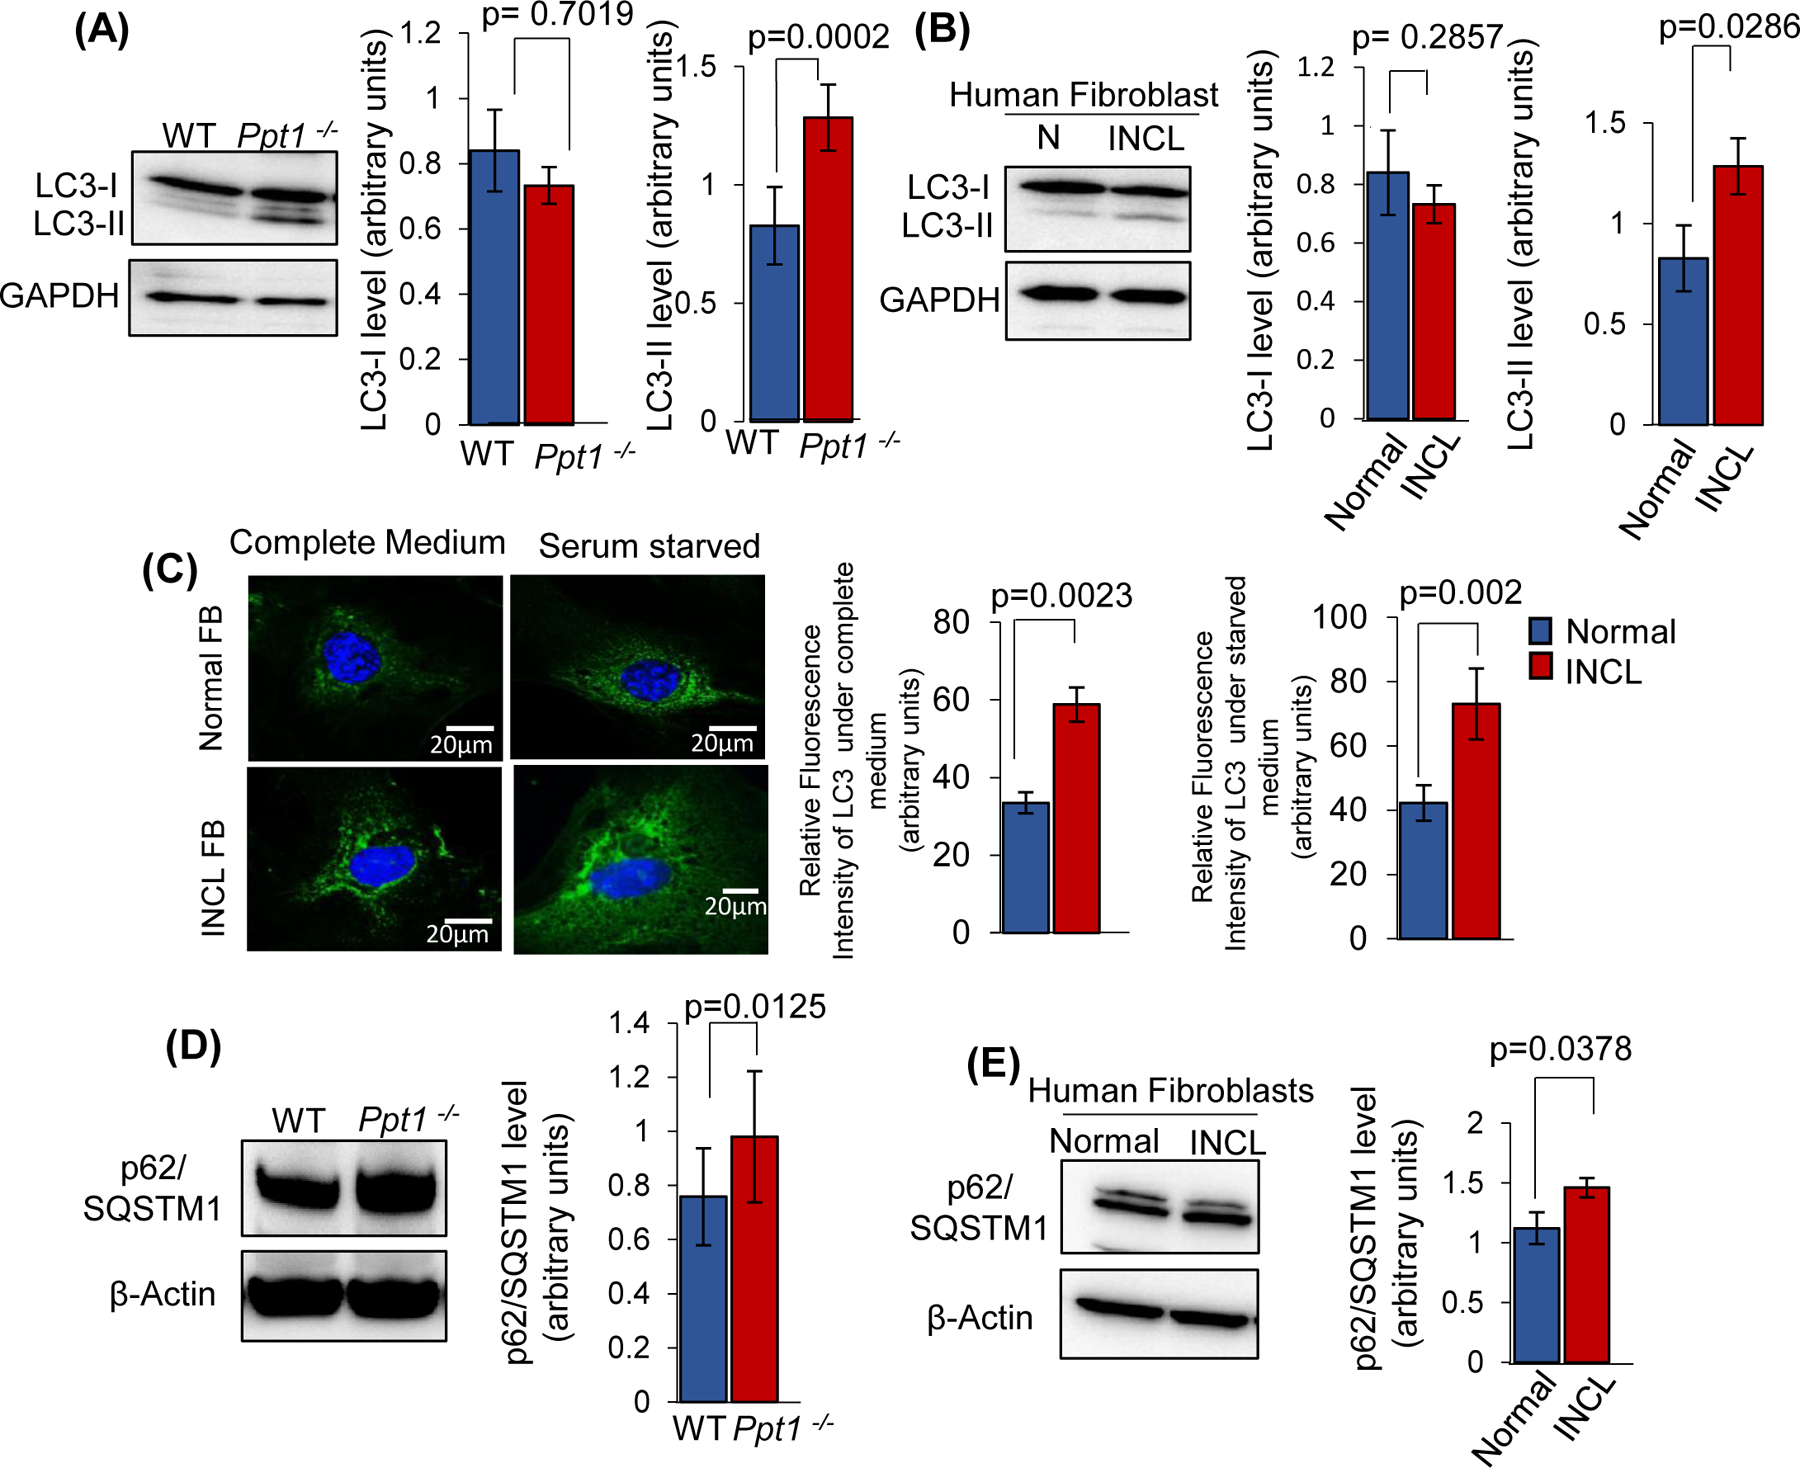
(A), Level of LC3-I and LC3-II in the brain of WT and Ppt1−/− mice. Note LC3-II level is increased significantly in Ppt1−/− mouse brain compared to WT. The values are expressed as the mean ± SD (n=4 animals in each group, p<0.05; NS=non-significant). (B), LC3-I and LC3-II levels in normal and INCL fibroblasts (data are presented as mean ± SD (n = 3), p<0.05). (C), Immunostaining of LC3 was performed using cultured fibroblasts from normal subjects (upper panels) and INCL fibroblasts (lower panels). The cells were either grown in complete medium or without serum (starved) medium and stained with LC3 antibody. Note that the levels of LC3 positive puncta were markedly elevated in serum starved INCL fibroblasts as compared to normal fibroblasts (n=20 cells for normal and 20 cells for INCL, p<0.05: scale bars, 20µm). (D), Level of p62/SQSTM1 in the brain of WT and Ppt1−/− mice. (E), Level of p62/SQSTM1 in the normal and INCL fibroblasts.
FIGURE 8: IP3R1-overexpression in INCL fibroblasts ameliorates defective lysosomal Ca++ homoeostasis and autophagy.
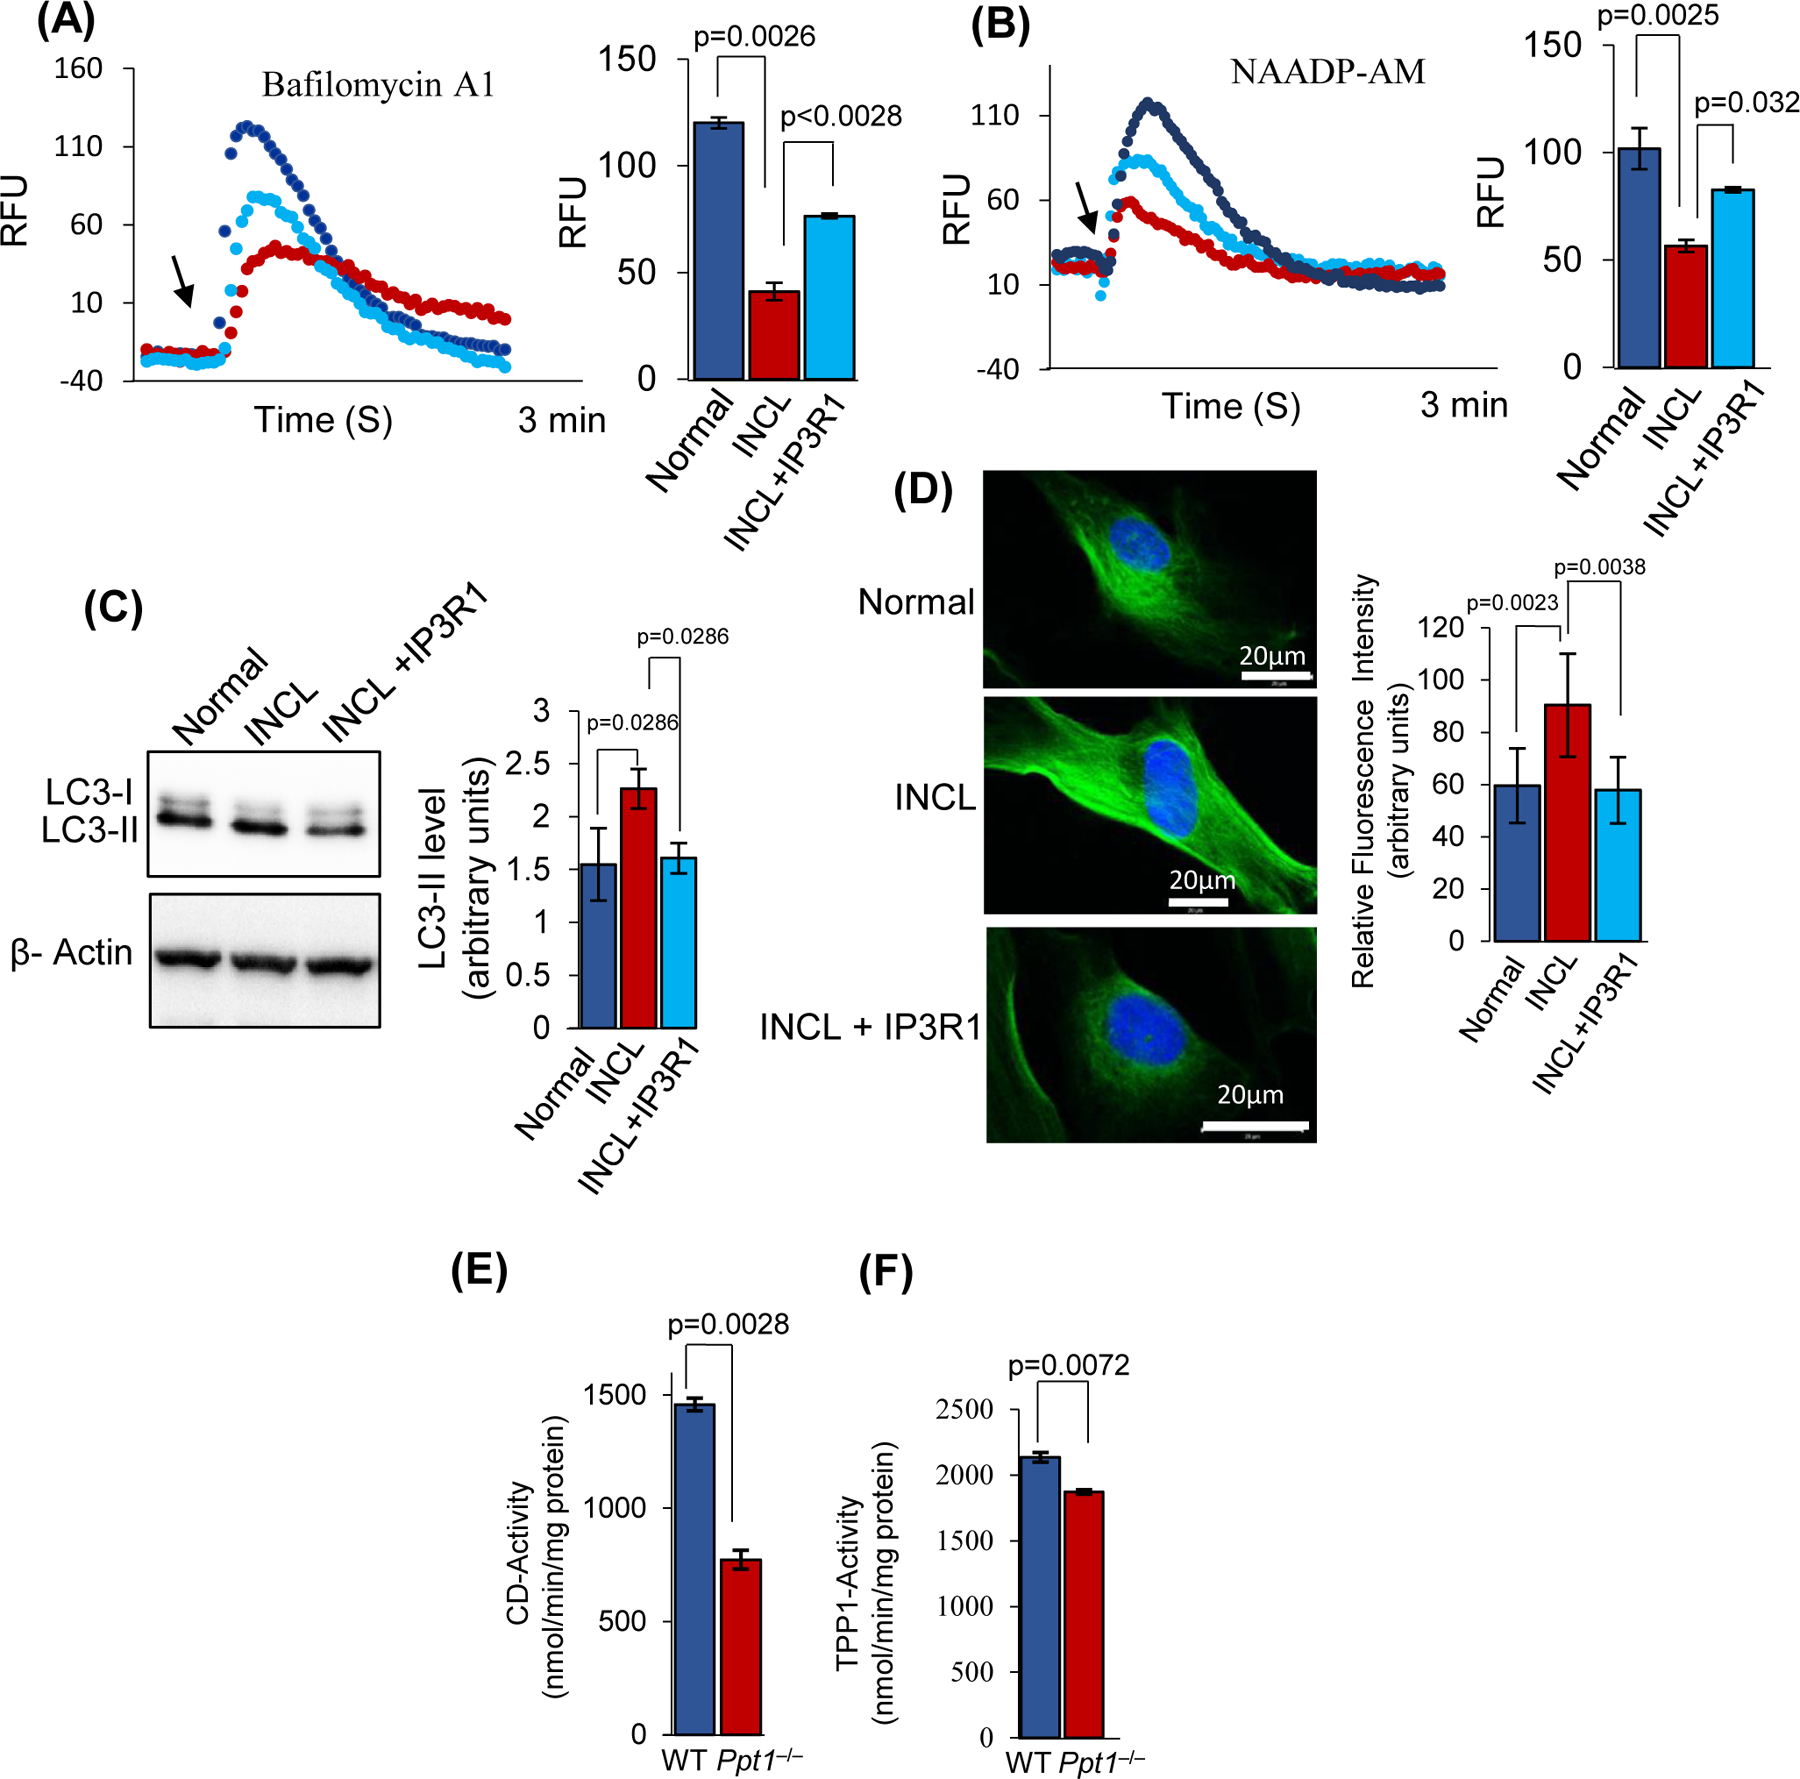
Calcium efflux from the lysosomes were measured using normal, and patient fibroblasts by treating the cells with Bafilomycin A1 (A) and NAADP-AM (B) at the specified time period shown by the arrow. Note that INCL cells overexpressing IP3R1 (denoted by INCL+ IP3R1) significantly increases Ca++ release from the lysosomes compared to that of control INCL cells. (C), Level of LC3-II in normal, INCL, and INCL fibroblasts overexpressing IP3R1 (data are presented as mean (n = 3) ± SD, p<0.05). (D), Immunostaining of LC3 was performed in normal, INCL, and INCL cells overexpressing IP3R1. Note that the level of LC3 was significantly reduced in those INCL cells which overexpressed IP3R1 (n=20 for normal, INCL, and INCL cells overexpressing IP3R1, p<0.05; scale bars, 20µm). (E), Enzymatic activity of cathepsin D (CD) in the lysosomal fractions isolated from WT and Ppt1−/− mouse cerebral cortex. (F), Enzymatic activity of tripeptidyl peptidase-1 (TPP1) in the lysosomal fractions isolated from WT and Ppt1−/− mouse cerebral cortex (n = 4 animals of each group, p<0.05).
Suppressed enzymatic activities of Ca++-dependent lysosomal hydrolases in Ppt1−/− mouse brain
In virtually all aspects of cellular life, Ca++ acts as a common second messenger that regulates growth, motility, differentiation and death58, 59. How might dysregulated lysosomal Ca++ homeostasis impairs lysosomal degradative function in Ppt1−/− mice? To understand the underlying mechanism, we determined the protease activities of two major lysosomal hydrolases, cathepsin D (CTSD) and tripeptidyl peptidase 1 (TPP1), both of which are Ca++-dependent enzymes60, 61. Moreover, inactivating mutations in the CTSD and TPP1 genes cause congenital NCL (CLN10-disease) and late infantile NCL (CLN2-disease), respectively17. Since we found that lysosomal Ca++ level is significantly lower in Ppt1−/−mice compared with that in their WT littermates, we reasoned that CTSD- and TPP1-enzymatic activities may be adversely affected in Ppt1−/−mouse brain. Our results showed that in the lysosomal fractions from the brain tissues of Ppt1−/− mice, the enzymatic activities of both CTSD and TPP1, are significantly lower compared with those in their WT littermates (Figure 8E and 8F). These results indicate that the suppression of CTSD- and TPP1-enzyme activities in the lysosome of Ppt1−/− mouse brain, may at least in part, be caused by dysregulation of lysosomal Ca++ homeostasis.
Discussion
In this study, we have demonstrated that lysosomal Ca++ homeostasis is dysregulated in cultured INCL fibroblasts as well as in the brain of Ppt1−/− mice, which recapitulate virtually all clinical and pathological features of INCL28, we also demonstrated that the transcription factor NFATC4, which regulates the expression of IP3R1, a mediator of Ca++ transport from the ER to the lysosome, requires S-palmitoylation on Cys43 for its translocation from the cytoplasm to the nucleus. Moreover, we identified ZDHHC4 and ZDHHC8 as the palmitoyl acyltransferases22, 23, 25, which catalyzed S-palmitoylation of NFATC4. Although in this study, we didn’t identify whether NFATC4 is a substrate of PPT1, we speculate that either PPT1 catalyzes the depalmitoylation of S-palmitoylated NFATC4 or PPT1 regulates the levels of the ZDHHC(s) which catalyze(s) the S-palmitoylation of NFATC4. Genetic analyses in humans and mice suggest that mutations in genes encoding the ZDHHCs are associated with several neurological/neuropsychiatric disorders. For example, ZDHHC8-knockout mice have been reported to develop impaired dendritic growth and cognitive deficits62, 63. Interestingly, S-palmitoylation of post synaptic density protein-95 (PSD95) is significantly down regulated in ZDHHC8-deficient neurons23. We identified NFATC4 as a potential physiological substrate of ZDHHC8. Moreover, our results showed that reduced S-palmitoylation of NFATC4 in CLN1 disease dysregulated lysosomal calcium homeostasis. We hypothesize that induced expression of some of these enzymatically active palmitoyl-acyltransferases may have therapeutic implications.
Impaired lysosomal degradative function has been reported to underlie pathogenesis of a family of >60 LSDs as well as common neurodegenerative diseases like Alzheimer’s and Parkinson’s 8, 9, 64, 65. The acid hydrolases like cathepsin D (CTSD) and tripeptidyl peptodase-1 (TPP1) facilitate the efficient degradation and clearance of intracellular proteins delivered to the lysosome via endocytosis and autophagy. These enzymes require Ca++ for their catalytic activity. Dysregulation of this process leads to lysosomal accumulation of undegraded cargo leading to neurodegeneration, often encountered in most LSDs8, 9. 66. The lysosome, like the ER, is also the major intracellular storage depot of Ca++. In addition, Ca++ has an essential role in the release of neurotransmitters37 and it is one of the most common second messenger in the cell. Moreover, lysosomal Ca++ is essential for vesicular trafficking, autophagy, signal transduction, nutrient sensing, and the repair of membranes67, 68. Dysregulated transport of Ca++ from the ER to the lysosome may impair lysosomal Ca++ homeostasis. The results of our study show that this defect contributes to pathogenesis in a mouse model of a fatal neurodegenerative LSD, CLN1 disease.
Despite the discovery that PPT1 mutations underlie INCL (CLN1 disease)18, the precise mechanism of its pathogenesis has remained elusive for more than two decades. The lysosomal hydrolases, many of which are Ca++-dependent enzymes, catalyze the degradation and clearance of the cargo which are delivered to the lysosome from intra and extracellular sources. Thus, lysosomal Ca++ homeostasis may serve a critical function to maintain the catalytic activities of these enzymes that are essential for the degradative function of this organelle. One possible mechanism of CLN1 disease pathogenesis is the lysosomal accumulation of S-palmitoylated proteins (major constituents of ceroid lipofuscin), which are refractory to degradation by lysosomal hydrolases20. Excessive lysosomal accumulation of ceroid lipofuscin, when consolidated, generates the granular osmiophilic deposits (GRODs), a pathognomonic feature of CLN1 disease11, 69, 70.
Dysregulated autophagy has been reported in common neurodegenerative disorders like Alzheimer’s64 and in many LSDs8, 9. The efficient autophagic degradation of cargo requires active Ca++-dependent lysosomal hydrolases. Our results show that impaired lysosomal Ca++ homeostasis may be at least one of the contributing factors underlying impaired autophagy, which may contribute to neuropathology in Ppt1−/− mice. Lysosomal dysfunction in brain diseases is emerging as an area of potential therapeutics development in neurodegenerative diseases. It has been suggested that pharmacological chaperones may be helpful in promoting proper folding and delivery of lysosomal components required for proteolysis64, 65. To date, enzyme- and gene-replacement have been explored in many lysosomal storage disorders, but the only enzyme replacement currently approved for use in the NCL family of patients is for CLN2- deficiency71. In our present study, we sought to explore the therapeutic potential of IP3R1-overexpression in CLN1-disease. Accordingly, we over-expressed IP3R1 in Ppt1−/− fetal mouse fibroblasts and determined whether it ameliorated the defect in autophagy and dysregulated lysosomal Ca++ homeostasis. We found that Ppt1−/− cells in which IP3R1 is overexpressed showed improved autophagy and Ca++ homeostasis. Correcting the defective lysosomal Ca++ homeostasis and restoring the catalytic functions of lysosomal hydrolases may restore the lysosomal function. This may promote efficient autophagy, which is dysregulated in virtually all LSDs8, 9 many of which manifest in neurodegeneration as exemplified in CLN1 disease.
METHODS
Animals
Wild type (WT) animals (C57BL/6J; Stock No. 000664) were purchased from the Jackson Laboratory (Bar Harbor, ME) and Ppt1−/− mice28 with C57BL/6J background was a generous gift from Dr. Sandra L. Hofmann, University of Texas Southwestern Medical Center, Dallas, TX. All animals were housed in a pathogen-free facility maintaining 12 h light/12 h dark cycles with access to water and food ad libitum.
Animal Study Approval
The animal procedures were carried out according to an animal study protocol (ASP#19–012) approved by the Eunice Kennedy-Shriver National Institute of Child Health and Human Development (NICHD), National Institutes of Health (NIH), Animal Care and Use Committee (ACUC). For each experiment, the animals were age- and sex-matched.
Cells and Cell culture
Primary cultures of fibroblasts were established from skin biopsy sample from an INCL patient (364A→T (p.Arg122Trp)70. admitted to a clinical protocol (http://www.clinicaltrials.gov; #01-CH-0086), which was approved by the Institutional Review Board (IRB) NICHD, NIH. The age and sex-matched normal human fibroblasts (GM00498) were obtained from Coriell Institute for Medical Research, Camden, New Jersey Fibroblasts from a normal subject and an INCL patient were cultured in DMEM (ThermoFisher scientific; Cat # 11965–092) with 10% heat inactivated fetal bovine serum (FBS), 2 mM glutamine, and 1% Pen-strep (ThermoFisher scientific; Cat # 15140–122). Cells were maintained in a humidified incubator at 37oC with 5% CO2 atmosphere. One day before performing the experiments, DMEM was replaced with Opti-MEM (ThermoFisher scientific; Cat #31985–070) and the cells were kept overnight in Opti-MEM to deplete Ppt1 contained in FBS. For culturing mouse fibroblast cells, skin samples from postnatal (P2-P4) pups of WT and/or Ppt1−/− genotype were used. The fibroblasts were maintained at identical conditions used for culturing Normal or INCL patient cells mentioned above. After three to four passages, the fibroblasts were plated at equal density such that they reach 50%−60% confluence in 24 hours for in vitro assays.
Calcium assays
Lysosomal calcium measurements were carried out as previously reported6, 40 with minor modifications. To quantitate the lysosomal Ca++ levels, we used Oregon Green™ 488 BAPTA-1 dextran (O6798; Thermo Fischer Scientific) and Ca++-insensitive TMR-dextran (D1868; Thermo Fischer Scientific). The ratio of fluorescence from Oregon Green™ 488 BAPTA-1 dextran (ex-494, em-523) and TMR (ex-555, em-580) allowed the measurement of lysosomal Ca++. For labelling experiments, the fibroblast cells were grown in DMEM media without FBS and then incubated with 0.25 mg ml−1 Oregon green-dextran and 0.1mg ml–1 TMR dextran for 12 h at 37°C. The dextran-containing media were then replaced with media without dextran and chased for 6–8 h to allow the dextran to accumulate in late endosomal/lysosomal compartment. The cells were visualized with the Zeiss LSM 710 Inverted Meta confocal microscope (Carl Zeiss) and the images were processed with the LSM Image Software (Carl Zeiss). The intensity of green- and red-fluorescence were used in the equation [Ca++] = Kd ×(R-Rmin)/(Rmax-R) to calculate the lysosomal Ca++ level. In this equation, R is the fluorescence ratio of Alexa Fluor 488 dextran (green) and TMR (red). Rmin represents the ratio in the absence of Ca++ whereas Rmax is the ratio in the presence of a saturating Ca++ 72. The Kd values of Oregon Green™ 488 BAPTA-1 dextran used for the above equation were determined in vitro at two different pH (4.6 and 5.5) values using a fluorescence plate reader (Flex station 3). Kd values obtained by generating a Ca++ calibration curve by taking fluorescence intensity of Oregon Green™ 488 BAPTA-1 dextran with solutions at different free [Ca++]. For measuring Ca++ flux, FLIPR® Calcium 6 Assay Kit (R8190; Molecular Devices) was used and assays were carried out according to the manufactures protocol.
For analyzing calcium flux from ER of the cells, single cells calcium imaging technique73 was used. Fibroblasts were plated in poly-L-lysine coated cover slips and left for attaching overnight in the incubator at 37°C and under a 5% CO2 saturated atmosphere in DMEM media. Next morning, culture medium was removed, and cells were incubated with 2 µM Fura-2 AM (Invitrogen) for 30 min at room temperature. After incubation cover slips were mounted in chambers for observation on an inverted Nikon TI2-U microscope attached to an Orca-Flash 4.0 SCI CMOS V3 camera (Hamamatsu Photonics, Hamamatsu City, Japan) for recording and a Retra II light source (Lumencor, USA) for 340 and 380 nm excitation. Baseline was recorded for 5 minutes and, after that, 5 µM ionomycin (Sigma Aldrich) was added for stimulation of ER calcium release. All recordings were performed on an inverted Nikon TI2-U microscope attached to an Orca-Flash 4.0 CMOS V3 camera (Hamamatsu Photonics) for recording and a Retra II light source (Lumencor) for 340 and 380 nm excitation. Experiments were performed under a 40x oil immersion objective and the alternate exposition to 340 and 380 nm beams was recorded by the Nikon Elements software (Nikon). The alterations in intracellular calcium [Ca++]i are determined by the ratio of fluorescence intensities between F340 and F380.
pH measurement
Lysosomal pH was determined as previously reported41 with minor modifications. Briefly, for labeling the lysosomes, fibroblasts were loaded with 1µM LysoSensor™ Yellow/Blue DND-160 at 37°C for 1– 2 minutes. The labelled cells were then washed three to four times in PBS and then resuspended in MES calibration buffer solution of varying pH (3.5–7.5) containing 5mM NaCl, 115mM KCl, 1.2mM MgSO4 and 25mM MES in the presence of 10 mM nigericin and 10 mM monencin. The ratio of the intensities of two emission spectra (at wavelengths 440 nm/550 nm) was plotted against pH to generate a standard curve against which the pH in normal and patient fibroblasts was determined. The normal and patient fibroblasts were loaded with the pH sensor and resuspended in the same calibration buffer (pH 7.5) in absence of nigericin and monencin for measuring the pH.
Lysosome enrichment
Lysosomes from cortical tissues from WT and Ppt1−/− mice were purified using Optiprep density gradient media provided in the lysosome isolation kit (LYSISO1, Sigma- Aldrich) and the supplier’s protocol was followed with minor modifications as follows: freshly isolated cortical tissues were homogenized in 4 volumes of 1 X extraction buffer containing Halt Protease Inhibitor (PI) Cocktail (Thermo Fisher; Cat#78430) and centrifuged at 1,000 x g for 10 min. The pellet was discarded, and supernatant was further centrifuged at 20,000xg for 20 min at 4°C to obtain the crude lysosomal fraction (CFL). The resultant pellet (CFL) was then resuspended in 1X extraction buffer and adjusted to 19% Optiprep and layered over 22.5% Optiprep in a multistep Optiprep gradient consisting of 27, 22.5, 19, 16, 12 and 8% Optiprep gradient and centrifuged for 4 h at 150,000xg in a Swinging-Bucket Rotor (SW 41 Ti) rotor. The fractions 2 and 3 from the top of the gradient were found to be lysosome-enriched by measuring β-N-acetylglucosaminidase activity and by detecting the lysosomal membrane marker, LAMP 2, by immunoblotting. Fractions 2 and 3 were therefore combined for all assays and immunoblotting experiments.
Cell fractionation
Cytosolic and nuclear fractions were isolated by using ProteoExtract® Subcellular Proteome Extraction Kit (Millipore Sigma, 539790–1KIT) according to the manufacturer’s protocol.
Plasma membrane isolation
The plasma membrane fractions were isolated using Plasma Membrane Protein Extraction Kit (Abcam, Cat#ab65400) according to the manufacturer’s protocol.
Western blot analysis
Western blot analyses were performed using brain tissues from two-, four- and six-month-old WT and Ppt1−/− mice. A total of four sets of animals (two sets for males and two sets for females) in each group were used. Each set contained one WT and one Ppt1−/− mice. The cortical section of the brain is homogenized in RIPA lysis buffer (Thermo Fischer, 89900) supplemented with protease and phosphatase inhibitors (Thermo Fischer, 78446) and the protein samples of 20µg each were resolved by electrophoresis using 4–12% SDS–polyacrylamide gel (Invitrogen) under denaturing and reducing conditions. The protein bands were electro-transferred to polyvinylidene difluoride membranes (Invitrogen), blocked with 5% nonfat dry milk (Bio-Rad) and then subjected to immunoblot analysis. The primary antibodies used for the immunoblots were as follows: IP3 Receptor 1 (D53A5) (Cell Signaling, 8568S; Lot# 1, dilution 1:500), NFATC4 (Abcam, ab62613; Lot# GR70691–12; dilution1:500), Phospho NFATC4 (S165) (Abcam, ab59204; Lot# GR172570–10; dilution1:500), Calcineurin B (R&D Systems, MAB1348, clone 212306; Lot# IYF0317101, dilution 1:500), Calmodulin (Abcam, ab45689; Lot# GR291267–17, dilution 1:500), LAMP2 (Abcam, ab13524; Lot# GR3221693–4; Dilution 1:1,000), pan-cadherin (Abcam, ab6528; dilution 1:1,000), Histone H3 (Cell Signaling, 14269S; Lot#; 2 dilution 1:1,000), LC3B ( Abcam, ab51520; Dilution 1:1,000), p62 (Novus Biologicals, NBP1–49956), β-actin (US Biological), ZDHHC4 (ab235369, Lot#; GR3251170–3, dilution 1:500 ), ZDHHC8 (Everest Biotech Ltd., EB07652-LOT P1, dilution 1:500), ZDHHC11 (Novus Biologicals, NBP2–15166. Lot# 40709, dilution 1:500), Anti HA (Cell Signaling, C29F4S, Lot#; 3724S, dilution 1:1,000) Anti Flag (Sigma, F1804–200µg, Lot#; SLBX2256, dilution 1:1,000). The blots were then probed with HRP-conjugated secondary antibodies (Santa Cruz Biotechnology) followed by detection using Super Signal west femto or pico solution (Pierce, Thermo Scientific) according to the manufacturer’s instructions. The chemiluminescent signals from the immunoblots were captured in image quant 4000 mini (GE Healthcare Lifesciences) and quantified by using the image quant IQTL software (GE Healthcare Lifesciences). Each experiment was repeated at least three times to confirm the reproducibility.
Confocal microscopy and imaging
Primary fibroblasts isolated from 1–2-day postnatal mouse skin were cultured on eight-well Nunc™ Lab-Tek™ Chamber Slide from Thermo Fischer. The cells were washed two to three times with PBS then fixed and permeabilized using 100% ice-cold methanol. After blocking with 10% normal goat serum, the cells were incubated with primary antibodies overnight at 4°C followed by Alexa Fluor- conjugated secondary antibodies (Life Technologies (Thermo Fisher Scientific) (dilution 1:1000) for 1 h at room temperature. The primary antibodies used were IP3 Receptor 1 (D53A5) (Cell Signaling, 8568S; Lot# 1 dilution 1:200), LAMP2 (Abcam, ab13524; Lot# GR3221693–4; Dilution 1:500), NFATC4 (Abcam, ab62613; Lot# GR70691–12; dilution1:500), LC3B (ab51520; dilution 1:200). Cells were mounted using DAPI-Fluoromount G (Thermo Fisher, 010020) and fluorescence was visualized with the Zeiss LSM 710 Inverted Meta confocal microscope (Carl Zeiss). The images were processed with the LSM Image Software (Carl Zeiss). Mender’s (colocalization coefficient was calculated using the Zen Desk Software from Zeiss.
Proximity Ligation Assay
For detection of ER–lysosome contacts, Normal and INCL fibroblasts were seeded on coverslips, fixed and permeabilized with methanol, followed by PLA according to manufacturer’s protocol (SigmaAldrich, Duolink In Situ Detection Reagents) In brief, after permeabilization, the cells were blocked with PLA blocking buffer and incubated with anti IP3R1 (Cell Signaling, 8568S; Lot#1, dilution 1:200) and anti-LAMP2 antibodies (ProteinTech Group, 66301–1-1g, dilution 1:100)—either alone or in combination, for overnight at 4°C, then hybridized with PLA probes; anti-rabbit-MINUS (Sigma-Aldrich; DUO82005 for IP3R1 antibody) and anti-mouse-PLUS (Sigma-Aldrich; DUO82001 for LAMP2 antibody), subjected to ligation and amplification reaction using Duolink Duolink In Situ Detection Reagents Green (Sigma-Aldrich; DUO92014–100RXN) according to the manufacturer’s protocol. The cells were mounted with DAPI-Fluoromount G (Thermo Fisher, 010020) and visualized with Zeiss 710 inverted confocal microscope. The number of PLA puncta were quantified using Image J software.
Electron Microscopy
Mice were transcardially perfused and fixed with 2.5% glutaraldehyde plus 4% PFA in PBS buffer, pH 7.4. Brains were removed and left to post-fix overnight in the same fixative at 4°C. Next, brains were cut coronally at 100 microns on a Leica Vibratome and rinsed in 0.1M sodium cacodylate buffer. For fibroblasts, the cells were fixed with 2.5% glutaraldehyde, made in 0.1M sodium cacodylate buffer. Cells were then rinsed in 0.1M sodium cacodylate buffer.
The following processing steps were carried out using the variable wattage Pelco BioWave Pro microwave oven (Ted Pella, Inc., Redding, CA): Mouse brains were post-fixed in 1% osmium tetroxide made in 0.1M sodium cacodylate buffer, rinsed in double distilled water (DDW), treated with 2% (aq.) uranyl acetate, DDW rinse, ethanol dehydration series up to 100% ethanol and propylene oxide, followed by a Embed-812 resin (Electron Microscopy Sciences, Hatfield, PA.) infiltration series up to 100% resin. The epoxy resin was polymerized for 20 hours in an oven set at 60° C. Ultra-thin sections were cut on a Leica EM-UC7 Ultramicrotome (90nm). Thin sections were picked up and placed on 200 mesh cooper grids and post-stained with uranyl acetate and lead citrate. Imaging was accomplished using a JEOL-1400 Transmission Electron Microscope operating at 80kV and an AMT BioSprint-29 camera.
RNA isolation and real-time RT–PCR
Total RNA was isolated from cortical tissues of WT and Ppt1−/− mice using the RNA easy Mini Kit (QIAGEN) followed by cDNA synthesis using the High-Capacity RNA-to-cDNA Kit (Applied biosystems, 4387406) according to the manufacturer’s instructions. The levels of mRNA expression were quantified by real-time RT-PCR using PowerUP™SYBR™ Green Master Mix (applied biosystems, A25742) in QuantStudio 3 system. The data were analyzed by using the Applied Biosystems qPCR Analysis software. The Ct values were calculated using GAPDH as the control. The primers used for mouse IP3R1-mRNA are: Forward-5’-GAG ATG AGC CTG GCT GAG GTT CAA −3’; Reverse-5’- TGT TGC CTC CTT CCA GAA GTG CGA −3’ and for human IP3R1-mRNA are: Forward-5’- ACA TCC TCC GGA AAC AGC AG −3’; Reverse-5’- GTC ATC CAA GTC CAG TGG GG −3’.
Immunohistochemistry
The WT and Ppt1−/− mouse brain tissue was fixed in 4.0 % paraformaldehyde (wt / vol), embedded in paraffin, and processed for histological analyses. Briefly, the paraffin-embedded tissue sections were first treated with xylene and then successively passed through varying percentages of ethanol (100% to 0%). Then the tissue sections were incubated in HEPES buffer (5mM HEPES, 1mM EDTA, 0.05% Triton X-100, pH=8.0) at 80°C for 10 minutes for antigen retrieval. After deparaffinization and antigen retrieval Quencher (Biotium, 23007) in 70% ethanol and kept for 1 min. at room temperature. This protocol was used because it suppresses background autofluorescence characteristically present in tissue sections from Ppt1−/− mice, which may interfere with immunofluorescence. Sections were then blocked with 10% normal goat serum (wt / vol) (Life Technologies (Thermo Fisher Scientific, 500062Z, Lot# 1857903A), probed overnight with primary antibody to IP3R1(Cell Signaling, 8568S; Lot# 1, dilution 1:200). Sections were then washed three times with 1x PBS, incubated with Alexa Fluor-conjugated secondary antibody (Life Technologies (Thermo Fisher Scientific; dilution 1:1000) for 1 h at 23–25°C followed by washing for three times with PBS. The sections were mounted using DAPI-Fluoromount G (Thermo Fisher, 010020). Cells visualized in Zeiss LSM 710 Inverted Meta confocal microscope (Carl Zeiss) followed by fluorescent intensity calculation at least 4 different regions of the tissue sections using the Zen Desk Software from Zeiss.
Mutagenesis of NFATC4
FLAG-NFATC4 cDNA-construct was purchased from Origene (Cat no # MR211104). S-palmitoylation site mutants (Cys6Ala and Cys43Ala) were generated by PCR using the Quik Change Site-directed Mutagenesis Kit from Agilent Technologies as instructed by the supplier (Bioinnovatise, Rockville, MD). The mutations were confirmed by direct DNA sequencing. The primers used for mutagenesis are: NFATC4-Cys6A; Forward:5’- CGA TCG CCA TGG GGG CCG CAA GCG CCG AGG ATG AGG AGC TGG AAT TTA AGC TG-3’ Reverse:5’-CAG CTT AAA TTC CAG CTC CTC ATC CTC GGC GCT TGC GGC CCC CAT GGC GAT CG-3’; NFATC4-Cys43A; Forward:5’-GCT GGA CTC AGA GGA TAC CCC TCC A GC CTG TCG TTT GGC CCT GGG GGA ACC-3’; Reverse:5’- GGT TCC CCC AGG GCC AAA CGA CAG GCT GGA GGG GTA TCC TCT GAG TCC AGC-3’
Transfection of HEK-293 cells with cDNA constructs and shRNA
HEK293T cells and mouse primary fibroblasts were transfected with either cDNA constructs of wild type NFATC4 or mutant NFATC4 constructs. For knockdown experiment, HEK293T cells were transfected with scrambled shRNA (GE, Dharmacon, RHS4346), ZDHHC4 shRNA (RHS4430–200278146) and ZDHHC8 shRNA (RHS4430–200289047) using Lipofectamine 3000 (Invitrogen) according to the manufacturer’s protocol. ZDHHC4 and ZDHHC8 shRNAs were purchased from Horizon Discovery, Dharmacon. The plasmids used for transfection were prepared using a Plasmid Midi Kit (Qiagen).
Acyl Rac Assay
The acyl-Rac assay52 was used to determine the S-palmitoylation of NFATC4 with minor modifications. Briefly, HEK-293 T cells transfected with Flag-tagged NFATC4–cDNA or C6A-cDNA or C43A-cDNA constructs were lysed with RIPA buffer (Pierce), and the lysates were incubated in blocking buffer (100 mM HEPES, 1mM EDTA and 2.5% SDS, pH 7.2) with 50mM N-ethylmaleimide (NEM; Sigma-Aldrich, E3876–5G) for 1 h at 50°C with frequent vertexing at 15-minute intervals. The samples were subjected to precipitate by three volumes of ice cold 100% acetone at −20°C for 20 minutes followed by precipitation by centrifugation at 5000g for 10 minutes. After washing the pellets three times by 70% acetone, they were dissolved in binding buffer (100 mM HEPES, 1 mM EDTA, 1% SDS, pH 7.2) and was divided into two equal aliquots. One aliquot was treated with 1M Hydroxylamine hydrochloride (HA) (Sigma-Aldrich, 159417–100G), pH 7.4 in presence of freshly prepared Thiopropyl Sepharose 6B (GE healthcare, 17042001) beads. The second aliquot was treated with Thiopropyl Sepharose 6B but PBS was added instead of HA. An aliquot from each sample was kept as loading control before adding with the Sepharose beads. The proteins were precipitated by centrifugation after 4 h of incubation at room temperature with the beads. Following the precipitation, supernatants were collected as an unbound fraction to the beads (non-palmitoylated fraction). The precipitated proteins (palmitoylated fraction) were solubilized, and they were resolved by SDS–PAGE under denaturing and reducing conditions. Samples were then subjected to immunoblotting using FLAG-antibody (F-3165, Sigma-Aldrich, Dilution 1: 1,000). We used brain homogenate of WT and Ppt1−/− mouse in the acyl-Rac assay for detection of palmitoylation status of endogenous NFATC4.
Enzyme activity assay for CTSD and TPP1
Lysosomal cathepsin D (CTSD) enzymatic activities were measured using a fluorometric assay kit from Abcam (Cat # ab65302) according to the manufacturer’s protocol in a 96-well assay format. Briefly, after isolating the lysosomes from WT and Ppt1−/− mouse brain, lysosomes were washed three times with water, then lysed by Ca++-free CD lysis buffer. Lysosomal lysates were then incubated in CD reaction buffer and CD enzymatic activity was measured according to manufacturer’s protocol. For measurement of TPP1 enzymatic activity, reaction was performed in a mixture of 100 μM Ala-Ala-Phe-7-amido-4-methylcoumarin (SIGMA, A3401), 10 μM trans-epoxysuccinyl-l-leucylamidobutane (E-64; SIGMA, E3132) and 1 μM Pepstatin A (Sigma, P5318) in 100 mM acetate buffer (pH=4.0), with 0.1% TritonX-100. Lysosomal lysates were incubated at 37 °C for 30 min. After incubation, TPP1 enzyme activity was stopped by addition of 100µl of 0.5 M glycine-carbonate buffer (pH=9.7). Each enzyme activity was measured as fluorescence by Flex station 3 microplate reader (Ex355nm/Em460nm). All assays were performed in triplicate.
Proteasome assay
The proteasome activity in the brain of 2-, 4- and 6-month-old Ppt1−/− and WT mice was determined by fluorometric proteasome activity assay kit (cat#ab107921) from Abcam. All the procedures were performed according to the manufacturer’s protocol.
Statistical analysis
The data are represented as the mean ± s. d. and the ‘n’ numbers represent the number of biological replicates for each experiment. Two-sample permutation t-tests were performed to compare the independent groups (i. e. WT and Ppt1−/− mice) and p<0.05 was considered significant. The p values are shown on the Figures or mentioned in the Figure legends. A minimum of three biological replicates per condition were used for quantitation. A biological replicate is defined as individual animals or an independent culture of cells. The number of replicates is indicated in the Figures or in the legends. All quantitative data were analyzed using Graph-Pad Prism.
Supplementary Material
Supplementary Figure Legends
FIGURE S1 Determination of calcium and pH in the lysosome.
Reduced level of calcium flux from endoplasmic reticulum of Ppt1−/− mouse fibroblasts (red) compared to WT (blue) fibroblasts. The arrow indicates the time at which ionomycin (A) or thapsigargin (B) was added to the cells. The curves shown here are the mean of three independent measurements for both normal and INCL fibroblasts. Lysosomal pH was measured by loading the normal (C) and INCL fibroblast cells (D) with DND-189 (n=30 for normal and n=30 for patient; scale bars 20 µm). (E), Calibration curve for the measurement of lysosomal pH was generated by plotting the ratio between fluorescence intensities from cells loaded with pH-sensitive DND-160 at varying pH as indicated. (F) and (G), The Kd values of Oregon Green™ 488 BAPTA-1 dextran used for measuring lysosomal Ca++ were determined in vitro at two different pH (4.6 and 5.2). The Kd values after calculation are shown in the inset of each graph.
FIGURE S2 Electron microscopy images of ER-Lysosome contact sites
Electron microscopy (EM) images of lysosomes and ER in control WT and Ppt1−/− mice brain (A); Normal and INCL fibroblasts (B). Arrows in black indicate close apposition between the contact sites between ER-lysosome. ER; Endoplasmic reticulum, L; Lysosome, M; Mitochondria
FIGURE S3 Analysis of potential S-palmitoylation sites in NFATC4 by CSS-Palm
(A), Alignment of NFATC4 peptide sequence from five different species to show that the Cys-43 (red) which is the S-palmitoylation site is evolutionary conserved. The mouse NFATC4 construct (indicated by red dotted box) was used for the mutation of Cys43Ala. (B), Acyl Rac Assay of WT NFATC4 and Cys6Ala mutant form of NFATC4, transfected in HEK293T cells. Note that the mutant form of NFATC4 (Cys6Ala) and WT NFATC4 both shows palmitoylation, ruling out the possibility that Cys6 in NFATC4 is the S- palmitoylation site. Western blot analysis showing shRNA-knockdown of ZDHHC4 (C) and ZDHHC8 (D) in HEK 293T cells. Scramble shRNA was used as a control. (E), ZDHHC11 level in WT and Ppt1−/− mouse brain (n = 4 animals in each group, p<0.05. (F), Proteasome activity in the brain of WT and Ppt1−/− mice at different age groups. The values are expressed as mean ±SD (n=4 animals in each group, p<0.05; NS=non-significant). Note that there is a significant and progressive increase in proteasomal activity in the brain of Ppt1−/− mice from 2-month-old mice. (G), Western blot showing IP3R1 level in normal, INCL and INCL fibroblasts overexpressing HA-tagged IP3R1 construct (denoted by INCL+ IP3R1) The bands were detected by blotting with IP3R1 antibody.
Figure 9: A Schematic showing NFATC4-mediated IP3R1-expression, dysregulation of which disrupts lysosomal Ca++-homeostasis in Ppt1−/− mice.
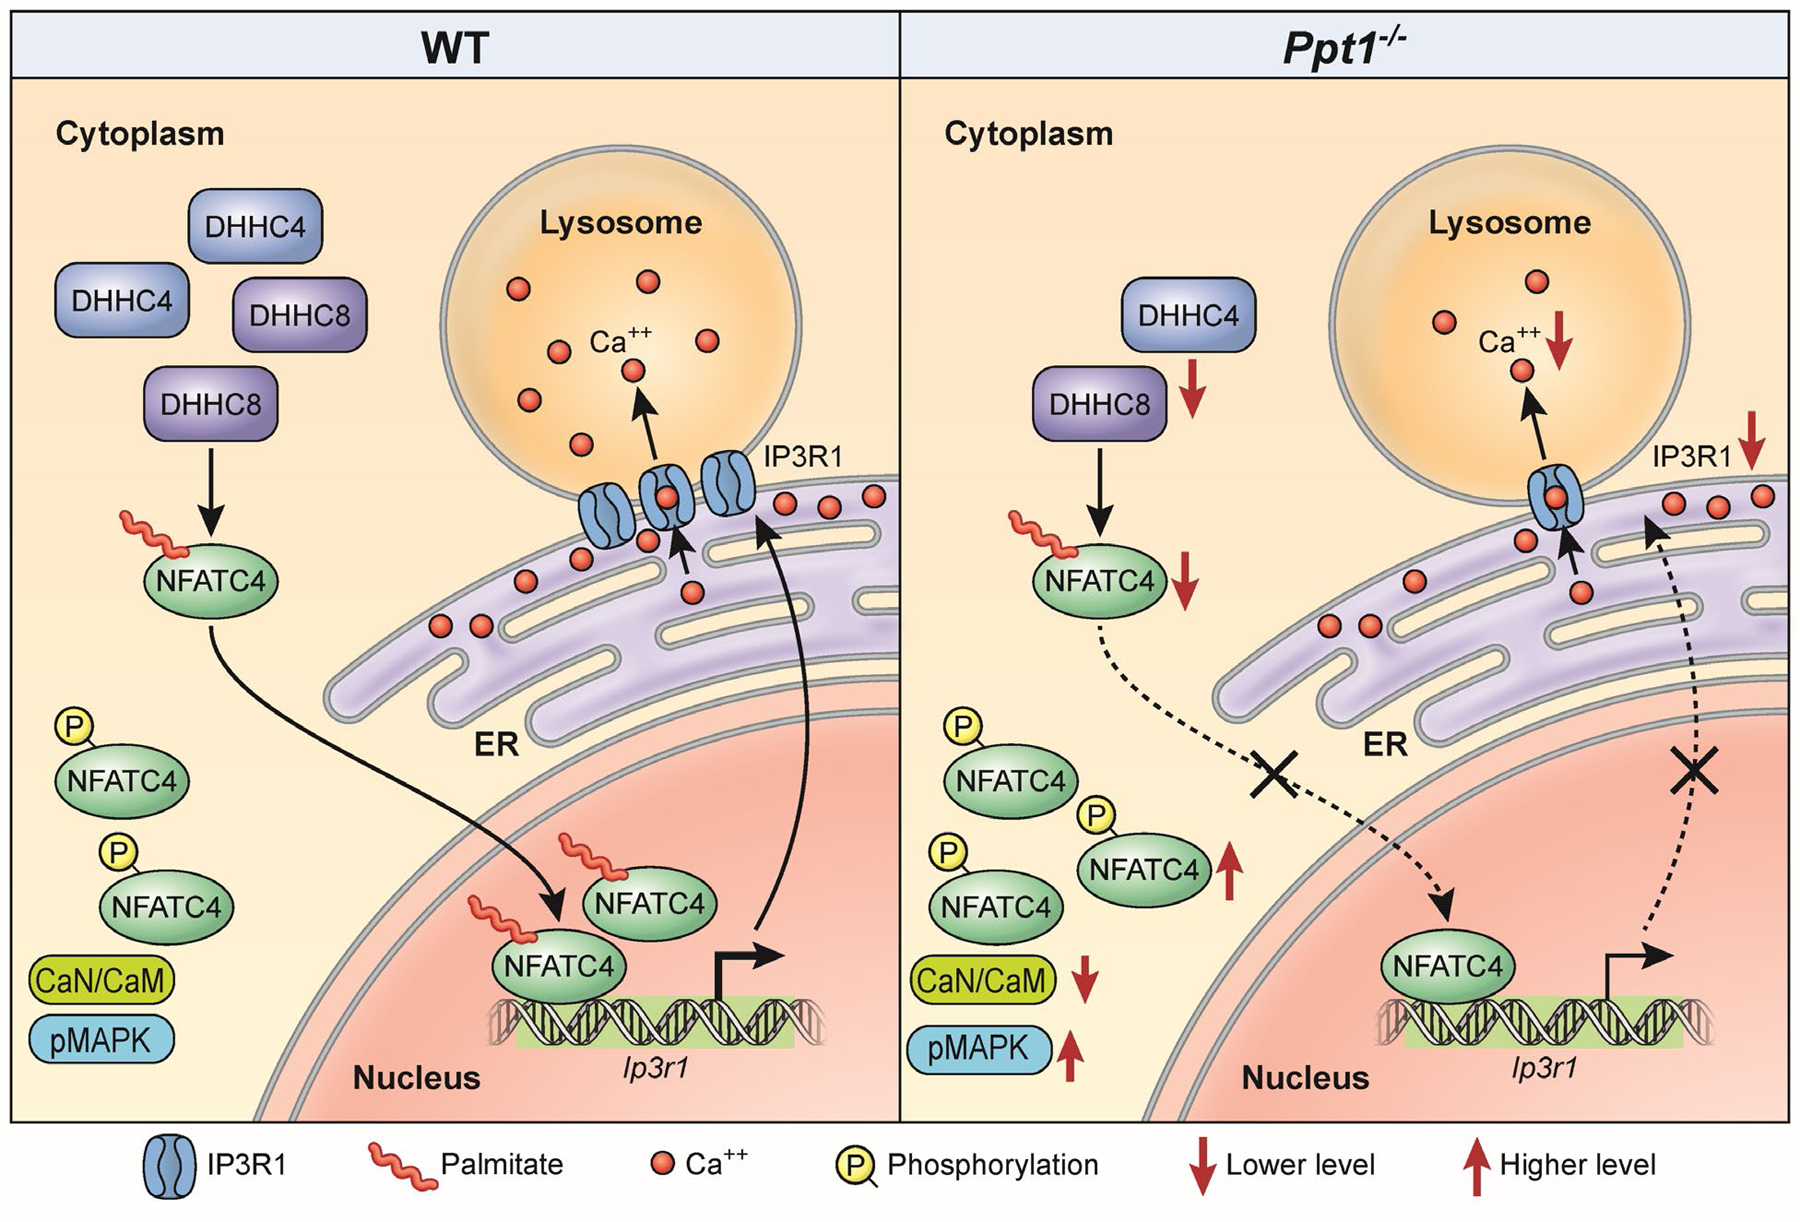
In Ppt1−/− mouse brain, due to reduced levels of two palmitoyl acyl transferase enzymes (i.e., ZDHHC4 and ZDHHC8), suppress S-palmitoylation of NFATC4, preventing its translocation from the cytosol to the nucleus. This defect dysregulates Ip3r1 expression, thereby suppressing the transport of Ca++ from the ER to the lysosome. CaN, Calcineurin; CaM, Calmodulin; ER, Endoplasmic reticulum; p-MAPK, phosphorylated mitogen-activated protein kinase.
Acknowledgments
We thank Professor Masaki Fukata, National Institute for Physiological Sciences (NIPS), National Institutes of Natural Sciences (NINS), Myodaiji, Okazaki, Japan, for the generous gift of the ZDHHC clones. We also thank Dr. Janice Y Chou for critical review of the manuscript and helpful suggestions. We also thank Ms. Lynne Holtzclaw and Dr. Louis Dye from microscopy and Imaging core for helping with electron microscopic analyses. This research was supported in full by the Intramural Research Program of the Eunice Kennedy Shriver National Institute of Child Health and Human Development, The National Institutes of Health.
Abbreviations
- LSD
Lysosomal Storage Disease
- INCL
Infantile Neuronal Ceroid Lipofuscinosis
- IP3R1
Inositol 1, 4, 5-triphosphate Receptor Type-1
- CLN1
Ceroid Lipofuscinosis Neuronal 1
- NFATC4
Nuclear Factor of Activated T-cells, Cytoplasmic 4
- PPT1
Palmitoyl Protein Thioesterase-1
- GPN
Gly-Phe β-naphthylamid
- NAADP
nicotinamide adenine dinucleotide phosphate
- ER
Endoplasmic Reticulum
- LAMP2
Lysosome-associated Membrane Protein
- CTSD
Cathepsin D
- TPP1
Tripeptidyl Tripeptidase-1
- MAPK
Mitogen-Activated Protein Kinase
- GRODs
Granular Osmiophilic Deposits
Footnotes
Competing interests. All authors declare no competing interest in this research.
Materials & Correspondence. Correspondence and material requests should be addressed to Dr. Avisek Mondal.
Data availability
Data will be shared upon request from Dr. Avisek Mondal (e-mail: avisek.mondal@nih.gov).
References
- 1.De Duve C & Wattiaux R Functions of lysosomes. Annu. Rev. Physiol 1966; 28: 435–492. [DOI] [PubMed] [Google Scholar]
- 2.Mukherjee AB, et al. Emerging new roles of the lysosome and neuronal ceroid lipofuscinoses. Mol Neurodegener 14, 4 (2019). [DOI] [PMC free article] [PubMed] [Google Scholar]
- 3.Parenti G, Andria G & Ballabio A Lysosomal storage diseases: from pathophysiology to therapy. Annu Rev Med 2015; 66: 471–486. [DOI] [PubMed] [Google Scholar]
- 4.Platt FM, Boland B & van der Spoel AC The cell biology of disease: lysosomal storage disorders: the cellular impact of lysosomal dysfunction. J. Cell Biol 2012; 199: 723–734. [DOI] [PMC free article] [PubMed] [Google Scholar]
- 5.Futerman AH & van Meer G The cell biology of lysosomal storage disorders. Nat Rev Mol Cell Biol 2004; 5: 554–565 [DOI] [PubMed] [Google Scholar]
- 6.Lloyd-Evans E & Platt FM Lysosomal Ca(2+) homeostasis: role in pathogenesis of lysosomal storage diseases. Cell Calcium 2011; 50: 200–205 [DOI] [PubMed] [Google Scholar]
- 7.Medina DL et al. Lysosomal calcium signalling regulates autophagy through calcineurin and TFEB. Nat Cell Biol 2015;17: 288–299. [DOI] [PMC free article] [PubMed] [Google Scholar]
- 8.Fraldi A, Klein AD, Medina DL, & Settembre C Brain disorders due to lysosomal dysfunction. Annu. Rev. Neurosci 2016; 39: 277–295 [DOI] [PubMed] [Google Scholar]
- 9.Seranova E et al. Dysregulation of autophagy as a common mechanism in lysosomal storage diseases. Essays Biochem 2017; 61:733–749. [DOI] [PMC free article] [PubMed] [Google Scholar]
- 10.Proia RL & Wu YP Blood to brain to the rescue. J. Clin. Invest 2004; 113: 1108–1110 [DOI] [PMC free article] [PubMed] [Google Scholar]
- 11.Goebel HH & Wisniewski KE Current state of clinical and morphological features in human NCL. Brain Pathol 2004;14: 61–69 [DOI] [PMC free article] [PubMed] [Google Scholar]
- 12.Nelvagal HR, Lange J, Takahashi K, Tarczyluk-Wells MA & Cooper JD Pathomechanisms in the neuronal ceroid lipofuscinoses. Biochim Biophys Acta Mol Basis Dis 2020;1866:165570. [DOI] [PubMed] [Google Scholar]
- 13.Palmer DN, Barry LA, Tyynelä J & Cooper JD NCL disease mechanisms. Biochim Biophys Acta 2013; 1832: 1882–1893 [DOI] [PubMed] [Google Scholar]
- 14.Anderson GW, Goebel HH, & Simonati A Human pathology in NCL. Biochim Biophys Acta 2013; 1832:1807–1826. [DOI] [PubMed] [Google Scholar]
- 15.Mole SE et al. Clinical challenges and future therapeutic approaches for neuronal ceroid lipofuscinosis. Lancet Neurol 2019;18: 107–116 [DOI] [PubMed] [Google Scholar]
- 16.Mole SE & Cotman SL Genetics of the neuronal ceroid lipofuscinoses (Batten disease). Biochim Biophys Acta 2015;1852: 2237–2241 [DOI] [PMC free article] [PubMed] [Google Scholar]
- 17.Santavuori P, Haltia M & Rapola J Infantile type of so-called neuronal ceroid-lipofuscinosis. 1. A clinical study of 15 patients. Dev Med Child Neurol 1974; 16: 644–653 [DOI] [PubMed] [Google Scholar]
- 18.Vesa J et al. Mutations in the palmitoyl-protein thioesterase gene causing infantile neuronal ceroid lipofuscinosis. Nature 1995; 376:584–587 [DOI] [PubMed] [Google Scholar]
- 19.Camp LA & Hofmann SL Purification, and properties of a palmitoyl-protein thioesterase that cleaves palmitate from H-Ras. J. Biol. Chem 1993; 268; 22566–22574 [PubMed] [Google Scholar]
- 20.Lu JY, Verkruyse LA & Hofmann SL Lipid thioesters from acylated proteins accumulate in infantile neuronal ceroid lipofuscinosis: correction of the defect in lymphoblasts by recombinant palmitoyl-protein thioesterase. Proc. Natl. Acad. Sci. USA 1996; 93:10046–10050 [DOI] [PMC free article] [PubMed] [Google Scholar]
- 21.Schmidt MFG Fatty acylation of proteins. Biochim. Biophys. Acta 1989; 988: 411–26 [DOI] [PMC free article] [PubMed] [Google Scholar]
- 22.Linder ME & Deschenes RJ Palmitoylation: policing protein stability and traffic. Nat Rev Mol Cell Biol 2007; 8, 74–84 [DOI] [PubMed] [Google Scholar]
- 23.Fukata Y & Fukata M Protein palmitoylation in neuronal development and synaptic plasticity. Nat Rev Neurosci 2010; 3: 161–175. [DOI] [PubMed] [Google Scholar]
- 24.Salaun C, Greaves J & Chamberlain LH The intracellular dynamic of protein palmitoylation. J Cell Biol 2010; 191: 1229–1238 [DOI] [PMC free article] [PubMed] [Google Scholar]
- 25.Tsutsumi R, Fukata Y & Fukata M Discovery of Protein-Palmitoylating Enzymes. Pflugers Arch 2008; 456: 1199–1206 [DOI] [PubMed] [Google Scholar]
- 26.Zeidman R, Jackson CS & Magee AI Protein acyl-thioesterases (Review). Mol Membr Biol 2009; 26: 32–41 [DOI] [PubMed] [Google Scholar]
- 27.Raymond FL et al. Mutations in ZDHHC9, which encodes a palmitoyltransferase of NRAS and HRAS, cause X-linked mental retardation associated with a Marfanoid habitus. Am J Hum Genet 2007; 80:982–987. [DOI] [PMC free article] [PubMed] [Google Scholar]
- 28.Gupta P et al. Disruption of PPT1 or PPT2 causes neuronal ceroid lipofuscinosis in knockout mice. Proc. Natl. Acad. Sci. USA 2001; 98: 3566–13571 [DOI] [PMC free article] [PubMed] [Google Scholar]
- 29.Bible E, Gupta P, Hofmann SL & Cooper JD Regional and cellular neuropathology in the palmitoyl-protein thioesterase-1 null mutant mouse model of infantile neuronal ceroid lipofuscinosis. Neurobiol. Dis 2004; 16: 346–359. [DOI] [PubMed] [Google Scholar]
- 30.Zhang Z et al. Palmitoyl-protein thioesterase-1 deficiency mediates the activation of the unfolded protein response and neuronal apoptosis in INCL. Hum Mol Genet 2006; 15: 337–346 [DOI] [PubMed] [Google Scholar]
- 31.Reddish FN, Miller CL, Gorkhali R & Yang JJ Calcium Dynamics Mediated by the Endoplasmic/Sarcoplasmic Reticulum and Related Diseases. Int J Mol Sci 2017; 18:1024. [DOI] [PMC free article] [PubMed] [Google Scholar]
- 32.Hu YX, Han XS & Jing Q Ca(2+) ion and autophagy. Adv Exp Med Biol 2019; 1206:151–166. [DOI] [PubMed] [Google Scholar]
- 33.Liu EA & Lieberman AP The interaction of lysosomal and endoplasmic reticulum calcium with autophagy defects in lysosomal diseases. Neurosci Lett 2019; 697:10–16 [DOI] [PMC free article] [PubMed] [Google Scholar]
- 34.Atakpa P, Thillaiappan NB, Mataragka S, Prole DL & Taylor CW IP3 Receptors preferentially associate with ER-lysosome contact sites and selectively deliver Ca2+ to lysosomes. Cell Rep 2018; 25: 3180–3193 [DOI] [PMC free article] [PubMed] [Google Scholar]
- 35.Garrity AG et al. The endoplasmic reticulum, not the pH gradient drives calcium refilling of lysosomes. eLife 2016; 5: Pii.e15. [DOI] [PMC free article] [PubMed] [Google Scholar]
- 36.Fredericks GJ et al. Stable expression and function of the inositol 1, 4, 5-triphosphate receptor requires palmitoylation by DHHC6/seleno-protein K complex. Proc. Natl. Acad. Sci. USA 2014;111: 16478–16483 [DOI] [PMC free article] [PubMed] [Google Scholar]
- 37.Sudhof TC Calcium control of neurotransmitter release. Cold Spring Harb. Perspect. Biol 2012; 4: a011353. [DOI] [PMC free article] [PubMed] [Google Scholar]
- 38.Sarkar C et al. Cln1-mutations suppress Rab7-RILP interaction and impair autophagy contributing to neuropathology in a mouse model of infantile neuronal ceroid lipofuscinosis. J Inherit Metab Dis 2020; 43: 1082–1101 [DOI] [PMC free article] [PubMed] [Google Scholar]
- 39.Isosomppi J et al. Developmental expression of palmitoyl protein thioesterase in normal mice. Developmwntal Brain Res 1999; 118: 1–11 [DOI] [PubMed] [Google Scholar]
- 40.Lloyd-Evans E et al. Niemann-Pick disease type C1 is a sphingosine storage disease that causes deregulation of lysosomal calcium. Nat Med 2008; 14:1247–1255 [DOI] [PubMed] [Google Scholar]
- 41.Sehgal P et al. Inhibition of the sarco/endoplasmic reticulum (ER) Ca 2+-ATPase by thapsigargin analogs induces cell death via ER Ca 2+ depletion and the unfolded protein response. J. Biol. Chem 2017; 292, 19656–19673 [DOI] [PMC free article] [PubMed] [Google Scholar]
- 42.Lin HJ, Herman P, Kang JS & Lakowicz JR Fluorescence lifetime characterization of novel low-pH probes. Anal Biochem 2001; 294: 118–125 [DOI] [PMC free article] [PubMed] [Google Scholar]
- 43.Bagh MB et al. Misrouting of v-ATPase subunit V0a1 dysregulates lysosomal acidification in a neurodegenerative lysosomal storage model. Nat Commun 2017; 8: 14612. [DOI] [PMC free article] [PubMed] [Google Scholar]
- 44.Soderberg O et al. Direct observation of individual endogenous protein complexes in situ by proximity ligation. Nat. Method 2006; 3: 995–1000 [DOI] [PubMed] [Google Scholar]
- 45.Höglinger D, Burgoyne T et al. NPC1 regulates ER contacts with endocytic organelles to mediate cholesterol egress. Nat Commun 2019; 10: 4276. [DOI] [PMC free article] [PubMed] [Google Scholar]
- 46.Graef IA et al. L-type calcium channels and GSK-3 regulate the activity of NF-ATc4 in hippocampal neurons. Nature 1999; 401: 703–708 [DOI] [PubMed] [Google Scholar]
- 47.Chow CW, Rincón M, Cavanagh J, Dickens M & Davis RJ Nuclear accumulation of NFATC4 opposed by the JNK signal transduction pathway. Science 1997; 278: 1638–1641 [DOI] [PubMed] [Google Scholar]
- 48.Shibasaki F, Price ER, Milan D & McKeon F Role of kinases and the phosphatase calcineurin in the nuclear shuttling of transcription factor NF-AT4. Nature 1996; 382: 370–373 [DOI] [PubMed] [Google Scholar]
- 49.Bosch ME & Kielian T Astrocytes in Juvenile Neuronal Ceroid Lipofuscinosis (CLN3) display metabolic and calcium signaling abnormalities. J Neurochem 2019; 148: 612–616. [DOI] [PMC free article] [PubMed] [Google Scholar]
- 50.Mathavarajah S, O’Day DH & Huber RJ Neuronal Ceroid Lipofuscinoses: Connecting Calcium Signalling through Calmodulin. Cells 2018; 7:188. [DOI] [PMC free article] [PubMed] [Google Scholar]
- 51.Yang TT, Xiong Q, Enslen H, Davis RJ & Chow CW Phosphorylation of NFATc4 by p38 mitogen-activated protein kinases. Mol Cell Biol 2002; 22: 3892–3904 [DOI] [PMC free article] [PubMed] [Google Scholar]
- 52.Fukata M, Fukata Y, Adesnik H, Nicoll RA & Bredt DS Identification of PSD-95 palmitoylating enzymes. Neuron 2004; 44: 987–996 [DOI] [PubMed] [Google Scholar]
- 53.Spinelli M, Fusco S & Grassi C Nutrient-Dependent Changes of Protein Palmitoylation: Impact on Nuclear Enzymes and Regulation of Gene Expression. Int J Mol Sci 2018; 19: 3820. [DOI] [PMC free article] [PubMed] [Google Scholar]
- 54.Ren J et al. CSS-Palm 2.0: an updated software for palmitoylation sites prediction. Protein Engineering, Design and Selection 2008; 21: 639–644 [DOI] [PMC free article] [PubMed] [Google Scholar]
- 55.Forrester MT et al. Site-specific analysis of protein S-acylation by resin-associated capture. J Lipid Res 2011; 52: 93–398 [DOI] [PMC free article] [PubMed] [Google Scholar]
- 56.Globa AK & Bamji SX Protein palmitoylation in the development and plasticity of neuronal connections. Curr Opin Neurobiol 2017;45:210–220. [DOI] [PubMed] [Google Scholar]
- 57.Kim PK, Hailey DW, Mullen RT & Lippincott-Schwartz J Ubiquitin signals autophagic degradation of cytosolic proteins and peroxisomes. Proc Natl Acad Sci U S A 2008; 105: 20567–20574 [DOI] [PMC free article] [PubMed] [Google Scholar]
- 58.Raffaello A, Mammucari C, Gherardi G, Rizzuto R. Calcium at the center of cell signaling: Interplay between endoplasmic reticulum, mitochondria, and lysosomes. Trends Biochem Sci 2016; 41:1035–1049 [DOI] [PMC free article] [PubMed] [Google Scholar]
- 59.Yang J, Zhao Z, Gu M, Feng X & Xu H Release, and uptake mechanisms of vesicular Ca2+ stores. Protein Cell 2019; 10: 8–19 [DOI] [PMC free article] [PubMed] [Google Scholar]
- 60.Llorens F et al. Altered Ca 2+ homeostasis induces Calpain-Cathepsin axis activation in sporadic Creutzfeldt-Jakob disease. Acta Neuropathol Commun 2017; 5:35. [DOI] [PMC free article] [PubMed] [Google Scholar]
- 61.Kuizon S et al. A critical tryptophan and Ca2+ in activation and catalysis of TPPI, the enzyme deficient in classic late-infantile neuronal ceroid lipofuscinosis. PLoS One 2010; 5: e11929. [DOI] [PMC free article] [PubMed] [Google Scholar]
- 62.Mukai J et al. Evidence that the gene encoding ZDHHC8 contributes to the risk of schizophrenia. Nature Genet 2004; 36: 725–731. [DOI] [PubMed] [Google Scholar]
- 63.Mukai J et al. Palmitoylation-dependent neurodevelopmental deficits in a mouse model of 22q11 microdeletion. Nature Neurosci 2008; 11:1302–1310. [DOI] [PMC free article] [PubMed] [Google Scholar]
- 64.Nixon RA The role of autophagy in neurodegenerative disease. Nature Medicine 2013; 19: 983–997 [DOI] [PubMed] [Google Scholar]
- 65.Ballabio A & Bonifacino JS Lysosomes as dynamic regulators of cell and organismal homeostasis. Nat Rev Mol Cell Biol 2020; 21: 101–118 [DOI] [PubMed] [Google Scholar]
- 66.Feng X & Yang J Lysosomal Calcium in Neurodegeneration. Messenger (Los Angel) 2016; 5: 56–66 [DOI] [PMC free article] [PubMed] [Google Scholar]
- 67.Corrotte M & Castro-Gomes T Lysosomes and plasma membrane repair. Curr Top Membr 2019; 84: 1–16 [DOI] [PubMed] [Google Scholar]
- 68.Reddy A, Caler EV & Andrews NW Plasma membrane repair is mediated by Ca(2+)-regulated exocytosis of lysosomes. Cell 2001; 106: 157–169 [DOI] [PubMed] [Google Scholar]
- 69.Gardner E & Mole SE The Genetic Basis of Phenotypic Heterogeneity in the Neuronal Ceroid Lipofuscinoses. Front Neurol 2021; 12:754045. [DOI] [PMC free article] [PubMed] [Google Scholar]
- 70.Levin SW et al. Oral cysteamine bitartrate and N-acetylcysteine for patients with infantile neuronal ceroid lipofuscinosis: a pilot study. Lancet Neurol 2014; 13: 777–787 [DOI] [PMC free article] [PubMed] [Google Scholar]
- 71.Schulz A, Ajayi T, Specchio N, et al. Study of intraventricular cerliponase alfa for CLN2 disease. N Engl J Med 2018; 378:1898–1907. [DOI] [PubMed] [Google Scholar]
- 72.Morgan AJ, Davis LC & Galione A Imaging approaches to measuring lysosomal calcium. Methods Cell Biol 2015; 126: 159–195 [DOI] [PubMed] [Google Scholar]
- 73.Bargi-Souza P et al. Loss of basal and TRH-stimulated Tshb expression in dispersed pituitary cells. Endocrinology 2015; 156: 242–254 [DOI] [PMC free article] [PubMed] [Google Scholar]
Associated Data
This section collects any data citations, data availability statements, or supplementary materials included in this article.
Supplementary Materials
Supplementary Figure Legends
FIGURE S1 Determination of calcium and pH in the lysosome.
Reduced level of calcium flux from endoplasmic reticulum of Ppt1−/− mouse fibroblasts (red) compared to WT (blue) fibroblasts. The arrow indicates the time at which ionomycin (A) or thapsigargin (B) was added to the cells. The curves shown here are the mean of three independent measurements for both normal and INCL fibroblasts. Lysosomal pH was measured by loading the normal (C) and INCL fibroblast cells (D) with DND-189 (n=30 for normal and n=30 for patient; scale bars 20 µm). (E), Calibration curve for the measurement of lysosomal pH was generated by plotting the ratio between fluorescence intensities from cells loaded with pH-sensitive DND-160 at varying pH as indicated. (F) and (G), The Kd values of Oregon Green™ 488 BAPTA-1 dextran used for measuring lysosomal Ca++ were determined in vitro at two different pH (4.6 and 5.2). The Kd values after calculation are shown in the inset of each graph.
FIGURE S2 Electron microscopy images of ER-Lysosome contact sites
Electron microscopy (EM) images of lysosomes and ER in control WT and Ppt1−/− mice brain (A); Normal and INCL fibroblasts (B). Arrows in black indicate close apposition between the contact sites between ER-lysosome. ER; Endoplasmic reticulum, L; Lysosome, M; Mitochondria
FIGURE S3 Analysis of potential S-palmitoylation sites in NFATC4 by CSS-Palm
(A), Alignment of NFATC4 peptide sequence from five different species to show that the Cys-43 (red) which is the S-palmitoylation site is evolutionary conserved. The mouse NFATC4 construct (indicated by red dotted box) was used for the mutation of Cys43Ala. (B), Acyl Rac Assay of WT NFATC4 and Cys6Ala mutant form of NFATC4, transfected in HEK293T cells. Note that the mutant form of NFATC4 (Cys6Ala) and WT NFATC4 both shows palmitoylation, ruling out the possibility that Cys6 in NFATC4 is the S- palmitoylation site. Western blot analysis showing shRNA-knockdown of ZDHHC4 (C) and ZDHHC8 (D) in HEK 293T cells. Scramble shRNA was used as a control. (E), ZDHHC11 level in WT and Ppt1−/− mouse brain (n = 4 animals in each group, p<0.05. (F), Proteasome activity in the brain of WT and Ppt1−/− mice at different age groups. The values are expressed as mean ±SD (n=4 animals in each group, p<0.05; NS=non-significant). Note that there is a significant and progressive increase in proteasomal activity in the brain of Ppt1−/− mice from 2-month-old mice. (G), Western blot showing IP3R1 level in normal, INCL and INCL fibroblasts overexpressing HA-tagged IP3R1 construct (denoted by INCL+ IP3R1) The bands were detected by blotting with IP3R1 antibody.
Data Availability Statement
Data will be shared upon request from Dr. Avisek Mondal (e-mail: avisek.mondal@nih.gov).