

Abstract
The effects of body fat mass on the elimination of 2,3,7,8-tetrachlorodibenzo-p-dioxin (TCDD) was examined in mice. When male C57BL/6J mice are fed a high-fat, simple carbohydrate diet (HFD) for 13 weeks, they develop an obese phenotype. In contrast, A/J mice fed an HFD do not become obese. After 13 weeks on a normal diet (ND) or HFD, male C57BL/6J and A/J mice received a single dose by gavage of 0.1 or 5.0 µg of 2,3,7,8-tetrachloro[1,6-3H] dibenzo-p-dioxin per kg body weight. Using classical pharmacokinetics, the blood elimination half-life of TCDD was approximately 10 and 2 times longer in the C57BL/6J on the HFD compared with the mice on the ND at 0.1 and 5.0 μg/kg doses, respectively. The diet did not increase the blood half-life of TCDD in the A/J mice, which did not get obese. Using a physiologically based pharmacokinetic model for TCDD that incorporated experimentally derived percent body fat mass and tissue partition coefficients, as well as data on hepatic sequestration, did not provide accurate predictions to the data and could not explain the increase in half-life of TCDD in the HFD groups. This work demonstrates that obesity influences the half-life of TCDD, but other undetermined factors are involved in its elimination because the increase in body fat mass, decreases in cytochrome P4501A2, and altered partition coefficients could not completely explain the prolonged half-life.
Keywords: dioxin, obesity, PBPK, pharmacokinetics, TCDD
Highlights
Obesity influences the elimination of 2,3,7,8-tetrachlorodibenzo-p-dioxin (TCDD).
Physiologically based pharmacokinetic (PBPK) modeling is a useful tool for risk analysis because it can help to determine the factors that influence TCDD elimination.
The PBPK model accurately reproduces the exposure profiles of the C57BL/6 and A/J mice on normal diet.
Factors other than lipid fraction, partition coefficient, and hepatic sequestration seem to influence the elimination of TCDD in obese C57BL/6J mice.
2,3,7,8-Tetrachlorodibenzo-p-dioxin (TCDD) is the most potent dioxin-like chemical. Dioxin-like chemicals are found in all strata of the ecosystem (Birnbaum, 1998; Devito et al., 1995; Van Miller et al., 1976; White and Birnbaum, 2009) and induce many biochemical, physiological, and toxicological responses, including the induction of cytochrome P4501A (CYP1A) and 1B isoforms; the modulation of growth factors and their receptors (Birnbaum, 1998; Birnbaum and Tuomisto, 2000; Chang et al., 2016; Devito and Birnbaum, 1994). The biological effects of TCDD are mediated through binding and activation of the aryl hydrocarbon receptor (AhR) (Birnbaum, 1998; Birnbaum and Tuomisto, 2000; Devito and Birnbaum, 1994; Diliberto et al., 1999). Several recent studies implicate dioxins and the AhR in the development of metabolic disorders (Chang et al., 2016; Chevalier and Fenichel, 2016; La Merrill et al., 2013). Along these lines, recent evidence points to the role of the AhR in regulating intermediary metabolism. Enhanced insulin sensitivity and improved glucose tolerance are observed in AhR-deficient mice (Wang et al., 2011), and the effects of a high fat, simple carbohydrate diet (HFD) are diminished in AhR-deficient mice (Jaeger et al., 2017).
One of the challenges in understanding the role of dioxins in the development of metabolic disorders is the association of this syndrome with obesity. Obesity can change the pharmacokinetics of a chemical but the effects differ dependent upon the specific metabolic or elimination pathways involved (Brill et al., 2012). The elimination of drugs that are metabolized predominately by CYP3A4 isoforms are decreased in obese patients compared with non-obese patients (Abernethy et al., 1984; Flechner et al., 1989; Yee et al., 1988). In contrast, elimination of drugs metabolized by CYP2E1 (Kharasch et al., 1994; Miller et al., 1980) and CYP1A2 (Abernethy et al., 1985; Caraco et al., 1995; Kamimori et al., 1987) are increased by obesity. Dioxins are lipophilic chemicals, and their pharmacokinetics can be influenced by obesity. The pharmacokinetics of TCDD are relatively well understood (Emond et al., 2005; Kerger et al., 2006; Michalek et al., 2003; Michalek and Tripathi, 1999). TCDD is predominately eliminated unchanged through biliary elimination in a variety of species including guinea pigs, rats, and humans (Abraham et al., 1989; Kreuzer et al., 1997; Olson, 1986). TCDD induces its own elimination at high exposure, and its pharmacokinetics are highly influenced by the percentage of body fat at low exposures (Emond et al., 2005). However, the impact of obesity on the elimination of TCDD remains uncertain (Michalek et al., 2003; Ruiz et al., 2016; Tuomisto et al., 2016).
Two strains of mice, A/J and C57BL/6J, used to study obesity differ in their susceptibilities to a high fat diet (Gallou-Kabani et al., 2007). When fed a high fat diet, C57BL/6J males develop obesity (predominantly mesenteric fat), hypertension, hypercholesterolemia, hyperinsulinemia and hyperglycemia, showing a high susceptibility to diet induced metabolic syndrome (Black et al., 1998; Gallou-Kabani et al., 2007; Surwit et al., 1988). The A/J mouse is resistant to the obesogenic and diabetogenic effects of a high fat diet (Black et al., 1998). Although C57BL/6J males develop a nonalcoholic fatty liver disease characterized by progression to nonalcoholic steatohepatitis, fibrosis, and cirrhosis, the A/J males are resistant to these conditions (Sinasac et al., 2016). A possible cause of increased adipose tissue content in C57BL/6J mice is an alteration of the β-adrenergic receptor function in white and brown adipocytes (Black et al., 1998). In contrast, C57BL/6J mice increase their leptin levels only in association with an increase in body weight (bw) in response to the HFD, and the leptin levels in C57BL/6J mice exceed those in A/J only after C57BL/6J mice develop massive obesity (Bardova et al., 2016).
Here, we examined the role of an HFD on the pharmacokinetics of TCDD. C57BL/6J mice were used because they develop obesity and metabolic syndrome in response to a high fat diet. A/J mice were also used because they do not become obese when fed a high fat diet. Because TCDD is highly lipophilic and accumulates in adipose tissue, we hypothesize that obese animals should have a longer half-life compared with their lean control counterparts. Obesity impacts more than just body fat mass, so in order to assess the role of increased adipose mass from the impact of other obesity induced changes, a physiologically based pharmacokinetic (PBPK) model for mice was used to analyze the data. The present study demonstrates that obesity increases the half-life of TCDD and the use for the PBPK model indicates that factors in addition to increased adipose mass are involved in these changes.
MATERIALS AND METHODS
Chemicals
2,3,7,8-Tetrachloro[1,6-3H]dibenzo-p-dioxin ([3 H]TCDD), molecular weight 322 g/mol, was synthesized by Radian Corp (Austin, TX) and purchased from Cambridge Isotope Laboratories (Woburn, MA). Specific activity was 39.5 Ci/mmol and purity of ≥98%. Purity was verified by reverse-phase high-performance liquid chromatography (System Gold, Beckman Instruments, Inc, Fullerton, CA) using a C18 µBondapak stainless-steel column (30 cm, 10 µm particle size) with a Guard-PAK precolumn insert (Waters, Milford, MA) and an isocratic solvent system of (85% methanol 15% water) at 1 ml/min. A radioactive flow detector (Beckman Model 171, Beckman Instruments) with a Flo-Scint III cocktail (Radiomatic Instruments, Tampa, FL) was used to monitor radioactivity. Unlabeled TCDD, also purchased from Cambridge Isotope Laboratories, had a reported purity ≥98% by gas chromatography–mass spectrometry. Unlabeled TCDD was initially dissolved in acetone, and the resulting solution was diluted with corn oil (Sigma Chemical Co, St. Louis, MO). Acetone was removed from the stock TCDD and corn oil solution by evaporation in a SpeedVac SVC 100 (Savant Instruments, Inc, Farmingdale, NY). Dosing solutions were prepared by adding the stock TCDD and corn-oil solution, and then adding [3 H]TCDD, as needed, to the corn oil. The 0.1 μg/kg dose was prepared with [3 H]TCDD at a concentration of 0.01 μg [3 H]TCDD/ml. This solution resulted in mice receiving approximately 0.4 μCi/mouse at the low dose. The 5.0 μg/kg dosing solution was prepared by adding 0.17 nmol of the [3 H]TCDD to 1.38 nmol of TCDD in 1 ml of corn oil. This results in a dosing solution of 0.5 μg/ml of total TCDD with mice receiving approximately 2 μCi/animal. Any remaining volatile solvent was removed through evaporation in the SpeedVac SVC 100. All other chemicals of the highest grade available were obtained from Sigma Chemical Co.
Animals and treatment
Weanling male C57BL/6J and A/J mice aged 3 to 4 weeks old (approximately 10 g) were obtained from Jackson Laboratories, Inc (Bar Harbor, ME). Prior to treatment, the mice were held in an U.S. Environmental Protection Agency (U.S. EPA) animal facility approved by AAALAC International (formerly the Association for Assessment and Accreditation of Laboratory Animal Care). Five mice were housed in each plastic cage, with heat-treated pine shavings as bedding. The mice were maintained at 21 ± 2°C with 50 ± 10% humidity on a photoperiod of 12 light:12 dark (06h00–18h00) with food and tap water ad libitum. All animal procedures were approved by the U.S. EPA’s Institutional Animal Care and Use Committee prior to use. Upon arrival, mice were placed on a normal diet (ND) consisting of 23.0% protein, 4.5% fat, 6.0% fiber, 8.0% ash, and 56.0% complex carbohydrates (Purina 5001 Rodent Chow). The mice were given 1 week to acclimate before the study began. At the start of the study, half of the mice were randomly placed on an HFD, consisting of 36.0% lard, 35.0% simple carbohydrates, and 20.5% protein (diet #1850 BioServ, Flemington, NJ). The other half of the mice were maintained on the ND of Purina 5001 Rodent Chow.
After 13 weeks on the HFD or the ND, the mice were exposed to a single oral dose 0, 0.1 or 5.0 µg [3 H]TCDD/kg bw in a corn oil vehicle at a dose volume of 10 ml/kg. Mice were terminated (5 mice per group) at 1, 3, 10, 20, 30, and 40 days postexposure for animals consuming the ND. For animals consuming the HFD, an additional set of control and TCDD treated mice were included at the start of the study and were terminated 60 days postexposure. During the post-TCDD exposure period, all groups received the same diet as during the pre-exposure period. At each of the time points, 5 mice were randomly euthanized, and their blood, liver, adipose tissue, kidney, skin, and muscle were sampled to determine TCDD-derived radioactivity. All dissectible body fat was removed and weighed for each mouse at each time point.
Tissue sample
Radioactivity in tissues from the 6 groups of each mouse strain, at different time points, was determined by combustion (Packard 306B Biological Oxidizer Packard Instrument Co, Downers Grove, IL), followed by liquid scintillation spectrometry (Beckman Scintillation Counter, Beckman Instruments). Briefly, the lung and liver were homogenized in 10 and 4 volumes of ice-cold buffer containing 10% glycerol, 250 mM sucrose, 1 mM dithiothreitol, 0.5 mM EDTA, 25 mM KCl, and 10 mM HEPES (pH 7.4) (Devito et al., 1993; Diliberto et al., 1995). Triplicate samples of 100 ml of liver and lung homogenate were combusted. Triplicate samples (100 mg/sample) of intact skin collected from the dorsal neck area were combusted. Triplicate samples of blood (200 mg/sample), muscle (100 mg/sample; right and left leg thigh muscles), and perirenal adipose tissue (50 mg/sample) were collected and combusted. The left and right kidneys were combusted individually. Previous studies have shown that the radioactivity localized in liver and adipose tissue is >95% unmetabolized TCDD (Kedderis et al., 1991), and this was assumed for all other tissues analyzed in the current study.
Western blot analysis
Liver microsomes were prepared based on the method of Devito et al. (1996). Microsomal protein concentrations were determined using a BioRad Protein Assay Kit. Microsomal protein samples were prepared in Biorad Laemmli sample buffer with 5% β-mercaptoethanol and loaded onto Biorad Criterion precast 10% Tris–HCl, 1.00 mm 26-well, 15 μl, gels and electrophoresed at 125 V for 90 min. Proteins were transferred to Biorad nitrocellulose membranes at 23 V for 30 min. To decrease gel to gel variability, samples were blocked by strain, diet, and time point. In addition, to compare the effects of diet on CYP1A2 protein levels, microsomal samples from the vehicle control animals from the ND and HFD C57BL/6J and A/J mice were reanalyzed on gels which were blocked by time point. Rat CYP1A2 supersomes (Corning Inc, Wilmington, NC) were used as a positive control and actin was utilized to correct for total protein loading across samples. A 10% milk solution was used for blocking of membranes. Primary antibody (Ab) for CYP1A2 came from Santa Cruz Biotechnology, Inc (K-15 sc-9836, goat IgG). Primary Ab for Actin was I-19 sc-1616, goat IgG, from Santa Cruz Biotechnology, Inc. The secondary Ab was Biotin-SP-conjugated Donkey Anti-Goat IgG from Jackson ImmunoResearch Laboratories, Inc and was used with peroxidase-conjugated streptavidin (Jackson ImmunoResearch Laboratories, Inc, West Grove, PA). For Immunodetection, SuperSignal West Femto Maximum Sensitivity Substrate from Pierce was used. Membranes were imaged with Biorad Flour-S-multi-imager and quantified with Biorad Quantity One imaging software. The linearity of the assay was assessed using the control microsomes. Samples from TCDD-treated animals were diluted appropriately to attain linearity of the response for CYP1A2 quantification. Animals in the 60-day time point were not include in the western blot analysis.
Use of classical pharmacokinetics to analyze the data
An initial analysis of the data was performed using a classical pharmacokinetic model (PK Solution package) in Microsoft Excel. This software was used to calculate pharmacokinetic parameters such as half-life (T½), volume of distribution (Vd), area under the curve (AUCobs), maximal concentration (Cmax), and the time when the maximum concentration in the systemic circulation was reached (Tmax). The software SPSS (version 24) was used to perform multiple regression/correlation tests, to evaluate whether the half-lives were different between treatment groups. Using SPSS (version 24), we determined the probability value, the t-value for the significance test, and the degrees of freedom. A probability value of p < .05 was used to indicate significance.
Use of PBPK model to simulate the experimental data
PBPK modeling is a pharmacokinetic approach that uses mathematical descriptions of absorption, distribution, metabolism, and excretion based on the interrelationships among physiological, biochemical, and physicochemical determinants of these processes (Andersen, 2003). This modeling approach is useful for characterizing the pharmacodynamic dose–response and the mode of action for xenobiotics or to generate hypotheses from clinical observations. In fact, PBPK models may be used to examine the pharmacokinetic differences among life stage conditions or to generate a hypothesis about the fate of an internal dose.
The intrinsic physicochemical and biological properties of chemicals are responsible for a large part of their kinetic behavior in vivo. For persistent and lipophilic xenobiotics, such as TCDD, two major parameters drive distribution and excretion. These two parameters are the body mass index, which refers to the adipose tissue fraction, and CYP1A2, which is responsible for sequestration of TCDD in the liver. The sequestration in the liver tissue depends upon the body burden (Emond et al., 2006; USEPA, 2012). Thus, at low body burden, distribution favors adipose tissue as the major storage compartment for TCDD. Nevertheless, when the body burden of TCDD is higher, there is a redistribution back from adipose tissue stores into the liver. Based on body burden, the importance of hepatic sequestration becomes significant above 200 ng TCDD/kg bw during sub-chronic exposure of mice, which is equivalent to approximately 15 ng TCDD/kg/d for 13 weeks (Diliberto et al., 2001).
Anatomical, physiological, and biochemical parameters such as tissue volumes, cardiac output, blood flows, partition coefficients (PCs), and permeability constants were extracted from the literature (USEPA, 2012). The PBPK model used for the current study was written with Advanced Continuous Simulation Language version 11.8.
The experimental conditions were simulated with two different conditions, as follows:
The same parameters were used for the current study as were employed in the National Center for Environmental Assessment (NCEA)’s dioxin reassessment (USEPA, 2012), except for the experimental adipose tissue fraction measured by dissection for each group of mice in this current study.
The data were simulated using the same parameters as were employed in NCEA’s reassessment, except that the experimental adipose tissue fraction for each group and the experimental estimates of PC were calculated from the tissue: blood concentration ratios between days 10 and 60 where the means were used in the model.
In addition, we evaluated optimizing the parameters describing the induction of CYP1A2 (Emond et al., 2006).
RESULTS
Experimental Data
Effects of diet on body weight
After 13 weeks on the HFD, the C57BL/6J mice fed an HFD (C57HFD) mice weighed significantly more than the C57BL/6J mice fed an ND (C57ND mice), 39.1 ±1.5 g versus 28.1± 0.7, respectively (Figure 1A and Supplementary Table 1). These changes correspond to a 39% increase in bw from the start of the study for the C57HFD mice compared with 10% for the C57ND mice. In contrast, the A/J mice that were fed the HFD (AJHFD) weighed only slightly more than the A/J mice that were fed the ND (AJND), 30.1 ± 5.7 g versus 26.6 ± 0.5 g, respectively (Figure 1B and Supplementary Table 1). These changes correspond to an increase in bw of 7% for the ND compared with 9.5% for the mice that were fed the HFD. After 13 weeks on either the ND or HFD, the mice were exposed to either corn oil vehicle or TCDD via gavage dosing. Forty days after exposure to TCDD, the increase in weight is relatively similar between the treated and untreated C57ND, AJND, and AJHFD. However, by the end of the study, the bw in the C57HFD mice exposed to either vehicle or TCDD were approximately 20 g heavier than the bw in vehicle or TCDD exposed C57ND, AJND, or the AJHFD mice. In addition, treatment with either 0.1 or 5.0 µg of TCDD/kg of bw did not have any effect on bw in any of the mice regardless of their diet (Figure 1 and Supplementary Table 1).
Figure 1.

Growth curves (in grams) for each mouse strain: (A) is C57BL/6J and (B) is A/J, consuming either an ND or an HFD after a single oral dose of vehicle or 0.1 μg or 5.0 μg of TCDD/kg bw. Body weight is presented in grams; days corresponds with the time post-TCDD exposure. For both the ND exposed to vehicle (full black line), 0.1 μg TCDD/kg bw (full dack grey line), and 5.0 μg TCDD/kg bw (full light grey line) μg TCDD/kg bw, and for HFD exposed to vehicle (dash black line), 0.1 μg TCDD/kg bw (dash dark grey line), and 5.0 μg TCDD/kg bw (dash light grey line).
Hepatic CYP1A2 Protein Levels
CYP1A2 concentrations were determined using western blot analyses of hepatic microsomes isolated from all animals in the study up through 40 days of treatment. The C57ND and A/J mice on the ND have similar CYP1A2 levels in hepatic microsomes (p > .5). In both the C57BL/6J and A/J mice, animals on the high fat diet had approximately a 40% decrease in microsomal CYP1A2 compared with their normal fed controls (p < .02) (Figure 2A). TCDD exposure resulted in a dose and time dependent induction of CYP1A2 in both strains and diets (Figs. 2B and 2C). Induction was evident 1 day after exposure and peaked between days 3 and 10. Animals on the high fat diet tended to have a higher fold induction of CYP1A2 compared with the mice on the ND, particularly at the high dose (Figs. 2B and 2C).
Figure 2.

Induction of CYP1A2 measured by western blot. A, The impact of an HFD on the expression of CYP1A2 in the vehicle controls normalized to the C57 ND mice at the same time point. B, Fold induction compared with vehicle control at time of necropsy for CYP1A2 for 0.1 and 5.0 µg of TCDD/kg in ND and HFD for the C57BL/6J. C, Fold induction compared with the vehicle control at time of necropsy for CYP1A2 for 0.1and 5.0 µg of TCDD/kg in ND and HFD for the A/J.
Tissue Dosimetry Profiles
At the low dose for both strains and diet, adipose tissue was the major depot for TCDD, followed by the liver. Other tissues such as the kidneys, muscle, skin, and blood had TCDD concentrations ranging from approximately 10 to 100 times less than the liver or adipose tissue (Supplementary Table 2A–D). Consistent with the literature reports of a dose-dependent hepatic sequestration of TCDD, at the high dose of 5.0 µg TCDD/kg bw, the liver had a higher TCDD concentration than the adipose tissue in both strains and diets (Figure 3 and Supplementary Table 2A–D). In mice consuming the ND, the hepatic sequestration is explained by the induction of CYP1A2, which binds TCDD. In the HFD groups, especially in the C57BL/6J mice, the increased concentration in the liver is likely explained by a combination of CYP1A2 induction and lipid accumulation in the liver, which is suggested by a higher PC for the HFD group and visual observation at necropsy.
Figure 3.

Amount of TCDD measured in liver and adipose tissue, expressed as % dose/tissue: (A) liver of C57BL/6J mice fed an ND or HFD at 0.1 or 5.0 µg/kg bw; (B) adipose tissue of C57BL/6J mice fed an ND or HFD at 0.1 or 5.0 µg/kg bw; (C) liver of A/J mice fed an ND or HFD at 0.1 or 5.0 µg/kg bw; (D) I adipose of A/J mice fed an ND or HFD at 0.1 or 5.0 µg/kg bw. The measurements were collected at 1, 3, 10, 20, 30, and 40 days for all mice; for HFD groups an additional time point at 60 days was added.
In the C57HFD mice, the concentrations in the liver and fat are approximately half of the levels found in the C57ND mice at both the high and low doses up to 30 days postexposure, when the concentrations are approximately equal (Figs. 3A and 3B). In blood, kidney, skin, and muscle, the TCDD concentrations are similar at the early time points between the two dietary groups (Supplementary Table 2A and B). However, at the later time points, the mice in the HFD groups have higher concentrations than those in the ND groups. These differences between the HFD and ND mice are also present when expressed as % dose per tissue. In contrast, in the A/J mice, diet does not alter tissue concentrations at either dose level (Figs. 3C and 3D and Supplementary Table 2C and D).
In the C57HFD mice, the half-life appears longer in the liver and adipose tissue than in the C57ND mice. In the C57HFD mice, the liver and adipose tissue TCDD concentrations remain constant from 20 to 60 days postexposure (Figs. 3A and 3B). A similar tissue concentration versus time curve is also observed for blood concentration in the C57HFD mice where the blood elimination curve is almost flat between 10 and 60 days (Figure 4A). The concentration in the kidneys also remain constant starting from 10 days postexposure. In muscle and skin, the TCDD concentration appear to increase slightly over time in the C57HFD mice (Supplementary Figure 1 and Table 2B). These findings suggest that the obese animals are only marginally eliminating TCDD and are at a pseudo steady-state at both the high and low dose exposures.
Figure 4.

Amount of TCDD measured in total blood expressed in % dose/tissue: (A) blood compartment for C57BL/6J mice fed an ND or HFD at 0.1 or 5.0 µg/kg bw; (B) blood compartment of A/J mice fed an ND or HFD at 0.1 or 5.0 µg/kg bw. The measurements were collected at 1, 3, 10, 20, 30, and 40 days and for HFD groups an additional time point at 60 days.
In contrast to what was observed in C57BL/6J mice, there was no significant difference in the % administered dose in the liver and adipose tissue between the A/J ND and those that consumed an HFD (Figs. 3C and 3D). This observation suggests that the HFD has a negligible impact on the elimination of TCDD in A/J mice (Figure 4B and Supplementary Figs. 2 [ng/kg] and 4 [% dose]). This is consistent with the nonsignificant difference in bw in the A/J mice consuming the HFD compared with the A/J mice on the ND (Figure 1B).
Comparisons of half-lives based on blood were evaluated (Figs. 5A and 5B and Table 1). For the C57BL/6J strain, the elimination is quicker for the mice that were fed an ND when compared with those that consumed an HFD (Figure 5A). The ratios of the half-life for the HFD to ND at 0.1 and 5.0 µg TCDD/kg bw are 10 and 2.1, respectively (Figure 5A and Table 1). For the A/J strain mice, the half-life ratios at 0.1 and 5.0 µg TCDD/kg bw are approximately 1.0 and 0.6, respectively (Figure 5B and Table 1).
Figure 5.
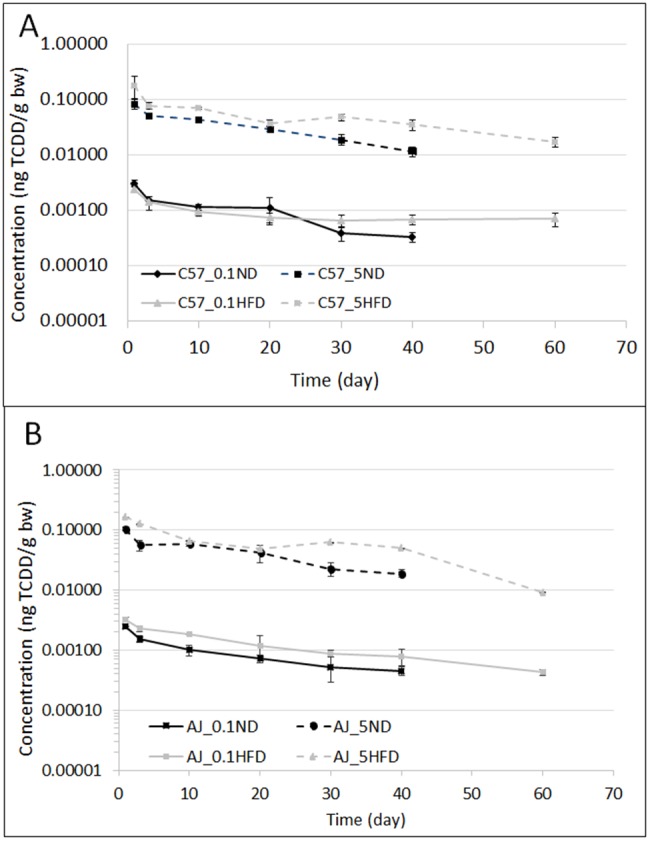
The blood profiles of TCDD in mice expressed in terms of ng of TCDD/g bw with time (in days): (A) represents C57BL/6J mice that received doses of 0.1 or 5.0 µg/kg bw; (B) represents the A/J mice that received doses 0.1 or 5.0 µg/kg bw. Both graphs compared the ND with the HFD for each strain.
Table 1.
Classical Pharmacokinetic Analysis of the blood concentration (Figure 5A–B) for the Single Dose TCDD With Time
| Parameters | C57BL/6J mice |
A/J mice |
||||||
|---|---|---|---|---|---|---|---|---|
| ND | HFD | ND | HFD | |||||
| Exposure dose (µg TCDD/kg bw) | 0.1 | 5.0 | 0.1 | 5.0 | 0.1 | 5.0 | 0.1 | 5.0 |
| T½ (day) (ter. elimination) | 14.3 | 15.7 | 139 | 31.2 | 25.6 | 17.1 | 25.1 | 10.3 |
| AUC (ng*d/l) | 0.0375 | 1.2599 | 0.0487 | 2.7513 | 0.0341 | 1.6518 | 0.06767 | 3.3483 |
| Cmax (ng/l) | 0.0030 | 0.0840 | 0.0024 | 0.1793 | 0.0025 | 0.1046 | 0.0032 | 0.1641 |
| Tmax (day) | 1 | 1 | 1 | 1 | 1 | 1 | 1 | 1 |
Statistical comparisons between groups are presented in Table 2 with the level of statistical significance when it was possible.
Experimental partition coefficient
The PC represents the ratio of the tissue concentration divided by the blood measurements at steady state (Supplementary Figs. 5A and 5B). For the PBPK model, the experimental PC for adipose tissue, muscle (corresponding to the rest of the body in the PBPK model for TCDD), and liver was determined as the mean of the ratio of concentration in these tissues divided by the concentration in blood between 10 and 40 days postexposure. These ratios were relatively constant across time for muscle and adipose tissue at low and high doses, and for the liver at low doses. However, for the liver at the high dose, the ratio of the liver to blood concentrations varies over time because the TCDD level was influenced by both the PC and the reversible binding to inducible CYP1A2 (Supplementary Figs. 5A and 5B) and is designated as an “apparent PC.” For the simulations, the liver PC was set at 6, based on the PC parameter value in the original PBPK model (Emond et al., 2005; USEPA, 2012). The enhanced accumulation of TCDD in the liver is then described by the induction and binding to CYP1A2. The values for the adipose tissue and rest of the body in the original PBPK model are 100 and 1.5, respectively (Emond et al., 2005; USEPA, 2012).
Modeling Simulation
Use of classical pharmacokinetic analysis to evaluate the data
Classical pharmacokinetic analysis was performed with PK Solution’s noncompartmental software (version 2.0). Because there were significant differences in bw and tissue: blood ratios, we evaluated classical pharmacokinetic parameters based on TCDD blood concentrations. In both strains of mice, the half-life decreased with greater exposure (Table 1), although this only reached statistical significance with the A/J mice with (p = .01). In the C57BL/6J mice fed an ND, the half-life at the low dose was approximately double that of the high dose, but this was not statistically significant (p = .103).
The HFD increased the half-life in both dose levels of the C57BL/6J mice. At the high dose of TCDD, the half-life doubled in the animals fed the HFD compared with those on the ND. In C57BL/6J mice exposed to 0.1 μg/kg of TCDD, the half-life was increased by approximately 10-fold by the HFD (Table 1). In contrast, in the A/J mice, the half-life was not altered by the diet. Finally, a comparison between the C57BL/6JND and A/JND mice suggest a slightly slower elimination TCDD in the C57BL/6J mice at the 0.1 μg//kg dose (Table 2).
Table 2.
Statistical Comparison of Several Pairs of Curve Slopes Was Used to Determine the Half-life by Using Multiple Regression/Correlation Analysis
| Comparison | Probability |
|---|---|
| Comparison of diet with the C57BL/6J mice (intrastrain) | |
| C57ND (0.1 µg TCDD/kg bw) versus C57ND (5.0 µg TCDD/kg bw) | p < .49 |
| C57ND (0.1 µg TCDD/kg bw) versus C57HFD (0.1 µg TCDD/kg bw) | p < .001 |
| C57ND (5.0 µg TCDD/kg bw) versus C57HFD (5.0 µg TCDD/kg bw) | p < .19 |
| Comparison between C57BL/6J and A/J mice fed the same diet and same dose | |
| C57ND (0.1 µg TCDD/kg bw) versus AJND (0.1 µg TCDD/kg bw) | p = .28 |
| C57ND (5.0 µg TCDD/kg bw) versus AJND (5.0 µg TCDD/kg bw) | p = .46 |
| C57HFD (5.0 µg TCDD/kg bw) versus AJHFD (5.0 µg TCDD/kg bw) | p = .56 |
| Comparison of diet with the A/J mice (intrastrain) | |
| AJND (0.1 µg TCDD/kg bw) versus AJND (5.0 µg TCDD/kg bw) | p = .63 |
| AJND (0.1 µg TCDD/kg bw) versus AJHFD (0.1 µg TCDD/kg bw) | p = .46 |
| AJND (5.0 µg TCDD/kg bw) versus AJHFD (5.0 µg TCDD/kg bw) | p = .35 |
| AJHFD (0.1 µg TCDD/kg bw) versus AJHFD (5.0 µg TCDD/kg bw) | p = .57 |
In the C57HFD strain, the AUC was higher in mice consuming the HFD when compared with those eating the ND by 2.65-fold for the low dose and 1.74-fold for the high dose. For the A/J mice, the ratios are 1.6 for the low dose and 1.38 for the high dose (Table 1 and Figure 5). These observations showed that for both strains and doses, the AUC ratio was higher for the C57BL/6J mice than for the A/J group (Table 1). These observations suggest that the HFD slowed the elimination in both strains, although this was more pronounced in the C57 strain.
For the C57BL/6J mice, the Cmax values were similar for the same dose between the ND with 58.3 ng/kg bw ± 22.1 for 0.1 µg TCDD/kg bw and 3610 ng/kg bw ± 263 for 5.0 µg/kg bw and HFD groups with 65.3 ng/kg bw ± 13.2 for 0.1 µg TCDD/kg bw and 3096 ng/kg bw ± 653 for 5.0 µg/kg bw, which suggests that obesity does affect the oral absorption rate of TCDD. For the A/J mice, the Cmax value is 40% lower in the HFD group than for the ND group (Figure 5B). The Tmax values were similar for each group except for the AJND mice that received 5.0 µg TCDD/kg bw where the Tmax was 1 day.
Use of the PBPK model to simulate the experimental data
Several pharmacokinetic simulations were performed by using the PBPK model in mice that was developed in 2012 for the dioxin reassessment (USEPA, 2012). Briefly, this model includes 3 compartments (ie, liver, adipose tissue, and rest of the body), which are connected to the systemic circulation. This PBPK model contains a biological mode of action in which the induction of CYP1A2 leads to TCDD sequestration. Using this PBPK model, two approaches were used. The first approach uses the same parameters as in USEPA’s reassessment, except that the fraction of the adipose tissue is adjusted to the experimental observation. The second approach involves simulating the data by using the same parameters as in the USEPA’s reassessment, but the fraction of the adipose mass is from the experimental data and the mean concentration ratio of tissue to blood is used to calculate the PC. All comparisons between the experimental data and the simulation were characterized visually and compared numerically when it was required.
C57BL/6 diet effects
Normal Diet
We used the USEPA model without making any changes in the parameters to simulate the TCDD behavior in the C57ND mice, except we employed table functions for the growth of the adipose tissue fraction (Figs. 6A–D).
Figure 6.

Simulations of the C57BL/6J mice that were exposed to a single dose of TCDD. For this simulation, we used the same parameters as were utilized in the mouse PBPK model for the TCDD reassessment of 2012 (NCEA, 2012). Figures A and B represent the ND group, where (A) is dose of 0.1 µg TCDD/kg bw and (B) represents the dose of 5.0 µg TCDD/kg bw. Figures C and D represent the HFD group, where (C) is the dose of 0.1 µg TCDD/kg bw and (D) represents the dose of 5.0 µg TCDD/kg bw. Dash light grey lines represent the liver, full black lines are the fat, and full dark grey lines represent the blood.
The PBPK model correctly predicted the blood concentration for the low dose of 0.1 µg of TCDD/kg bw, but it underpredicted the high dose by a factor of 2.5 (Figs. 6A and 6B). For the adipose tissue, the simulations at low and high doses were reasonable; however, for the liver, the model overpredicted the data by a factor of 3 at the low dose (Figure 6A), with much better predictions at the higher dose (Figure 6B).
High-Fat Diet
The same approach was used for the mice that consumed the HFD. During this approach, the same parameters were used as in the USEPA dioxin reassessment, except the adipose fraction changed because it was much higher in the HFD mice than in the normal lean mice originally modeled (Figs. 6C–D). The prediction for the C57BL/6J mice was relatively accurate at a low dose (ie, 0.1 µg TCDD/kg bw) (Figure 6C), but after 30 days, the model began to underpredict the experimental data at both the low (0.1 µg TCDD/kg) and high dose (ie, 5.0 µg TCDD/kg bw) by a factor of 5 for the last time point (Figure 6D).
As previously mentioned, to improve the prediction in the current study, tissue PCs were estimated by using the tissue to blood concentration ratio from the experimental data (Supplementary Figs. 5A and 5B). However, for the liver compartment, the ratio of liver to blood concentrations vary over time due to the partitioning into the liver based on the lipid content and to the dose and time response for CYP1A2 induction. For example, the experimentally derived PC (concentration liver to concentration blood ratio) was 59 for 0.1 µg TCDD/kg bw and 255 for 5.0 µg TCDD/kg bw. These values are also called an apparent PC, based on the liver concentration, which increases with dose because of TCDD sequestration by CYP1A2. Cleary, this dose-dependent increase of TCDD in the liver is attributed in part to the lipids in hepatic tissue, but also to the induction of CYP1A2, which is mathematically accounted for in the model. To ensure that the CYP1A2 induction was not accounted for twice, we set the liver PC to 6, which is the value used in the original model (USEPA, 2012). At a low dose (ie, 0.1 µg TCDD/kg bw), the PBPK model predicted the liver and adipose tissue compartments relatively well, but the model underpredicted the experimental data points for blood (Figure 7A). At a high dose, the model provided a relatively good prediction for the liver, with a factor of approximately ≅2; however, the model underpredicted adipose tissue and blood by a factor of 10 (Figure 7B). The change of the PC slightly increases the prediction for the liver at a high dose, but results in an underprediction for adipose tissue (Figs. 7A and 7B). These results suggest that other parameters seem to influence the decrease in TCDD elimination.
Figure 7.

Simulations of the C57HFD mice exposed to a single dose of 0.1 or 5.0 µg TCDD/kg bw. A, The simulation at 0.1 µg TCDD/kg bw. B, The simulation after the exposure of 5.0 µg TCDD/kg bw. Dash light grey lines represent the liver, full black lines are the fat, and full dark grey lines represent the blood. For these simulations, we utilized the variation of bw observed during the experiment and determined the PC during the experiment.
A/J mice
A/J Normal Diet
The same parameters of the PBPK model that were optimized for the TCDD reassessment of USEPA (2012) were used to simulate the A/J mice, which were exposed to 0.1 or 5.0 µg TCDD/kg bw (Figs. 8A and 8B). The simulation showed relatively good predictions for adipose tissue, liver, and blood at a low dose, but underpredicted for blood at the high dose (Figure 8B). However, the prediction is adequate for adipose tissue and liver as it differs from the data by a factor of approximately 1.2.
Figure 8.

Simulations of the A/J mice exposed to a single dose of TCDD. For this simulation, we used the same parameters as were utilized in the mouse PBPK model for the dioxin reassessment (NCEA, 2012). Graphs A and B represent the ND group, where (A) is dose of 0.1 µg TCDD/kg bw and (B) represents the dose of 5.0 µg TCDD/kg bw. Figures C and D represent the HFD group, where (C) is the dose of 0.1 µg TCDD/kg bw and (D) represents the dose of 5.0 µg TCDD/kg bw. Light grey lines represent the liver, black lines are the fat, and dark grey lines represent the blood.
A/J High-Fat
This A/J mice that were administered an HFD did not become obese. Thus, the consequence of a minimal change in the adipose tissue, results in a minimal impact of diet on elimination. At a low dose of 0.1 µg TCDD/kg bw, the simulation of the A/J mice showed an accurate prediction for adipose tissue and liver. However, for blood, the prediction was approximately an order of magnitude lower than was observed at the last time point of 60 days (Figure 8C). At the high dose of 5.0 µg TCDD/kg bw, a good prediction for both adipose tissue and liver was observed (Figure 8D). However, the predicted blood concentrations were underestimated by approximately an order of magnitude. For these simulations (Figs. 8C and 8D), we used the same parameters as were utilized in the original model in 2012 (USEPA, 2012).
Again, to analyze the effects of the PC, we have used the experimental data calculated from the tissue to blood concentration from day 10 to day 40, and then used the mean of the PC of all ratios. When the experimental PC was used, a slight underprediction was observed for adipose tissue and liver. For the blood, the PBPK model underpredicted the data by an order of magnitude.
Attempts to identify better fits to the data by varying other parameters in the model, particularly those related to CYP1A2, were investigated. However, variations in other parameters such as induction of CYP1A2, association and dissociation of TCDD binding to CYP1A2, or the interaction TCDD with the Ah receptor occupancy, did not result in better fits to the data and did not help to explain why there was the observed reduction in elimination. The only parameter that can reduce the elimination was the Kelv, an interspecies constant controlling the elimination between species. However, attempts to optimize the model output by changes in Kelv were unsuccessful at obtaining better fits to the data (Supplementary Figure 6).
DISCUSSION
The objectives of this current study were to examine the effects of obesity on the pharmacokinetics of TCDD in two strains of inbred mice. C57HFD mice became obese, but the A/J HFD mice did not (Glastras et al., 2016; Surwit et al., 1988). There was a 40% increase in bw among the C57HFD mice compared with the C57ND following 13 weeks on the diet. In addition, post-TCDD exposure, the C57HFD mice gained approximately 30% more bw compared with ≅ 10% for the AJHFD, ≅ 5% for the AJND, and ≅ 4% for the C57ND groups (Figs. 1A and 1B).
We used classical pharmacokinetic analysis to compare the 4 groups receiving 2 different concentrations of TCDD. The results from this analysis indicate that for both strains and diets, there was a dose dependent increase in the elimination of TCDD that is consistent with the induction of TCDD metabolism as has been previously reported (Diliberto et al., 1999). The half-life of TCDD was also influenced by the diet. In the C57BL/6J mice, the half-life is increased by approximately 2-fold at the high dose from 15.7 days in the C57ND to approximately 31.2 days in the C57HFD. At the low dose, the half-life for the C57HFD mice was increased by approximately 10-fold and was calculated at 139 days. The influence of the diet on the TCDD half-life in the A/J mice was minimal. The longer half-life in the C57HFD mice can be explained, in part, by a larger adipose tissue fraction (Emond et al., 2006), resulting in slower elimination of TCDD.
It is recognized in the literature that obesity will change drug disposition (Blouin et al., 1987; Ritschel and Kaul, 1986; Wang and Li, 2017). In the present study, we saw an approximately 40% decrease in CYP1A2 concentrations in the liver in both the C57HFD and AJHFD mice compared with their ND fed controls. This is consistent with a recent study describing decreased CYP1A2 mRNA expression in mice fed an HFD (Ning and Jeong, 2017). This data appear to contrast with human studies which indicate that the half-life of drugs metabolized by CYP1A2 is decreased in humans (Abernethy et al., 1985; Caraco et al., 1995; Kamimori et al., 1987). To better understand how the pharmacokinetic behavior of TCDD is influenced by conditions such as obesity, we simulated the data using a PBPK from all groups of mice either consuming the ND or HFD and at a low or high concentration of TCDD. We performed simulations to optimize biologically relevant parameters such as PC, fat fraction of the adipose tissue, tissue blood flow, permeability diffusion disrupted by the overload of lipids in the organs, and/or disruption of the CYP1A2 induction parameters. For both strains that were fed an ND, the prediction of liver and fat is reasonable compared with the experimental data points, except for blood (Figs. 6A and 6B and 8A and 8B). Although, blood was underestimated by the model, the prediction is still within a factor of 2–3.
The PBPK model predicted relatively well the 0.1 and 5.0 µg TCDD/kg bw dose in the C57HFD mice at the early time points, but the fits worsen at the later time points for liver, fat, and blood (Figs. 6C and 6D). The incorporation of the experimentally derived PC did not contribute to a better prediction (Figs. 7A and 7B). Even though we tried varying multiple combinations of parameters, we were unable to provide better fits to the data in the HFD group. This inability to identify the parameters responsible suggest that the PBPK model misses a key feature of the biology of TCDD pharmacokinetics in obese mice.
We compared the elimination profile of AJHFD mice with C57HFD. The A/J mice strain did not develop obesity when they were fed an HFD. The results clearly show that the elimination of TCDD by both mouse strains fed an ND followed a similar pattern in terms of time (Figs. 6A and 6B for the C57BL/6J mice; Figs. 8A and 8B for the A/J mice). Exposure to an HFD had less of an influence on the A/J mice than on the C57BL/6J mice. In addition to obesity, C57Bl/6 mouse also develop a metabolic syndrome similar to type II diabetes (Black et al., 1998). The difference in the effects of the high fat diet on the pharmacokinetics of TCDD between the A/J and the C57BL/6J might be due to the difference in the increase in body fat between the two strains as well as a metabolic dysregulation not identified with the PBPK model.
Overall, feeding the C57BL/6J mice an HFD drastically increased the bw of this strain compared with the A/J mice. This increase in bw among the C57BL/6J mice not only raised the fat fraction, but also contributed to a change in the lipid composition in other compartments such as the liver, which subsequently resulted in an increase in the PC. This increase in lipids in organs such as the liver likely contributes to slowing the elimination of TCDD (Lee et al., 2011). Although the model incorporated the changes in body fat and PC, there must also be changes due to obesity and metabolic syndrome. In addition to the size of the fat compartment, changes in tissue PC, and CYP1A2 expression that impacts the elimination of TCDD in obese animals that are not accounted for the model.
CONCLUSION
We conclude that the impact of an HFD on the pharmacokinetics of TCDD is partially due to the increase in the fat fraction, but not to the increase in the PC, suggesting that other mechanisms must be contributing to the reduced elimination of TCDD in mice fed an HFD which develop obesity. Although decreases in CYP1A2 may also play a role, our analysis using the PBPK model could not fully explain the differences in the half-life of TCDD in the obese animals when the changes in adipose size and CYP1A2 expression were incorporated. More research on the impact of an HFD on the elimination of environmental chemicals is needed to determine how common this phenomenon may be across chemical classes. In addition, the impact of diet on the pharmacokinetics of xenobiotics, especially for obese populations, who now represent a large percentage of the population, requires a better understanding.
SUPPLEMENTARY DATA
Supplementary data are available at Toxicological Sciences online.
Supplementary Material
ACKNOWLEDGMENTS
This manuscript does not represent the policies of the U.S. EPA. The authors want to thank G.G. Ross and V. Richardson for their technical assistance. All the co-authors also declare that there are no conflicts of interest in the publication.
FUNDING
Funded in part by an Interagency Agreement with the U.S. Air Force (#FQ7624-00-YA085), a Cooperative Agreement (CR 828790) with the National Research Council, and the National Institute of Health under research contract HHSN261201500081P and HHSN261201600366P.
REFERENCES
- Abernethy D. R., Greenblatt D. J., Divoll M., Smith R. B., Shader R. I. (1984). The influence of obesity on the pharmacokinetics of oral alprazolam and triazolam. Clin. Pharmacokinet. 9, 177–183. [DOI] [PubMed] [Google Scholar]
- Abernethy D. R., Todd E. L., Schwartz J. B. (1985). Caffeine disposition in obesity. Br. J. Clin. Pharmacol. 20, 61–66. [DOI] [PMC free article] [PubMed] [Google Scholar]
- Abraham K., Wiesmüller T., Brunner H., Krowke R., Hagenmaier H., Neubert D. (1989). Elimination of various polychlorinated dibenzo-p-dioxins and dibenzofurans (PCDDs and PCDFs) in rat faeces. Arch. Toxicol. 63, 75–78. [DOI] [PubMed] [Google Scholar]
- Andersen M. E. (2003). Toxicokinetic modeling and its applications in chemical risk assessment. Toxicol. Lett. 138, 9–27. [DOI] [PubMed] [Google Scholar]
- Bardova K., Horakova O., Janovska P., Hansikova J., Kus V., van Schothorst E. M., Hoevenaars F. P. M., Uil M., Hensler M., Keijer J. et al. , . (2016). Early differences in metabolic flexibility between obesity-resistant and obesity-prone mice. Biochimie 124, 163–170. [DOI] [PubMed] [Google Scholar]
- Birnbaum L. S. 1998. Developmental effects of dioxins In Korach K.S. (Ed.), Reproductive and Developmental Toxicology. Marcel Dekker, New York, pp. 87–112. [Google Scholar]
- Birnbaum L. S., Tuomisto J. (2000). Non-carcinogenic effects of TCDD in animals. Food Addit. Contam. 17, 275–288. [DOI] [PubMed] [Google Scholar]
- Black B. L., Croom J., Eisen E. J., Petro A. E., Edwards C. L., Surwit R. S. (1998). Differential effects of fat and sucrose on body composition in A/J and C57BL/6 mice. Metabolism 47, 1354–1359. [DOI] [PubMed] [Google Scholar]
- Blouin R. A., Kolpek J. H., Mann H. J. (1987). Influence of obesity on drug disposition. Clin. Pharm. 6, 706–714. [PubMed] [Google Scholar]
- Brill M. J., Diepstraten J., van Rongen A., van Kralingen S., van den Anker J. N., Knibbe C. A. (2012). Impact of obesity on drug metabolism and elimination in adults and children. Clin. Pharmacokinet. 51, 277–304. [DOI] [PubMed] [Google Scholar]
- Caraco Y., Zylber-Katz E., Berry E. M., Levy M. (1995). Caffeine pharmacokinetics in obesity and following significant weight reduction. Int. J. Obes. Relat. Metab. Disord. 19, 234–239. [PubMed] [Google Scholar]
- Chang J. W., Chen H. L., Su H. J., Lee C. C. (2016). Abdominal obesity and insulin resistance in people exposed to moderate-to-high levels of dioxin. PLoS One 11, e0145818.. [DOI] [PMC free article] [PubMed] [Google Scholar]
- Chevalier N., Fenichel P. (2016). Endocrine disruptors: A missing link in the pandemy of type 2 diabetes and obesity? Presse Med. 45, 88–97. [DOI] [PubMed] [Google Scholar]
- Devito M. J., Beebe L. E., Menache M., Birnbaum L. S. (1996). Relationship between CYP1A enzyme activities and protein levels in rats treated with 2, 3, 7, 8-tetrachlorodibenzo-p-dioxin. J. Toxicol. Environ. Health 47, 379–394. [DOI] [PubMed] [Google Scholar]
- Devito M. J., Birnbaum L. S.. 1994. Toxicology of dioxins and related chemicals In Schecter A. (Ed.), Dioxin and Health. Plenum Press, New York, pp. 139–162. [Google Scholar]
- Devito M. J., Birnbaum L. S., Farland W. H., Gasiewicz T. A. (1995). Comparisons of estimated human body burdens of dioxin like chemicals and TCDD body burdens in experimentally exposed animals. Environ. Health Perspect. 103, 820–831. [DOI] [PMC free article] [PubMed] [Google Scholar]
- Devito M. J., Maier W. E., Diliberto J. J., Birnbaum L. S. (1993). Comparative ability of various PCBs, PCDFs, and TCDD to induce cytochrome P450 1A1 and 1A2 activity following 4 weeks of treatment. Fundam. Appl. Toxicol. 20, 125–130. [PubMed] [Google Scholar]
- Diliberto J. J., Akubue P. I., Luebke R. W., Birnbaum L. S. (1995). Dose-response relationships of tissue distribution and induction of Cyp1A1 and Cyp1A2 enzymatic activities following acute exposure to 2,3,7,8-tetrachlorodibenzo-p-dioxin (TCDD) in mice. Toxicol. Appl. Pharmacol. 130, 197–208. [DOI] [PubMed] [Google Scholar]
- Diliberto J. J., Burgin D. E., Birnbaum L. S. (1999). Effects of CYP1A2 on disposition of 2,3,7,8-tetrachlorodibenzo-p-dioxin, 2,3,4,7,8-pentachlorodibenzofuran, and 2,2′,4,4′,5,5′-hexachlorobiphenyl in CYP1A2 knockout and parental (C57BL/6N and 129/Sv) strains of mice. Toxicol. Appl. Pharmacol. 159, 52–64. [DOI] [PubMed] [Google Scholar]
- Diliberto J. J., Devito M. J., Ross D. G., Birnbaum L. S. (2001). Subchronic exposure of [3H]-2,3,7,8-tetrachlorodibenzo-p-dioxin (TCDD) in female B6C3F1 mice: relationship of steady-state levels to disposition and metabolism. Toxicol. Sci. 61, 241–255. [DOI] [PubMed] [Google Scholar]
- Emond C., Birnbaum L. S., Devito M. J. (2006). Use of a physiologically based pharmacokinetic model for rats to study the influence of body fat mass and induction of CYP1A2 on the pharmacokinetics of TCDD. Environ. Health Perspect. 114, 1394–1400. [DOI] [PMC free article] [PubMed] [Google Scholar]
- Emond C., Michalek J. E., Birnbaum L. S., Devito M. J. (2005). Comparison of the use of a physiologically based pharmacokinetic model and a classical pharmacokinetic model for dioxin exposure assessments. Environ. Health Perspect. 113, 1666–1668. [DOI] [PMC free article] [PubMed] [Google Scholar]
- Flechner S. M., Kolbeinsson M. E., Tam J., Lum B. (1989). The impact of body weight on cyclosporine pharmacokinetics in renal transplant recipients. Transplantation 47, 806–810. [DOI] [PubMed] [Google Scholar]
- Gallou-Kabani C., Vige A., Gross M. S., Rabes J. P., Boileau C., Larue-Achagiotis C., Tome D., Jais J. P., Junien C. (2007). C57BL/6J and A/J mice fed a high-fat diet delineate components of metabolic syndrome. Obesity (Silver Spring) 15, 1996–2005. [DOI] [PubMed] [Google Scholar]
- Glastras S. J., Chen H., Teh R., McGrath R. T., Chen J., Pollock C. A., Wong M. G., Saad S. (2016). Mouse models of diabetes, obesity and related kidney disease. PLoS One 11, e0162131.. [DOI] [PMC free article] [PubMed] [Google Scholar]
- Jaeger C., Xu C., Sun M., Krager S., Tischkau S. A. (2017). Aryl hydrocarbon receptor-deficient mice are protected from high fat diet-induced changes in metabolic rhythms. Chronobiol. Int. 34, 318–336. [DOI] [PMC free article] [PubMed] [Google Scholar]
- Kamimori G. H., Somani S. M., Knowlton R. G., Perkins R. M. (1987). The effects of obesity and exercise on the pharmacokinetics of caffeine in lean and obese volunteers. Eur. J. Clin. Pharmacol. 31, 595–600. [DOI] [PubMed] [Google Scholar]
- Kedderis L. B., Diliberto J. J., Linko P., Goldstein J. A., Birnbaum L. S. (1991). Disposition of 2,3,7,8-tetrabromodibenzo-p-dioxin and 2,3,7,8,-tetrachlorodibenzo-p-dioxin in the rat: biliary excretion and induction of cytochlrome CYP1A1 and CYP1A2. Toxicol. Appl. Pharmacol. 111, 163–172. [DOI] [PubMed] [Google Scholar]
- Kerger B. D., Leung H. W., Scott P., Paustenbach D. J., Needham L. L., Patterson D. G. Jr., Gerthoux P. M., Mocarelli P. (2006). Age- and concentration-dependent elimination half-life of 2,3,7,8-tetrachlorodibenzo-p-dioxin in Seveso children. Environ. Health Perspect. 114, 1596–1602. [DOI] [PMC free article] [PubMed] [Google Scholar]
- Kharasch E. D., Thummel K. E., Mautz D., Bosse S. (1994). Clinical enflurane metabolism by cytochrome P450 2E1. Clin. Pharmacol. Ther. 55, 434–440. [DOI] [PubMed] [Google Scholar]
- Kreuzer P. E., Csanady G. A., Baur C., Kessler W., Papke O., Greim H., Filser J. G. (1997). 2,3,7,8-Tetrachlorodibenzo-p-dioxin (TCDD) and congeners in infants. A toxicokinetic model of human lifetime body burden by TCDD with special emphasis on its uptake by nutrition. Arch. Toxicol. 71, 383–400. [DOI] [PubMed] [Google Scholar]
- La Merrill M., Emond C., Kim M. J., Antignac J. P., Le B. B., Clement K., Birnbaum L. S., Barouki R. (2013). Toxicological function of adipose tissue: focus on persistent organic pollutants. Environ. Health Perspect. 121, 162–169. [DOI] [PMC free article] [PubMed] [Google Scholar]
- Lee Y. S., Li P., Huh J. Y., Hwang I. J., Lu M., Kim J. I., Ham M., Talukdar S., Chen A., Lu W. J. et al. , . (2011). Inflammation is necessary for long-term but not short-term high-fat diet-induced insulin resistance. Diabetes 60, 2474–2483. [DOI] [PMC free article] [PubMed] [Google Scholar]
- Michalek J. E., Ketchum N. S., Tripathi R. C. (2003). Diabetes mellitus and 2,3,7,8-tetrachlorodibenzo-p-dioxin elimination in veterans of Operation Ranch Hand. J. Toxicol. Environ. Health A 66, 211–221. [DOI] [PubMed] [Google Scholar]
- Michalek J. E., Tripathi R. C. (1999). Pharmacokinetics of TCDD in veterans of Operation Ranch Hand: 15-year follow-up. J. Toxicol. Environ. Health A 57, 369–378. [DOI] [PubMed] [Google Scholar]
- Miller M. S., Gandolfi A. J., Vaughan R. W., Bentley J. B. (1980). Disposition of enflurane in obese patients. J. Pharmacol. Exp. Ther. 215, 292–296. [PubMed] [Google Scholar]
- Ning M., Jeong H. (2017). High-fat diet feeding alters expression of hepatic drug-metabolizing enzymes in mice. Drug Metab. Dispos. 45, 707–711. [DOI] [PMC free article] [PubMed] [Google Scholar]
- Olson J. R. (1986). Metabolism and disposition of 2,3,7,8-tetrachlorodibenzo-p-dioxin in guinea pigs. Toxicol. Appl. Pharmacol. 85, 263–273. [DOI] [PubMed] [Google Scholar]
- Ritschel W. A., Kaul S. (1986). Prediction of apparent volume of distribution in obesity. Methods Find. Exp. Clin. Pharmacol. 8, 239–247. [PubMed] [Google Scholar]
- Ruiz P., Perlina A., Mumtaz M., Fowler B. A. (2016). A systems biology approach reveals converging molecular mechanisms that link different POPs to common metabolic diseases. Environ. Health Perspect. 124, 1034–1041. [DOI] [PMC free article] [PubMed] [Google Scholar]
- Sinasac D. S., Riordan J. D., Spiezio S. H., Yandell B. S., Croniger C. M., Nadeau J. H. (2016). Genetic control of obesity, glucose homeostasis, dyslipidemia and fatty liver in a mouse model of diet-induced metabolic syndrome. Int. J. Obes. (Lond.) 40, 346–355. [DOI] [PubMed] [Google Scholar]
- Surwit R. S., Kuhn C. M., Cochrane C., McCubbin J. A., Feinglos M. N. (1988). Diet-induced type II diabetes in C57BL/6J mice. Diabetes 37, 1163–1167. [DOI] [PubMed] [Google Scholar]
- Tuomisto J., Airaksinen R., Kiviranta H., Tukiainen E., Pekkanen J., Tuomisto J. T. (2016). A pharmacokinetic analysis and dietary information are necessary to confirm or reject the hypothesis on persistent organic pollutants causing type 2 diabetes. Toxicol. Lett. 261, 41–48. [DOI] [PubMed] [Google Scholar]
- USEPA (2012). EPA's reanalysis of key issues related to dioxin toxicity and response to NAS comments, Volume 1, Chapter 3 (EPA/600/R-10/038F).
- Van Miller J. P., Marlar R. J., Allen J. R. (1976). Tissue distribution and excretion of tritiated tetrachlorodibenzo-p-doxin in non-human primates and rats. Food Cosmet.Toxicol. 14, 31–34. [DOI] [PubMed] [Google Scholar]
- Wang C., Xu C. X., Krager S. L., Bottum K. M., Liao D. F., Tischkau S. A. (2011). Aryl hydrocarbon receptor deficiency enhances insulin sensitivity and reduces PPAR-alpha pathway activity in mice. Environ. Health Perspect. 119, 1739–1744. [DOI] [PMC free article] [PubMed] [Google Scholar]
- Wang R., Li X. N. (2017). Different adipose tissue depots and metabolic syndrome in human. Sheng Li Xue Bao 69, 357–365. [PubMed] [Google Scholar]
- White S. S., Birnbaum L. S. (2009). An overview of the effects of dioxins and dioxin-like compounds on vertebrates, as documented in human and ecological epidemiology. J. Environ. Sci. Health C Environ. Carcinog. Ecotoxicol. Rev. 27, 197–211. [DOI] [PMC free article] [PubMed] [Google Scholar]
- Yee G. C., Lennon T. P., Gmur D. J., Cheney C. L., Oeser D., Deeg H. J. (1988). Effect of obesity on cyclosporine disposition. Transplantation 45, 649–651. [DOI] [PubMed] [Google Scholar]
Associated Data
This section collects any data citations, data availability statements, or supplementary materials included in this article.