


Abstract
RNA-seq is a sensitive and accurate technique to compare steady-state levels of RNA between different cellular states. However, as it does not provide an account of transcriptional activity per se, other technologies are needed to more precisely determine acute transcriptional responses. Here, we have developed an easy, sensitive and accurate novel computational method, iRNA-seq, for genome-wide assessment of transcriptional activity based on analysis of intron coverage from total RNA-seq data. Comparison of the results derived from iRNA-seq analyses with parallel results derived using current methods for genome-wide determination of transcriptional activity, i.e. global run-on (GRO)-seq and RNA polymerase II (RNAPII) ChIP-seq, demonstrate that iRNA-seq provides similar results in terms of number of regulated genes and their fold change. However, unlike the current methods that are all very labor-intensive and demanding in terms of sample material and technologies, iRNA-seq is cheap and easy and requires very little sample material. In conclusion, iRNA-seq offers an attractive novel alternative to current methods for determination of changes in transcriptional activity at a genome-wide level.
INTRODUCTION
Recently, RNA-seq has become the method of choice for assessing global changes of the transcriptome. This method provides several advantages over microarray analyses including higher reproducibility and greater dynamic range (1–7), reviewed in (8). The ease of performing RNA-seq has made it a standard technology to accompany almost any analysis of the genome. For example, it is used to correlate changes in the epigenome or binding of transcription factors to changes in the transcriptome. Here, changes in the transcriptome, as determined by RNA-seq, are used as a proxy for changes in transcriptional activity. Although this approximation works reasonably well, it is clearly far from perfect, since the amount of transcripts are also regulated at other levels than transcription. In addition, acute changes in transcriptional activity will be partially masked by existing mRNA transcripts. Thus, the transcriptome approximation is particularly problematic when addressing acute effects, and techniques that more directly assess transcriptional activity are required for such studies.
Over the past few years, multiple techniques have been developed to determine changes in transcription at a genome-wide level. These include RNA polymerase II (RNAPII) chromatin immunoprecipitation (ChIP)-seq (9,10), global run-on (GRO)-seq (11,12), 4-thiouridine (4sU)-RNA-seq (13) and bromouridine (Bru)-seq (14). These techniques, each have their strengths and weaknesses; however, all are significantly more laborious techniques and require much larger numbers of cells compared to RNA-seq. For example, RNAPII ChIP-seq involves DNA-protein cross-linking by formaldehyde and sonication of chromatin before immunoprecipitation and purification of RNAPII-associated DNA. GRO-seq requires isolation of nuclei, an in vitro transcription reaction, and subsequent pull down of labeled RNA, whereas techniques, such as 4sU-RNA-seq and Bru-seq, rely on metabolic labeling of cells prior to harvest and isolation of newly synthesized RNA. Thus, the applicability of these techniques for experiments with a restricted number of cells is limited, as is the potential for high-throughput experiments.
Here, we have developed a computational method, iRNA-seq (intron RNA-seq), for easy genome-wide determination of transcriptional activity based on total RNA-seq data sets. The method has been implemented in a Perl pipeline that quantifies differences in intron reads. We have used iRNA-seq to analyze our own unpublished data on the acute transcriptional response of human adipocytes to tumor necrosis factor (TNF) treatment, as well as data derived from the literature. We demonstrate that this new method is a sensitive, fast and easy way of simultaneously determining transcriptional activity and levels of mature transcripts at a genome-wide level from total RNA-seq data.
MATERIALS AND METHODS
Cell culture
Human SGBS cells were obtained from Dr. Martin Wabitsch, University of Ulm, Germany. Cells were passaged and differentiated to adipocytes as previously described (15).
RNA-seq
Following Isol® extraction and column purification of total RNA, ribosomal RNAs were removed using the Ribo-Zero® Human/Mouse/Rat kit (Epicentre). Library preparation was performed using TruSeq RNA Sample Preparation protocol according to the manufacturer's (Illumina) instructions.
cDNA synthesis and quantitative real-time polymerase chain reaction (qPCR)
cDNA synthesis and real-time qPCR were performed as previously described (16). Sequences of primers used for real-time PCR are available upon request.
ChIP-seq
ChIP experiments were performed according to standard protocol as described in (17). The RNAPII antibody used was from Diagenode (C15200004). Library preparation was performed as described in (18).
Additional data
Total RNA-seq data from TNF stimulation of human A549 cells (19) were downloaded from NCBI Sequence Read Archive (accession SRP020499). Total RNA-seq, GRO-seq and RNAPII ChIP-seq data from TNF stimulation of human IMR90 fibroblasts (20), 4sU-RNA-seq data from LPS stimulation of mouse dendritic cells (13), were downloaded from GEO data set browser (accession GSE43070 and GSE25432, respectively).
Data processing
All RNA-seq reads were mapped to their respective reference genomes with STAR (21) using default parameters. ChIP-seq and GRO-seq data were mapped to their respective reference genomes with STAR specifying –alignIntronMax 1 to avoid potentially aligning across exon–exon junctions.
Definition of unique intron, exon and gene regions
All RefSeq genes, exons and introns were extracted from the UCSC Genome Browser (22), and the gene lists were collapsed to the longest transcript for each gene. For each gene, regions overlapping another coding or non-coding gene were removed, so that only regions unique to a specific RefSeq gene were used for quantification. Lists of unique exon and intron regions were generated in a similar manner. Furthermore, for the intron list, all overlaps with genomic locations associated with mRNA sequences were subtracted. These regions were extracted from the UCSC Genome Browser (22), which uses all mRNA sequences submitted to the Genbank to create a list of genomic regions of origin of mRNA. For quantification of GRO-seq and RNAPII ChIP-seq, promoter proximal regions, i.e. regions from −1000 bp to +500 relative to transcription start sites were excluded to avoid quantification of stalled polymerase.
iRNA-seq pipeline
For read quantification and differential expression analysis, a Perl pipeline iRNA-seq was created that takes aligned RNA/GRO/ChIP-seq reads in either SAM or BAM format as input and uses featureCount (23) to quantify reads in all regions defined as unique introns, exons or genes. For each gene the sum of read counts in unique intron regions were used for quantification of primary transcripts (transcription), whereas unique read counts in exons were used for quantification of mature transcripts. iRNA-seq can then either analyze these summarized counts for differential expression by standard or blocked two-condition comparison using edgeR (24) or provide summarized non-normalized read counts for other purposes. iRNA-seq comes with gene, exon and intron lists for the human (hg19), mouse (mm9) and rat (rn5) genomes, as well as a script to generate custom list for other genome versions or organisms. The pipeline and instructions on how to use it is available at: http://www.sdu.dk/mandrupgroup.
Data access
The RNA-seq and RNAPII ChIP-seq data sets generated in this study have been submitted to the NCBI Gene Expression Omnibus (GEO; http://www.ncbi.nlm.nih.gov/geo/) under accession number GSE60462.
RESULTS
Building the iRNA-seq pipeline
Recent studies have demonstrated that information about nascent transcripts, co-transcriptional splicing and mRNA dynamics can be extracted from total RNA-seq data by analyzing intron reads (25,26). We therefore investigated if analysis of intron reads from total RNA-seq data, can be used for genome-wide assessment of acute transcriptional regulation of gene expression. For this purpose, we analyzed total RNA-seq and RNAPII ChIP-seq data obtained from in vitro differentiated human SGBS adipocytes treated with TNF or vehicle for 90 min. Inspection of the data in the UCSC genome browser indicated that at several loci, acute gene regulation could be detected at the level of intron reads as well as RNAPII occupancy, despite no apparent effect on transcript levels as determined by reads in exons (Figure 1A and B).
Figure 1.

Effect of acute TNF treatment on transcription in human SGBS adipocytes as assessed by RNA-seq and RNAPII ChIP-seq. Following 10 days in vitro differentiation, human SGBS adipocytes were treated with vehicle or TNF for 90 min before harvest of RNA for total RNA-seq and chromatin for RNAPII ChIP-seq. The screenshot from the UCSC genome browser illustrates intron/exon coverage and association with RNAPII at (A) the CTSZ locus; and (B) the ADH1B locus. Fold changes between vehicle and TNF samples are indicated to the right of the tracks.
To investigate this at a genome-wide level, we designed a Perl pipeline, iRNA-seq, which for every gene quantifies and sums intron reads not overlapping with any other transcripts or non-coding RNA. Intron reads are counted and summed using featureCounts (23), and differential expression analysis is performed using edgeR (24) (Figure 2A). To minimize problems arising from inclusion of exon reads due to differential exon usage (Figure 2B, arrow A) and incomplete annotation (Figure 2B, arrow B), all regions associated with mRNA were subtracted from the regions subjected to counting (see Materials and Methods). In addition to the default quantification of intron reads, the iRNA-seq tool also allows quantification of reads in exons or reads in full-length genes. Thus, the iRNA-seq tool allows fast and easy parallel assessment of mature transcript levels as well as active transcription from one total RNA-seq experiment.
Figure 2.
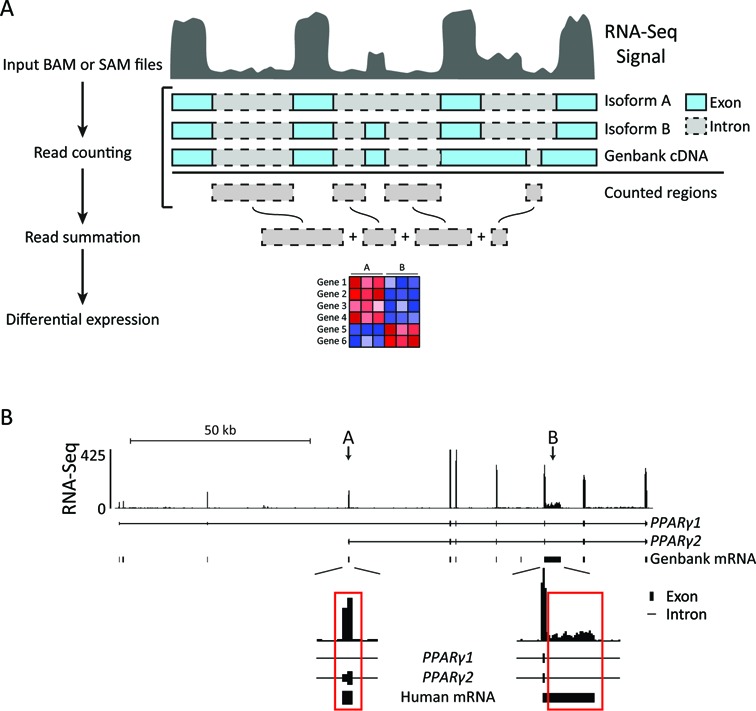
Outline of the iRNA-seq pipeline. (A) iRNA-seq takes SAM/BAM input files and counts reads within intron regions of the longest isoform for each gene. All regions associated with Genbank mRNAs are subtracted from the regions to be counted and the remaining intron reads are summarized for each transcript. edgeR is then used to perform differential expression analysis. (B) Screenshot from the UCSC genome browser illustrating how differential exon usage (arrow A) and incomplete annotation (arrow B) result exon reads contributing to coverage in introns of PPARG1. In the iRNA-seq pipeline, such regions are excluded using the Genbank mRNA track.
Evaluation of iRNA-seq
Application of the iRNA-seq pipeline for analysis of total RNA-seq data obtained from SGBS adipocytes stimulated with TNF or vehicle for 90 min, shows that significantly more genes are scored as differentially expressed by quantification of reads in introns as compared to reads in exons (Figure 3A–C). As would be expected, the difference is more pronounced for genes repressed by TNF than for genes activated by TNF, since reductions in transcription are partially masked by pre-existing mature mRNA (Figure 3C). This should be particularly true for transcripts with long half-lives, and to investigate this we obtained mRNA half-lives determined by an ActinomycinD-chase in human foreskin fibroblasts performed by the Wilusz laboratory (27). Indeed, genes that are detected as regulated by iRNA-seq have longer mRNA half-lives on average than genes that are differentially expressed at the exon level (Figure 3D). To confirm the differential regulation of genes that are detected by iRNA-seq, we performed qPCR of 3 induced and 4 repressed genes none of which could be detected as differentially expressed by quantification of exon reads. In all cases, qPCR using primers targeting introns revealed changes in expression that were not detected using primers targeting exons (Figure 3E). Importantly, fold change in transcription as determined by iRNA-seq correlates well with fold change as determined by RNAPII ChIP-seq (Figure 3F), whereas the correlation is weak between exon reads and RNAPII ChIP-seq data (Figure 3G).
Figure 3.
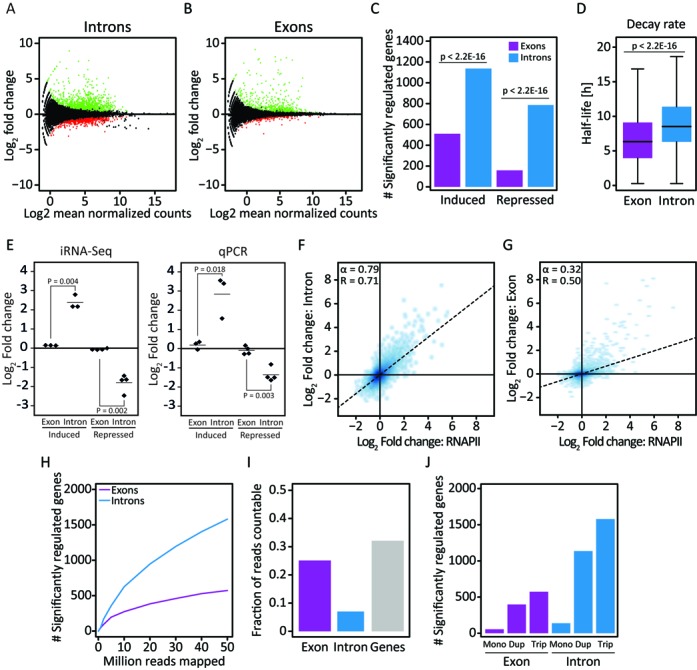
Use of iRNA-seq for determination of acute transcriptional changes in response to TNF. Following 10 days in vitro differentiation, human SGBS adipocytes were treated with vehicle or TNF for 90 min before harvest of RNA for total RNA-seq and chromatin for RNAPII ChIP-seq. (A and B) MA-Plots illustrating fold changes (log2) and mean expression values (log2 normalized mean tag count) for exon (A) or intron (B) reads within RefSeq gene bodies in control versus TNF-stimulated SGBS adipocytes. Green and red dots represent genes that were determined to be up- and down-regulated, respectively, using edgeR (FDR < 0.01). (C) Bar diagram illustrating the number of genes identified to be significantly induced or repressed in intron and exon mode. A Fisher exact test was used to investigate dependency between the number of significant genes and the analysis method. (D) Boxplots illustrating mRNA half-lives of genes identified as differentially expressed using exon versus intron reads. mRNA half-lives were obtained from (27). The significance of the difference between medians was tested using a Wilcoxon signed-rank test. (E) Strip chart comparing the TNF-induced change in expression of a subset of regulated genes (CFH, CTSZ, LYRM4, ADH1B, TMEM170B, VSTM4 and MARC1) in human SGBS adipocytes at exon and intron level using iRNA-seq and qPCR. (F and G) Correlation between changes in RNAPII occupancy and fold changes determined by iRNA-seq in intron (F) or exon (G) mode. To avoid noise from lowly expressed genes, independent filtering on average expression was used to remove the least expressed 30% of genes for each method before the pairwise comparisons. (H) Graph illustrating dependency on sequencing depth of iRNA-seq performance in intron and exon mode in terms of number of differentially expressed genes (FDR ≤ 0.01) detected. (I) Bar diagram illustrating the fraction of countable reads mapping to unique genes, exons or introns. (J) Bar diagram illustrating how iRNA-seq performance using intron reads (blue) and exon reads (purple) depends on biological replicates. Each total RNA-seq sample was subsampled to 50 million reads, and the number of differentially regulated genes (FDR ≤ 0.01) using monoplicates, duplicates and triplicates were determined. For the 3 monoplicates and the 3 possible combinations of duplicates, the median numbers of differentially regulated genes were plotted.
To investigate the correlation between sequencing depth and iRNA-seq performance, we ran iRNA-seq on different subsamples of the RNA-seq data (Figure 3H). The dependency on sequencing depth is higher for iRNA-seq compared to quantification of exon reads due to the lower number of reads in introns (Figure 3I). Importantly, however, the number of significantly regulated genes detected by iRNA-seq is higher for all sequencing depths. Whereas biological duplicates markedly improved the performance of iRNA-seq, triplicates only modestly improved detection of significantly regulated genes in this system (Figure 3J). The same tendency was observed when analyzing exon coverage.
Time-course analysis with iRNA-seq
To investigate the relationship between treatment time and the benefit of iRNA-seq over regular RNA-seq, we downloaded data from a time-course experiment from the Brasier laboratory in which human A549 cells had been treated with TNF for different time points up to 6 h (19). These data were then processed through the iRNA-seq pipeline using either intron or exon reads. Similarly to what was observed for the SGBS adipocyte data, we identified markedly more differentially expressed genes using intron reads as compared to exon reads following 30 and 60 min TNF treatment; however, this difference levels off after 3 h (Figure 4A). Consistently, fold changes at the intron and exon levels correlate weakly at the 30- and 60-min time points, whereas there is a strong correlation at the 3- and 6-h time point (Figure 4B). Interestingly, acute transcriptional changes (30/60 min intron) show the strongest correlation with exon levels at the 3-h time point, whereas it weakens a little at the 6-h time point, possibly due to the effect of secondary transcriptional events at mRNA levels at later time points. In general, there is strong correlation between changes in primary transcript at a given time point with mature mRNA levels 2–3 h later, indicating that most transcriptional changes are translated into changes in mRNA levels within 2 h.
Figure 4.
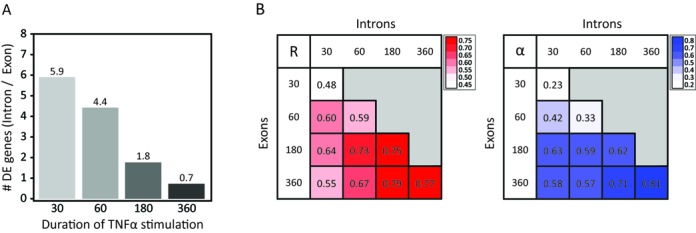
Comparison of exon and intron reads in time-course studies. Total RNA-seq data from a time-course study (0, 30, 60, 180 and 360 min) of the transcriptional response to TNF in human A549 cells (19), were downloaded from GEO and each time point was analyzed against time point 0 using the iRNA-seq pipeline in intron and exon mode. (A) Bar diagram illustrating the ratio of the number of differentially expressed genes detected in intron versus exon mode at each time point. A Fisher exact test was used to determine that the number of significant genes for all time points were dependent on the analysis method. (B) Heatmaps illustrating the Pearson's correlation coefficient (left) and the slope of the linear regression through (0.0) (right) for fold changes determined by analysis of exon and intron reads for each time point. To avoid noise from lowly expressed genes, independent filtering on average expression was used to remove the 30% least expressed genes before the correlation analysis.
iRNA-seq performance is comparable to GRO-seq and RNAPII ChIP-seq
To test the iRNA-seq method in a different model system and to directly compare it with other approaches for analyzing acute transcriptional regulation, we downloaded total RNA-seq data from an experiment from the Ren laboratory, in which IMR90 fibroblasts had been treated with TNF or vehicle for 60 min (20). These data were processed through the iRNA-seq pipeline in intron and exon mode, and parallel GRO-seq and RNAPII ChIP-seq data were processed in the gene mode, with exclusion of promoter proximal regions in order to avoid quantifying stalled RNA polymerase. Consistent with the results obtained for SGBS adipocytes (Figure 3F and G), fold change determined by iRNA-seq correlates strongly with changes in RNAPII occupancy and change in GRO-seq signal (Figure 5A). By contrast, quantification of exons correlates weakly with RNAPII ChIP-seq and GRO-seq data. To directly compare the ability of these methods to detect changes in transcription, we determined the number of differentially transcribed genes using different subsamples of each data set (Figure 5B). At low sequencing depths GRO-seq and RNAPII ChIP-seq detect more differentially transcribed genes than iRNA-seq; however, the performance of iRNA-seq increases dramatically with sequencing depth. Above 30–40 mill reads, i.e. in the range recommended by ENCODE for RNA-seq (https://genome.ucsc.edu/ENCODE/protocols/dataStandards/RNA_standards_v1_2011_May.pdf), the performance of iRNA-seq is comparable to that of RNAPII ChIP-seq and GRO-seq, although GRO-seq remains the most sensitive method. In contrast, quantification by RNAPII ChIP-seq benefits less from increasing the sequencing depth above 10 mill reads, which is most likely due to lower signal-to-noise ratio of the RNAPII ChIP-seq method compared to the other methods.
Figure 5.
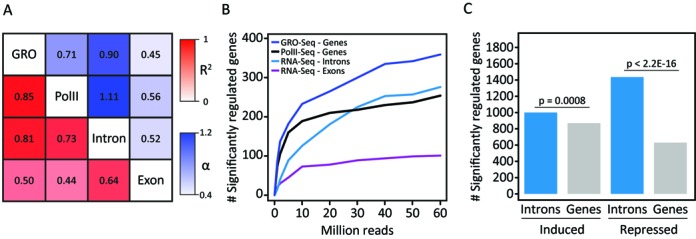
Comparison of iRNA-seq with other methods. (A and B) GRO-seq, RNAPII ChIP-seq and RNA-seq data from a 60-min TNF stimulation of human IMR90 lung fibroblasts (20), were downloaded from GEO (GSE43070), and RNA-seq raw data were analyzed using iRNA-seq. (A) Heatmap illustrating the Pearson's correlation coefficient (red) and the slope of the linear regression through (0.0) (blue) for fold changes determined by GRO-seq, RNAPII ChIP-seq and iRNA-seq in intron and exon mode. To avoid noise from lowly expressed genes, independent filtering on average expression across experimental conditions was used to remove the least expressed 30% of genes for each method. Furthermore, only genes with fold changes >2 or <0.5 in the GRO-seq experiment were considered. (B) Graph illustrating dependency on sequencing depth for GRO-seq, RNAPII-ChIP-seq and iRNA-seq performance in terms of number of differentially expressed genes (FDR ≤ 0.05) detected. (C) 4sU-RNA-seq data from a 60-min LPS stimulation of mouse dendritic cells (13), were downloaded from GEO (GSE25432) and analyzed using iRNA-seq. Bar diagrams illustrate the number of differentially (FDR ≤ 0.05) induced and repressed genes identified based on reads in introns or whole gene bodies. A Fisher exact test was used to investigate dependency between the number of significantly regulated genes and the analysis method.
We were unable to directly compare iRNA-seq with labeling-based techniques, such as 4sU-seq or Bru-seq, since we could not identify any parallel data sets. However, we downloaded 4sU-RNA-seq data from an experiment by the Regev laboratory, where mouse dendritic cells had been treated with LPS for 1 h (13). When these data were analyzed using the iRNA-seq pipeline, we identified significantly more regulated genes when restricting the analysis to only use the introns compared to using the full-length genes (Figure 5C), demonstrating that detection of regulated genes by 4sU-RNA-seq can be significantly improved by disregarding exon information in the iRNA-seq pipeline. This is particularly true for repressed genes, which may be due to the rather long labeling time used in this experiment (45 min (13)), resulting in inclusion of processed, stable transcripts, that were synthesized early in the labeling period. Thus, the levels of labeled transcripts do not reflect the transcriptional activities at the time of harvest but rather reflects the average transcriptional activity over the labeling period.
Taken together, these analyses demonstrate that with a sequencing depth in the range where total RNA-seq is usually performed there are sufficient reads in introns to quantify transcriptional activity with high sensitivity and accuracy using the iRNA-seq pipeline. Direct comparison with current more labor-intensive methods for assessment of transcription demonstrates that iRNA-seq can provide very similar output.
DISCUSSION
In this study we have developed a new pipeline, iRNA-seq, which counts and sums reads from total RNA-seq data mapping to uniquely annotated intron regions. We demonstrate that this is an accurate and sensitive method for genome-wide quantification of acute transcriptional changes from total RNA-seq data.
We used the iRNA-seq pipeline to analyze our own total RNA-seq data from TNF-treated adipocytes as well as to reanalyze data from the literature. These analyses clearly showed that while changes in mRNA levels may be an acceptable proxy for transcriptional changes over several hours, it is a poor approximation for detection of acute transcriptional changes (minutes to few hours). We demonstrate that such acute transcriptional changes are much more efficiently detected by iRNA-seq. Interestingly, however, we noted that there was a reasonable strong correlation between reads in introns at a given time point and reads in exons 2–3 h later. This is well in line with recent findings by the Lazar laboratory comparing transcriptional changes by GRO-seq with microarray data following exposure of 3T3-L1 adipocytes to rosiglitazone for different time periods (28).
Comparison of iRNA-seq with more labor-intensive methods, such as GRO-seq and RNAPII ChIP-seq, shows that iRNA-seq estimates similar fold changes in transcription and has similar sensitivity as these methods. Due to the low number of reads in introns, the sensitivity of iRNA-seq is more dependent on sequencing depth than the two other methods; however, this limitation is overcome at sequencing depths of 30–40 million reads, which is within the range of what is typically used and recommended by ENCODE for total RNA-seq experiments. Limitations of the iRNA-seq method include the risk of classifying exon or other types of non-intron reads as intron due to alternative splicing events, etc. not included in current genome annotations. The extent of this is hard to measure; however, given the comparable performance to RNAPII-ChIP-seq and GRO-seq, such cases must be rare. For correctly annotated genes, the iRNA-seq readout may even, in some cases, be more correct than that of the two other methods, the reason being that these techniques, in addition to elongating polymerase, measure engaged, paused polymerase at promoters and enhancers (29). Thus, changes in occupancy of paused polymerase at intron enhancers may be falsely quantified as changes in gene transcription. Another potential limitation of the iRNA-seq method is the fact that intron read density is influenced by processing rates in addition to pre-mRNA synthesis rate. However, recent investigations indicated that variation in processing rates is minor compared to synthesis, leaving intron read densities as an acceptable proxy for rate of transcription (26). Importantly, this is also reflected by the strong correlation between fold changes determined by iRNA-seq and those determined by RNAPII ChIP-seq and GRO-seq. Finally, iRNA-seq is not able to assess transcription for genes with no introns or few short introns. However, despite these limitations, we believe that for most purposes the benefits of this approach greatly outweigh the drawbacks.
The iRNA-seq method provides many technical advantages over other methods for the analysis of acute transcriptional changes (Figure 6). First, the amount of material required for total RNA-seq is much smaller than any of the current technologies for assessment of transcription (12,28,30,31,32,33). iRNA-seq therefore makes it possible to study acute transcriptional regulation in rare cell populations. In theory, since RNA-seq on single cells is becoming a standard protocol, it should also be possible to study transcriptional activity at a single-cell level using the iRNA-seq method (30). Second, the total RNA-seq procedure is much less laborious than the other methods and can be performed with standard technologies. In fact, the RNA-seq procedure is already fully automatized on multiple platforms (http://www.illumina.com/applications/sequencing/ngs-library-prep/automation.ilmn). While some automatized ChIP-seq solutions are also available, several steps in the ChIP-seq procedure (cross-linking, sonication, etc.) have to be optimized for each model system used. Third, the iRNA-seq methodology allows simultaneous assessment of primary transcript levels and mature mRNA levels from the same total RNA-seq experiment. This could be especially useful in time-course experiments, e.g. by allowing the dissection of the temporal relationship between active transcription and accumulations of mature mRNA levels in response to a given stimuli. Finally, iRNA-seq can be used to extract novel information about transcriptional activity from the large number of total RNA-seq data sets deposited at various databases.
Figure 6.
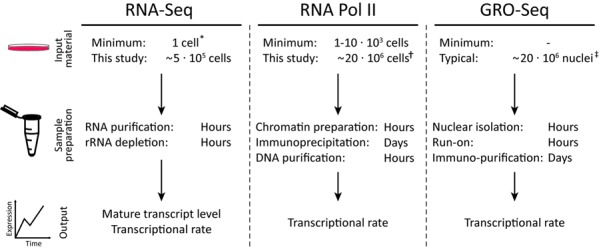
Methods overview. Outline of iRNA-seq, GRO-seq and RNAPII ChIP-seq methodologies illustrates the advantages of the iRNA-seq method. In addition to the low amount of input material required, advantages of the iRNA-seq method include a fast and easy protocol and parallel information about mature transcript levels. * (30), † (31–33), ‡ (12,28).
In conclusion, we have developed a new method, iRNA-seq, for easy, sensitive and accurate genome-wide assessment of transcriptional activity. Despite minor limitations, this method offers several advantages over current methods in terms of time and material spent. The method will be of particular interest to researchers interested in determining acute changes in transcription, and researchers working with limited sample material, e.g. rare cell populations or even single-cell RNA-seq.
Acknowledgments
We thank members of the Mandrup laboratory, in particular, Rasmus Siersbæk, for helpful comments and discussions. Furthermore, we thank Per Sauerberg (Novo Nordisk A/S), for the kind gift of rosiglitazone and Martin Wabitsch (University of Ulm, Germany) for providing SGBS cells.
Footnotes
The authors wish it to be known that, in their opinion, the first 2 authors should be regarded as joint First Authors
FUNDING
Danish Council for Independent Research|Health and Disease; Novo Nordisk Foundation; European Foundation for the Study of Diabetes; The VILLUM Foundation to the VILLUM Center for Bioanalytical Sciences at University of Southern Denmark. Funding for open access charge: Danish Council for Independent Research|Health and Disease.
Conflict of interest statement. None declared.
REFERENCES
- 1.Mortazavi A., Williams B.A., McCue K., Schaeffer L., Wold B. Mapping and quantifying mammalian transcriptomes by RNA-Seq. Nat. Methods. 2008;5:621–628. doi: 10.1038/nmeth.1226. [DOI] [PubMed] [Google Scholar]
- 2.Wilhelm B.T., Marguerat S., Watt S., Schubert F., Wood V., Goodhead I., Penkett C.J., Rogers J., Bahler J. Dynamic repertoire of a eukaryotic transcriptome surveyed at single-nucleotide resolution. Nature. 2008;453:1239–1243. doi: 10.1038/nature07002. [DOI] [PubMed] [Google Scholar]
- 3.Nagalakshmi U., Wang Z., Waern K., Shou C., Raha D., Gerstein M., Snyder M. The transcriptional landscape of the yeast genome defined by RNA sequencing. Science. 2008;320:1344–1349. doi: 10.1126/science.1158441. [DOI] [PMC free article] [PubMed] [Google Scholar]
- 4.Lister R., O'Malley R.C., Tonti-Filippini J., Gregory B.D., Berry C.C., Millar A.H., Ecker J.R. Highly integrated single-base resolution maps of the epigenome in Arabidopsis. Cell. 2008;133:523–536. doi: 10.1016/j.cell.2008.03.029. [DOI] [PMC free article] [PubMed] [Google Scholar]
- 5.Cloonan N., Forrest A.R., Kolle G., Gardiner B.B., Faulkner G.J., Brown M.K., Taylor D.F., Steptoe A.L., Wani S., Bethel G., et al. Stem cell transcriptome profiling via massive-scale mRNA sequencing. Nat. Methods. 2008;5:613–619. doi: 10.1038/nmeth.1223. [DOI] [PubMed] [Google Scholar]
- 6.Marioni J.C., Mason C.E., Mane S.M., Stephens M., Gilad Y. RNA-seq: an assessment of technical reproducibility and comparison with gene expression arrays. Genome Res. 2008;18:1509–1517. doi: 10.1101/gr.079558.108. [DOI] [PMC free article] [PubMed] [Google Scholar]
- 7.Morin R., Bainbridge M., Fejes A., Hirst M., Krzywinski M., Pugh T., McDonald H., Varhol R., Jones S., Marra M. Profiling the HeLa S3 transcriptome using randomly primed cDNA and massively parallel short-read sequencing. BioTechniques. 2008;45:81–94. doi: 10.2144/000112900. [DOI] [PubMed] [Google Scholar]
- 8.Wang Z., Gerstein M., Snyder M. RNA-Seq: a revolutionary tool for transcriptomics. Nat. Rev. Genet. 2009;10:57–63. doi: 10.1038/nrg2484. [DOI] [PMC free article] [PubMed] [Google Scholar]
- 9.Nielsen R., Pedersen T.A., Hagenbeek D., Moulos P., Siersbaek R., Megens E., Denissov S., Borgesen M., Francoijs K.J., Mandrup S., et al. Genome-wide profiling of PPARgamma:RXR and RNA polymerase II occupancy reveals temporal activation of distinct metabolic pathways and changes in RXR dimer composition during adipogenesis. Genes Dev. 2008;22:2953–2967. doi: 10.1101/gad.501108. [DOI] [PMC free article] [PubMed] [Google Scholar]
- 10.Mokry M., Hatzis P., Schuijers J., Lansu N., Ruzius F.P., Clevers H., Cuppen E. Integrated genome-wide analysis of transcription factor occupancy, RNA polymerase II binding and steady-state RNA levels identify differentially regulated functional gene classes. Nucleic Acids Res. 2012;40:148–158. doi: 10.1093/nar/gkr720. [DOI] [PMC free article] [PubMed] [Google Scholar]
- 11.Core L.J., Waterfall J.J., Lis J.T. Nascent RNA sequencing reveals widespread pausing and divergent initiation at human promoters. Science. 2008;322:1845–1848. doi: 10.1126/science.1162228. [DOI] [PMC free article] [PubMed] [Google Scholar]
- 12.Hah N., Danko C.G., Core L., Waterfall J.J., Siepel A., Lis J.T., Kraus W.L. A rapid, extensive, and transient transcriptional response to estrogen signaling in breast cancer cells. Cell. 2011;145:622–634. doi: 10.1016/j.cell.2011.03.042. [DOI] [PMC free article] [PubMed] [Google Scholar]
- 13.Rabani M., Levin J.Z., Fan L., Adiconis X., Raychowdhury R., Garber M., Gnirke A., Nusbaum C., Hacohen N., Friedman N., et al. Metabolic labeling of RNA uncovers principles of RNA production and degradation dynamics in mammalian cells. Nat. Biotechnol. 2011;29:436–442. doi: 10.1038/nbt.1861. [DOI] [PMC free article] [PubMed] [Google Scholar]
- 14.Paulsen M.T., Veloso A., Prasad J., Bedi K., Ljungman E.A., Tsan Y.C., Chang C.W., Tarrier B., Washburn J.G., Lyons R., et al. Coordinated regulation of synthesis and stability of RNA during the acute TNF-induced proinflammatory response. Proc. Natl. Acad. Sci. U.S.A. 2013;110:2240–2245. doi: 10.1073/pnas.1219192110. [DOI] [PMC free article] [PubMed] [Google Scholar]
- 15.Schmidt S.F., Jorgensen M., Chen Y., Nielsen R., Sandelin A., Mandrup S. Cross species comparison of C/EBPalpha and PPARgamma profiles in mouse and human adipocytes reveals interdependent retention of binding sites. BMC Genom. 2011;12:152. doi: 10.1186/1471-2164-12-152. [DOI] [PMC free article] [PubMed] [Google Scholar]
- 16.Boergesen M., Poulsen L.C., Schmidt S.F., Frigerio F., Maechler P., Mandrup S. ChREBP mediates glucose repression of peroxisome proliferator-activated receptor alpha expression in pancreatic beta-cells. J. Biol. Chem. 2011;286:13214–13225. doi: 10.1074/jbc.M110.215467. [DOI] [PMC free article] [PubMed] [Google Scholar]
- 17.Siersbaek M.S., Loft A., Aagaard M.M., Nielsen R., Schmidt S.F., Petrovic N., Nedergaard J., Mandrup S. Genome-wide profiling of peroxisome proliferator-activated receptor gamma in primary epididymal, inguinal, and brown adipocytes reveals depot-selective binding correlated with gene expression. Mol. Cell. Biol. 2012;32:3452–3463. doi: 10.1128/MCB.00526-12. [DOI] [PMC free article] [PubMed] [Google Scholar]
- 18.Nielsen R., Mandrup S. Genome-wide profiling of transcription factor binding and epigenetic marks in adipocytes by ChIP-seq. Methods Enzymol. 2014;537:261–279. doi: 10.1016/B978-0-12-411619-1.00014-8. [DOI] [PubMed] [Google Scholar]
- 19.Yang J., Mitra A., Dojer N., Fu S., Rowicka M., Brasier A.R. A probabilistic approach to learn chromatin architecture and accurate inference of the NF-kappaB/RelA regulatory network using ChIP-Seq. Nucleic Acids Res. 2013;41:7240–7259. doi: 10.1093/nar/gkt493. [DOI] [PMC free article] [PubMed] [Google Scholar]
- 20.Jin F., Li Y., Dixon J.R., Selvaraj S., Ye Z., Lee A.Y., Yen C.A., Schmitt A.D., Espinoza C.A., Ren B. A high-resolution map of the three-dimensional chromatin interactome in human cells. Nature. 2013;503:290–294. doi: 10.1038/nature12644. [DOI] [PMC free article] [PubMed] [Google Scholar]
- 21.Dobin A., Davis C.A., Schlesinger F., Drenkow J., Zaleski C., Jha S., Batut P., Chaisson M., Gingeras T.R. STAR: ultrafast universal RNA-seq aligner. Bioinformatics. 2013;29:15–21. doi: 10.1093/bioinformatics/bts635. [DOI] [PMC free article] [PubMed] [Google Scholar]
- 22.Kent W.J., Sugnet C.W., Furey T.S., Roskin K.M., Pringle T.H., Zahler A.M., Haussler D. The human genome browser at UCSC. Genome Res. 2002;12:996–1006. doi: 10.1101/gr.229102. [DOI] [PMC free article] [PubMed] [Google Scholar]
- 23.Liao Y., Smyth G.K., Shi W. featureCounts: an efficient general purpose program for assigning sequence reads to genomic features. Bioinformatics. 2014;30:923–930. doi: 10.1093/bioinformatics/btt656. [DOI] [PubMed] [Google Scholar]
- 24.Robinson M.D., McCarthy D.J., Smyth G.K. edgeR: a Bioconductor package for differential expression analysis of digital gene expression data. Bioinformatics. 2010;26:139–140. doi: 10.1093/bioinformatics/btp616. [DOI] [PMC free article] [PubMed] [Google Scholar]
- 25.Ameur A., Zaghlool A., Halvardson J., Wetterbom A., Gyllensten U., Cavelier L., Feuk L. Total RNA sequencing reveals nascent transcription and widespread co-transcriptional splicing in the human brain. Nat. Struct. Mol. Biol. 2011;18:1435–1440. doi: 10.1038/nsmb.2143. [DOI] [PubMed] [Google Scholar]
- 26.Gray J.M., Harmin D.A., Boswell S.A., Cloonan N., Mullen T.E., Ling J.J., Miller N., Kuersten S., Ma Y.C., McCarroll S.A., et al. SnapShot-Seq: a method for extracting genome-wide, in vivo mRNA dynamics from a single total RNA sample. PloS ONE. 2014;9:e89673. doi: 10.1371/journal.pone.0089673. [DOI] [PMC free article] [PubMed] [Google Scholar]
- 27.Neff A.T., Lee J.Y., Wilusz J., Tian B., Wilusz C.J. Global analysis reveals multiple pathways for unique regulation of mRNA decay in induced pluripotent stem cells. Genome Res. 2012;22:1457–1467. doi: 10.1101/gr.134312.111. [DOI] [PMC free article] [PubMed] [Google Scholar]
- 28.Step S.E., Lim H.W., Marinis J.M., Prokesch A., Steger D.J., You S.H., Won K.J., Lazar M.A. Anti-diabetic rosiglitazone remodels the adipocyte transcriptome by redistributing transcription to PPARgamma-driven enhancers. Genes Dev. 2014;28:1018–1028. doi: 10.1101/gad.237628.114. [DOI] [PMC free article] [PubMed] [Google Scholar]
- 29.Core L.J., Waterfall J.J., Gilchrist D.A., Fargo D.C., Kwak H., Adelman K., Lis J.T. Defining the status of RNA polymerase at promoters. Cell Rep. 2012;2:1025–1035. doi: 10.1016/j.celrep.2012.08.034. [DOI] [PMC free article] [PubMed] [Google Scholar]
- 30.Tang F., Barbacioru C., Wang Y., Nordman E., Lee C., Xu N., Wang X., Bodeau J., Tuch B.B., Siddiqui A., et al. mRNA-Seq whole-transcriptome analysis of a single cell. Nat. Methods. 2009;6:377–382. doi: 10.1038/nmeth.1315. [DOI] [PubMed] [Google Scholar]
- 31.Muratani M., Deng N., Ooi W.F., Lin S.J., Xing M., Xu C., Qamra A., Tay S.T., Malik S., Wu J., et al. Nanoscale chromatin profiling of gastric adenocarcinoma reveals cancer-associated cryptic promoters and somatically acquired regulatory elements. Nat. Commun. 5:4361. doi: 10.1038/ncomms5361. [DOI] [PubMed] [Google Scholar]
- 32.Adli M., Bernstein B.E. Whole-genome chromatin profiling from limited numbers of cells using nano-ChIP-seq. Nat. Protoc. 2011;6:1656–1668. doi: 10.1038/nprot.2011.402. [DOI] [PMC free article] [PubMed] [Google Scholar]
- 33.Shankaranarayanan P., Mendoza-Parra M.A., Walia M., Wang L., Li N., Trindade L.M., Gronemeyer H. Single-tube linear DNA amplification (LinDA) for robust ChIP-seq. Nat. Methods. 2011;8:565–567. doi: 10.1038/nmeth.1626. [DOI] [PubMed] [Google Scholar]