

Abstract
Background
Mammographic density (MD), the area of non-fatty appearing tissue divided by total breast area, is a strong breast cancer risk factor. Most MD analyses have employed visual categorizations or computer-assisted quantification, which ignore breast thickness. We explored MD volume and area, using a volumetric approach previously validated as predictive of breast cancer risk, in relation to risk factors among women undergoing breast biopsy.
Methods
Among 413 primarily white women, ages 40–65, undergoing diagnostic breast biopsies between 2007–2010 at an academic facility in Vermont, MD volume (cm3) was quantified in cranio-caudal views of the breast contralateral to the biopsy target using a density phantom, while MD area (cm2) was measured on the same digital mammograms using thresholding software. Risk factor associations with continuous MD measurements were evaluated using linear regression.
Results
Percent MD volume and area were correlated (r=0.81) and strongly and inversely associated with age, body mass index (BMI), and menopause. Both measures were inversely associated with smoking and positively associated with breast biopsy history. Absolute MD measures were correlated (r=0.46) and inversely related to age and menopause. Whereas absolute dense area was inversely associated with BMI, absolute dense volume was positively associated.
Conclusions
Volume and area MD measures exhibit some overlap in risk factor associations, but divergence as well, particularly for BMI.
Impact
Findings suggest that volume and area density measures differ in subsets of women; notably, among obese women, absolute density was higher with volumetric methods, suggesting that breast cancer risk assessments may vary for these techniques.
Introduction
Epidemiologic studies have consistently demonstrated that elevated mammographic density, a reflection of the fibroglandular tissue content of the breast, is a strong, independent breast cancer risk factor (1, 2). Mammographic density has typically been rated visually in broad categories [e.g., the Breast Imaging Reporting and Data System (BI-RADS) density classification (3)] or quantified as a percentage of the total breast area by computer-assisted thresholding software (4). These methods are reproducible in trained hands but are subjective and do not account for variation in breast thickness (4).
Methods for measuring mammographic density are rapidly evolving, and advanced methods permit measurement of density as a volume using digitized screen film mammograms (5–7) or full field digital mammography (FFDM) (8–11), where calibration data are more reliable and readily available. Applying volumetric density techniques to FFDM to account for breast thickness may further improve the reproducibility and accuracy of density measurements; however, comparisons of area and volume measures of mammographic density within women are limited.
Percent dense area (PD) is known to decrease with increasing age, body mass index (BMI), parity and menopause (12) and to increase with menopausal hormone therapy (MHT) use (13). Most prior reports have found similar relationships for these factors with percent fibroglandular volume (% FGV), and to a lesser extent, for absolute FGV (14–18). A notable exception is BMI, which has been reported to be inversely associated with absolute dense area (DA) but positively associated with absolute FGV in studies using volumetric density technologies based on digitized film screen images (14, 16, 18) and FFDM (17). Given that obesity is related to both breast cancer risk (19) and prognosis (20), understanding the etiological associations of BMI, density and breast cancer risk is important. In several studies, volumetric density measures have not improved breast cancer risk prediction models as compared with area-based measures (14, 15, 21, 22), with the notable exception of an investigation using a fully automated technique called Single X-ray Absorptiometry (SXA) (23). Clarifying determinants of SXA measures of volumetric density, especially with regard to the influence of BMI, may enhance its utility in risk assessment, which is important given the limitations of currently available models and the desirability of tailoring screening and prevention to individual levels of risk (24).
Accordingly, we prospectively collected FFDM with SXA density phantoms (10) and assessed volumetric and area density measures in a cross-sectional study of women referred for image-guided breast biopsy. Here, we aimed to explore the relation between volumetric and area measures of mammographic density with epidemiologic risk factors.
Materials and Methods
Study Population
The National Cancer Institute (NCI) Breast Radiology Evaluation and Study of Tissues (BREAST) Stamp Project is a cross-sectional molecular epidemiologic study of mammographic density undertaken at the University of Vermont College of Medicine and its affiliated academic hospital, Fletcher Allen Health Care (FAHC). FAHC is the largest radiologic facility in the Vermont Breast Cancer Surveillance System (VBCSS), which is part of the NCI’s Breast Cancer Surveillance Consortium (25). As part of this effort, patients were asked to complete a standard VBCSS health history questionnaire at the time of mammography.
The current investigation focused on patients who were referred for a diagnostic image-guided breast biopsy between October 2007 and June 2010. When a breast imaging study was indeterminate for cancer, indicating the need for a biopsy, patients were asked whether the study research coordinator could contact them. These potentially eligible participants were contacted by the research coordinator to determine eligibility, obtain verbal consent, and administer an approximately 20 minute telephone interview, collecting additional health information. Eligible women were 40–65 years of age, had not had breast cancer or received any cancer treatment, had not undergone breast surgery within one year, did not have breast implants, were not taking breast cancer chemoprevention and were scheduled to have an image-guided breast biopsy.
Height and weight were measured on the day of the breast biopsy, and patients were asked to provide written informed consent (in accordance with Institutional Review Boards at the University of Vermont and the NCI), which included providing access to existing medical records and mammographic images collected within the prior two years and for the next 10 years and to breast pathology specimens not needed for clinical care. Compensation of $50 was provided to participants who opted to donate blood and/or mouthwash samples.
During the study enrollment period, VBCSS registry data indicated that n=1,227 patients were eligible for the study, of whom n=673 (55%) were referred to the study by the radiology facility at the time of biopsy scheduling upon giving permission to be contacted by the study research coordinator. Of the 673 women referred for the study, 465 women (69%) agreed to participate, 90 (13%) refused, and 118 (18%) could not be contacted prior to breast biopsy. The phone interview was completed an average of two days prior to the scheduled biopsy. Information supplied by the radiology facility included the reason for the mammogram and its final assessment, in BI-RADS diagnostic categories: 3, “probably benign finding”; 4, “suspicious abnormality”; and 5, “highly suggestive of malignancy” (3). The radiologists tried, when possible, to perform biopsies immediately following the diagnostic evaluation for BI-RADS diagnostic category 5 cases; as there was less time available between assessment and biopsy, these patients were less likely to be enrolled. Compared with women who were eligible but not enrolled, study participants were less likely to have assessments highly suggestive of malignancy (BI-RADS diagnostic category 5: enrolled, 5.6%; not enrolled, 13.8%) and to be subsequently diagnosed with invasive breast carcinoma (invasive diagnosis: enrolled, 8.5%; not enrolled, 19.3%). Study participants were comparable to eligible patients who did not enroll with respect to race (% white: enrolled, 93%; not-enrolled: 90%, p=0.19) and age (mean (SD) age: enrolled, 50.8 (6.6); not enrolled, 50.9 (7.2), p=0.99).
Assessment of Breast Cancer Risk Factors and Covariates
Body mass index (BMI, kg/m2) was computed from measured height and weight for 456 (98%) women and from self-reported data for the remainder. The following factors were obtained from the VBCSS health history collected on the acquisition date of the image selected for mammographic density analysis: race/ethnicity, education, age at menarche, age at first live birth, presence of a lump at the time of mammography, and history of breast biopsy (see sample questionnaire at http://breastscreening.cancer.gov/ (26)). When possible, questionnaire data for missing factors that were unlikely to change over time were obtained from mammography visits within the two years prior to or after the mammogram date. The supplementary interview captured information related to parity, exogenous hormone use (duration of use of oral contraceptives and MHT), menopausal status, and smoking status. A combination of data collected from the VBCSS and the interview was used to assess family history of breast cancer in first-degree female relatives. A woman was considered postmenopausal if menstrual periods had permanently stopped more than 12 months prior to interview, she had undergone bilateral oophorectomy, or she had reported having undergone a hysterectomy (or gynecologic surgery associated with cessation of menses) and was 55 years of age or older; otherwise, a woman was considered premenopausal.
Assessment of Pathologic Diagnosis
To assign a final pathologic diagnosis, breast biopsy and surgical pathology reports were reviewed for all study participants. Diagnoses were classified as benign (i.e., normal lobules or ducts defined as sclerotic/atrophied; non-proliferative fibrocystic change; discrete entities), proliferative (i.e., ductal hyperplasia; sclerosing adenosis), proliferative with atypia (atypical ductal or lobular hyperplasia), in-situ, and invasive breast carcinoma. Information about biopsy type and laterality was obtained from breast biopsy reports.
Assessment of Mammographic Density
Mammograms were acquired on one of six FFDM systems at FAHC. For the initial three months of the study, mammograms were acquired on GE Senographe 2000D FFDM systems; the remaining (97%) images were obtained on Hologic Selenia FFDM systems. For storage, raw (“For Processing”) mammographic images were bi-dimensionally reduced by 50%, resulting in an image resolution of 140 μm × 140 μm averaged pixels. Images were encrypted and transferred to the University of California at San Francisco (UCSF) for quantitative volume and area density assessment. This analysis was restricted to pre-biopsy cranio-caudal views of the contralateral breast. If more than one mammogram was available, the mammogram taken closest in time within the year prior to the breast biopsy date was selected.
SXA was used to measure FGV (cm3) and % FGV as described previously (10). An SXA breast density phantom was affixed to the top of the compression paddle and included in the X-ray field during mammography examinations (Figure 1). The grayscale values for the pixels in the breast image were calibrated by comparing to the grayscale values in the SXA phantom with a known FGV composition and thickness (10). In this way, volumetric measures were achieved using a planar image. Previous estimates of reproducibility for the SXA test phantoms demonstrated a repeatability standard deviation of 2%, with a ±2% accuracy for the entire thickness and density ranges (10). To evaluate stability of SXA measures over time, initial calibration images were taken on each machine and serial scans of a quality control phantom were acquired; no systematic changes over time were observed.
Figure 1.
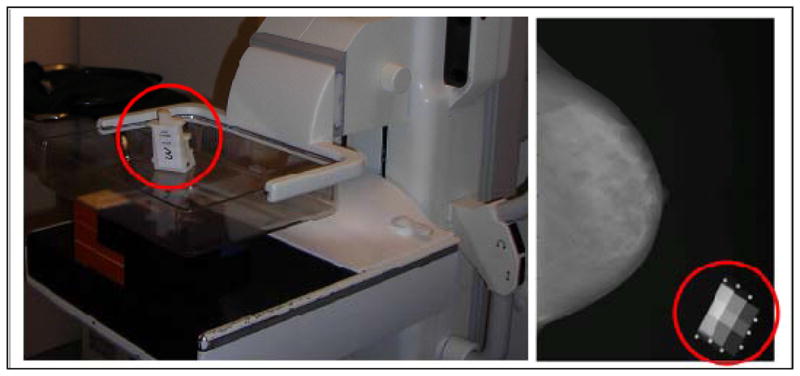
The Single X-ray Absorptiometry (SXA) volumetric density method
LEFT: The density phantom is affixed to the top compression paddle on a full-field digital mammography machine at the University of Vermont Fletcher Allen Health Care Medical Center;
RIGHT: The digital mammogram is acquired with the phantom in the corner of the image to allow for automated computation of volumetric mammographic density.
For the same FFDM images that were selected for SXA analyses, area measures of density were estimated as described previously (23, 27), using the UCSF Mammographic Density Program, which is interactive, computer-assisted thresholding software comparable to other validated methods (28). The software automatically detects and delineates the skin edge to define the total breast area (cm2). Any pectoralis muscle within the field of view was excluded manually. One trained experienced reader (BF) (23, 27), measured DA (cm2) by setting a pixel threshold for dense tissue on the images. PD was calculated by dividing DA by the total breast area and multiplying by 100. Distributions of density measures were examined and images with extreme values were reviewed visually for validation.
The American College of Radiology’s BI-RADS breast density assessment (reported on the same images used for quantitative analysis) was analyzed as: 1) almost entirely fat; 2) scattered fibroglandular densities; 3) heterogeneously dense; and 4) extremely dense (3).
Analytic Population
Of the 465 women who consented to the telephone interview, 12 were not subsequently biopsied, 13 were missing SXA density data, and nine women lacked pre-biopsy SXA results for the contralateral breast within one year of breast biopsy and were excluded. We also excluded 18 participants who underwent bilateral breast biopsies (preventing assessment of a contralateral breast), resulting in a final analytic population of n=413 women.
Statistical Analysis
Descriptive statistics for mammographic density measures were calculated, and Spearman’s rank correlation coefficients were estimated for quantitative volume versus area density measures. We examined correlations between volume and area density measures adjusted for and stratified by age (39–49, 50–54, 55+ years) and BMI (<25, 25-<30, 30+ kg/m2), which are known to be strongly associated with mammographic density. Based on a Box-Cox transformation analysis (29), we square-root transformed all quantitative, raw density measures to optimally approximate normal distributions. Mean quantitative density measures were compared across BI-RADS density categories using analysis of variance.
Linear regression models were used to examine age- and BMI-adjusted associations of participant characteristics with each density measure. Age at mammogram was coded as an ordered categorical variable (39–44, 45–49, 50–54, 55–59, 60–65 years) and BMI was coded in categories (<25, 25-<30, 30+ kg/m2). Additional adjustment for pathologic diagnosis and exclusion of 12 participants who were imaged on the GE machine had minimal effects (data not shown). We also used stepwise linear regression models without prior adjustment for age and BMI to identify associated factors. Both approaches yielded similar results; thus, only results from the age- and BMI-adjusted analyses are shown. Results from linear regression models in which β coefficients were standardized per standard deviation change in each density measure were also similar (Supplementary Table 1).
Because volume and area density measures are correlated, we sought to assess whether there is explanatory value in volumetric mammographic density after accounting for the covariate associations with area density by employing a residual regression approach. First, we fit linear regression models with PD as the outcome and included factors shown to be associated with mammographic density in the present analysis and in prior work (age: 39–44, 45–49, 50–54, 55–59, 60–65 years; education level: ≤high school, some college+; BMI: <25, 25-<30, 30+ kg/m2; age at menarche: ≤12, 13, ≥14 years; age at first live birth: <30, ≥30 years/nulliparous; age at menopause: premenopausal, ≤45, 46–49, 50–52, 53+ years, missing; MHT use: never, former, current, missing; cigarette smoking: never, ever; history of breast biopsy prior to enrollment: never, ever, missing; family history of breast cancer in a first degree female relative: no, yes; and pathologic diagnosis: benign, proliferative, proliferative with atypia, in-situ and invasive breast carcinoma), in order to minimize the effects of residual confounding. We then regressed the residuals from the linear model on % FGV and evaluated its association. Analyses were repeated for absolute DA and FGV. When more than 3% of the data were missing for a particular covariate, missing values for covariates were modeled as a separate category (i.e., age at menopause, MHT use, and history of breast biopsy).
Probability values of <0.05 were considered statistically significant. All tests of statistical significance were two-tailed. Analyses were performed using SAS software (SAS Institute Inc., Cary, NC).
Results
Participant Characteristics
The median (range) age of participants at enrollment was 51 (40–65) years and the median (range) BMI was 25.4 (17.4–51.3) kg/m2. Most participants were non-Hispanic white (92.7%), college graduates (84.6%), parous (76.2%), and premenopausal (60.5%). MHT use was infrequent (current 5.0%; former 19.3%). Most initial mammograms were screening examinations (79.9%), and most were subsequently categorized after work-up as suspicious abnormality (BI-RADS diagnostic category 4: 88.1%). The remainder were categorized as probably benign (BI-RADS diagnostic category 3: 6.3%) or highly suggestive of malignancy (BI-RADS diagnostic category 5: 5.6%). Half of participants underwent a stereotactic-guided breast biopsy, and 47.2% underwent an ultrasound-guided biopsy; 1.7% had both stereotactic and ultrasound-guided biopsies, 0.2% underwent an MRI-guided biopsy, and 0.5% had surgical excision without prior core biopsy. Laterality of breast biopsy was distributed evenly such that 49.2% of women had left breast biopsies and 50.8% had right biopsies. The distribution of pathologic diagnosis was as follows: benign (34.1%), proliferative (41.4%), proliferative with atypia (7.7%), in-situ (8.2%), and invasive breast cancer (8.5%).
Distributions of Mammographic Density Measures
The median (range) number of days between the contralateral mammogram selected for analysis and subsequent breast biopsy was 14 (1–294) days. Overall distributions and Spearman’s rank correlation coefficients for volume and area density measures are shown in Figure 2. The distributions of all density measures were positively skewed. Mean values were higher for % FGV (38.6%) versus PD (27.5%) measures, and % FGV ranged from 0–100% compared with a narrower range for PD of 0–86.5%. The correlation between % FGV and PD was moderately strong (r=0.81), reflecting the modest correlation between FGV and DA (r=0.46). Total breast volume and area were highly correlated (r=0.97). Age-adjustment did little to alter the correlations between volume and area density measures (Supplementary Table 2). Adjustment for BMI did not alter the correlation between total breast volume and area; however, BMI-adjustment attenuated the correlation between % FGV and PD (r=0.67) and a strengthened the correlation between FGV and DA (r=0.58) (Supplementary Table 2). Stratification by age and BMI revealed that correlations between % FGV and PD, and between FGV and DA, were strongest among the youngest and leanest women and progressively decreased with increasing age (Supplementary Figure 1) and BMI (Figure 3).
Figure 2.

Distributions and Spearman’s rank correlation coefficients (rs) for volume and area density measures, The BREAST Stamp Project, 2007–2010 (n=413)
Figure 3.

Spearman’s rank correlation coefficients (rs) for volume and area density measures, stratified by body mass index (BMI), The BREAST Stamp Project, 2007–2010 (n=413)
Mean quantitative density measures were compared across BI-RADS density categories and associations were in expected directions: with increasing BI-RADS breast density, volume and area measures of percent and absolute density increased, whereas measures of total breast volume and area decreased (p-value <0.0001 for all density measures, except FGV where p=0.08) (Table 1).
Table 1.
Quantitative density measurements by BI-RADS breast density categories, The BREAST Stamp Project, 2007–2010 (n=413)
| Variable | Abbreviation | BI-RADS density categories
|
||||||||
|---|---|---|---|---|---|---|---|---|---|---|
| I: entirely fat (n=56) | II: scattered densitites (n=183) | III: heterogeneously dense (n=131) | IV: extremely dense (n=33) | ANOVA p-value* | ||||||
|
| ||||||||||
| mean | SD | mean | SD | mean | SD | mean | SD | |||
| Volume measures: | ||||||||||
| Percent fibroglandular volume (%) | % FGV | 18.3 | 9.0 | 31.7 | 14.1 | 48.7 | 18.3 | 72.9 | 19.0 | <.0001 |
| Absolute fibroglandular volume (cm3) | FGV | 202.6 | 118.1 | 185.5 | 81.6 | 200.7 | 86.1 | 241.3 | 155.8 | 0.08 |
| Total breast volume (cm3) | 1,148.6 | 420.9 | 690.4 | 372.0 | 485.1 | 307.5 | 363.5 | 258.0 | <.0001 | |
| Area measures: | ||||||||||
| Percent dense area (%) | PD | 4.3 | 4.3 | 19.3 | 11.3 | 40.4 | 14.8 | 62.3 | 11.7 | <.0001 |
| Absolute dense area (cm2) | DA | 10.2 | 11.5 | 27.8 | 17.2 | 45.9 | 24.3 | 59.2 | 33.6 | <.0001 |
| Total breast area (cm2) | 239.0 | 76.0 | 156.2 | 63.2 | 118.9 | 56.4 | 95.7 | 48.9 | <.0001 | |
BI-RADS, Breast Imaging Reporting and Data System
Analysis of variance (ANOVA) tests were performed using square-root transformed mammographic density measures.
Associations between Mammographic Density Measures and Participant Characteristics
Both % FGV and PD were strongly and inversely associated with age, weight, BMI, and menopause (Table 2). Percent density according to both methods was reduced among non-White women and those who reported ever smoking and was elevated among those who reported a breast biopsy prior to study enrollment. The strong and positive association between percent density and BI-RADS breast density persisted after age- and BMI-adjustment.
Table 2.
Age- and BMI-adjusted linear regression results for the association between participant characteristics and volume and area mammographic density measures*, The BREAST Stamp Project, 2007–2010 (n=413)
| Characteristic | N | Percent mammographic density measures
|
Absolute mammographic density measures
|
||||||||||
|---|---|---|---|---|---|---|---|---|---|---|---|---|---|
| % FGV | PD | FGV (cm3) | DA (cm2) | ||||||||||
|
|
|
||||||||||||
| β | SE | p-value | β | SE | p-value | β | SE | p-value | β | SE | p-value | ||
| Age at mammogram (years) | |||||||||||||
| 39–45 | 81 | ref | ref | ref | ref | ||||||||
| 45–49 | 109 | −0.04 | 0.19 | 0.84 | 0.03 | 0.25 | 0.8977 | 0.21 | 0.50 | 0.68 | 0.14 | 0.31 | 0.64 |
| 50–54 | 102 | −0.36 | 0.19 | 0.06 | −0.14 | 0.25 | 0.5864 | −0.24 | 0.51 | 0.63 | 0.14 | 0.31 | 0.65 |
| 55–59 | 68 | −1.14 | 0.21 | <.0001 | −0.86 | 0.28 | 0.002 | −1.55 | 0.56 | 0.006 | −0.64 | 0.34 | 0.07 |
| 60–65 | 53 | −0.91 | 0.23 | <.0001 | −1.06 | 0.30 | 0.0005 | −0.66 | 0.61 | 0.28 | −0.76 | 0.37 | 0.04 |
| p-value for trend | <.0001 | <.0001 | 0.01 | 0.0065 | |||||||||
| Race | |||||||||||||
| White, non-Hispanic | 383 | ref | ref | ref | ref | ||||||||
| Other | 30 | 0.50 | 0.25 | 0.04 | 0.80 | 0.32 | 0.01 | −0.05 | 0.65 | 0.94 | 0.56 | 0.40 | 0.16 |
| Education level | |||||||||||||
| <High school or high school grad | 63 | ref | ref | ref | ref | ||||||||
| College/Graduate school degree | 347 | 0.19 | 0.18 | 0.28 | 0.44 | 0.23 | 0.06 | 0.56 | 0.47 | 0.23 | 0.56 | 0.28 | 0.048 |
| Height (inches)** | |||||||||||||
| 51–62 | 113 | ref | ref | ref | ref | ||||||||
| 63–65 | 168 | 0.04 | 0.20 | 0.85 | 0.20 | 0.25 | 0.41 | −0.87 | 0.43 | 0.04 | −0.04 | 0.26 | 0.88 |
| 66–72.5 | 132 | 0.11 | 0.22 | 0.62 | 0.43 | 0.26 | 0.10 | −0.79 | 0.45 | 0.08 | 0.09 | 0.27 | 0.74 |
| p-value for trend | 0.62 | 0.09 | 0.09 | 0.72 | |||||||||
| Weight (pounds)** | |||||||||||||
| 90–136 | 134 | ref | ref | ref | ref | ||||||||
| 137–166 | 141 | −1.10 | 0.16 | <.0001 | −1.07 | 0.21 | <.0001 | 1.25 | 0.42 | 0.003 | −0.17 | 0.25 | 0.496 |
| 167–338.5 | 138 | −2.61 | 0.16 | <.0001 | −2.62 | 0.21 | <.0001 | 1.62 | 0.42 | 0.0001 | −1.02 | 0.25 | <.0001 |
| p-value for trend | <.0001 | <.0001 | 0.0001 | <.0001 | |||||||||
| Body mass index, kg/m2 | |||||||||||||
| <25 | 196 | ref | ref | ref | ref | ||||||||
| 25-<30 | 105 | −1.40 | 0.16 | <.0001 | −1.31 | 0.21 | <.0001 | 1.32 | 0.42 | 0.002 | −0.21 | 0.25 | 0.41 |
| 30+ | 112 | −2.52 | 0.15 | <.0001 | −2.67 | 0.20 | <.0001 | 1.79 | 0.41 | <.0001 | −1.07 | 0.25 | <.0001 |
| p-value for trend | <.0001 | <.0001 | <.0001 | <.0001 | |||||||||
| Age at menarche (years) | |||||||||||||
| ≤12 | 153 | ref | ref | ref | ref | ||||||||
| 13 | 150 | 0.28 | 0.15 | 0.06 | 0.47 | 0.19 | 0.02 | 0.28 | 0.39 | 0.47 | 0.43 | 0.24 | 0.08 |
| ≥14 | 104 | 0.21 | 0.16 | 0.19 | 0.24 | 0.21 | 0.25 | 0.01 | 0.44 | 0.97 | 0.08 | 0.27 | 0.75 |
| p-value for trend | 0.15 | 0.17 | 0.95 | 0.65 | |||||||||
| Parity | |||||||||||||
| Nulliparous | 98 | ref | ref | ref | ref | ||||||||
| 1 | 58 | 0.10 | 0.22 | 0.66 | 0.20 | 0.28 | 0.48 | 0.54 | 0.57 | 0.35 | 0.55 | 0.35 | 0.11 |
| 2 | 164 | 0.11 | 0.17 | 0.52 | −0.17 | 0.22 | 0.43 | 0.04 | 0.43 | 0.93 | −0.03 | 0.27 | 0.92 |
| 3+ | 92 | 0.08 | 0.19 | 0.66 | −0.13 | 0.25 | 0.60 | −0.62 | 0.50 | 0.21 | −0.16 | 0.30 | 0.61 |
| p-value for trend | 0.59 | 0.37 | 0.23 | 0.39 | |||||||||
| Age at first birth (years) | |||||||||||||
| <30 | 217 | ref | ref | ref | ref | ||||||||
| Nulliparous or ≥30 | 195 | 0.14 | 0.13 | 0.30 | 0.20 | 0.17 | 0.24 | 0.41 | 0.34 | 0.23 | 0.13 | 0.21 | 0.53 |
| p-value for trend | 0.13 | 0.87 | 0.44 | 0.54 | |||||||||
| Oral contraceptives | |||||||||||||
| Never | 58 | ref | ref | ref | ref | ||||||||
| Former | 335 | −0.11 | 0.18 | 0.55 | −0.02 | 0.23 | 0.92 | −0.32 | 0.47 | 0.49 | −0.17 | 0.29 | 0.55 |
| Current | 14 | 0.28 | 0.39 | 0.46 | 0.36 | 0.50 | 0.48 | 0.79 | 1.02 | 0.44 | 0.39 | 0.62 | 0.53 |
| Menopausal status | |||||||||||||
| Premenopausal | 250 | ref | ref | ref | ref | ||||||||
| Postmenopausal | 163 | −0.84 | 0.20 | <.0001 | −0.79 | 0.27 | 0.004 | −1.47 | 0.55 | 0.007 | −0.80 | 0.33 | 0.02 |
| Age at menopause (years) | |||||||||||||
| Premenopausal | 250 | 0.89 | 0.32 | 0.006 | 0.35 | 0.42 | 0.40 | 1.71 | 0.85 | 0.04 | 0.32 | 0.52 | 0.53 |
| ≤45 | 32 | 0.23 | 0.35 | 0.51 | −0.15 | 0.46 | 0.74 | 0.37 | 0.93 | 0.69 | −0.28 | 0.57 | 0.62 |
| 46–49 | 34 | 0.11 | 0.34 | 0.75 | −0.62 | 0.45 | 0.17 | 0.12 | 0.92 | 0.89 | −0.86 | 0.56 | 0.13 |
| 50–52 | 23 | ref | ref | ref | ref | ||||||||
| 53+ | 21 | 0.11 | 0.39 | 0.77 | −0.46 | 0.51 | 0.37 | 0.53 | 1.04 | 0.61 | −0.49 | 0.63 | 0.44 |
| Postmenopausal, age unknown | 53 | −0.08 | 0.32 | 0.81 | −0.61 | 0.42 | 0.15 | 0.34 | 0.85 | 0.69 | −0.51 | 0.52 | 0.32 |
| Menopausal hormone therapy | |||||||||||||
| Never | 303 | ref | ref | ref | ref | ||||||||
| Former | 77 | 0.05 | 0.18 | 0.79 | −0.05 | 0.23 | 0.83 | −0.78 | 0.46 | 0.10 | −0.27 | 0.28 | 0.34 |
| Current | 20 | 0.38 | 0.31 | 0.23 | 0.004 | 0.41 | 0.99 | −0.56 | 0.82 | 0.49 | −0.43 | 0.50 | 0.39 |
| Missing/Unknown | 13 | 0.39 | 0.37 | 0.29 | 0.67 | 0.48 | 0.16 | 1.16 | 0.97 | 0.23 | 0.85 | 0.59 | 0.15 |
| Cigarette smoking, 100+ cigarettes/lifetime | |||||||||||||
| Never | 203 | ref | ref | ref | ref | ||||||||
| Ever | 201 | −0.30 | 0.13 | 0.02 | −0.45 | 0.17 | 0.008 | 0.22 | 0.34 | 0.52 | −0.21 | 0.21 | 0.31 |
| Breast biopsy prior to enrollment | |||||||||||||
| Never | 269 | ref | ref | ref | ref | ||||||||
| Ever | 140 | 0.32 | 0.14 | 0.02 | 0.62 | 0.18 | 0.0004 | 0.55 | 0.36 | 0.12 | 0.71 | 0.22 | 0.001 |
| Family history of breast cancer in a 1st degree female relative | |||||||||||||
| 0 | 305 | ref | ref | ref | ref | ||||||||
| 1+ | 103 | 0.18 | 0.15 | 0.23 | 0.08 | 0.19 | 0.69 | 0.56 | 0.39 | 0.15 | 0.11 | 0.24 | 0.65 |
| Lump at the time of mammography | |||||||||||||
| No | 357 | ref | ref | ref | ref | ||||||||
| Yes | 52 | 0.23 | 0.19 | 0.24 | 0.64 | 0.25 | 0.01 | −0.76 | 0.51 | 0.14 | 0.49 | 0.31 | 0.12 |
| Reason for mammography | |||||||||||||
| Screening | 326 | ref | ref | ref | ref | ||||||||
| Short-interval follow-up | 21 | −0.05 | 0.29 | 0.87 | 0.61 | 0.38 | 0.11 | −0.42 | 0.77 | 0.58 | 0.61 | 0.47 | 0.20 |
| Evaluation of breast problem | 61 | 0.13 | 0.18 | 0.46 | 0.51 | 0.24 | 0.03 | −0.61 | 0.48 | 0.20 | 0.45 | 0.29 | 0.12 |
| BI-RADS breast density | |||||||||||||
| I (entirely fat) | 56 | ref | ref | ref | ref | ||||||||
| II (scattered densities) | 183 | 0.51 | 0.17 | 0.002 | 1.60 | 0.18 | <.0001 | 0.64 | 0.51 | 0.21 | 2.15 | 0.26 | <.0001 |
| III (heterogeneously dense) | 131 | 1.47 | 0.18 | <.0001 | 3.35 | 0.20 | <.0001 | 1.56 | 0.56 | 0.01 | 3.72 | 0.29 | <.0001 |
| IV (extremely dense) | 33 | 2.81 | 0.25 | <.0001 | 4.79 | 0.27 | <.0001 | 2.85 | 0.78 | 0.0003 | 4.67 | 0.39 | <.0001 |
| p-value for trend | <.0001 | <.0001 | <.0001 | <.0001 | |||||||||
| Final BI-RADS mammography assessment | |||||||||||||
| 3 (probably benign finding) | 26 | ref | ref | ref | ref | ||||||||
| 4 (suspicious abnormality) | 363 | 0.29 | 0.26 | 0.27 | 0.23 | 0.34 | 0.51 | 0.73 | 0.68 | 0.29 | 0.35 | 0.42 | 0.40 |
| 5 (highly suggestive of malignancy) | 23 | −0.03 | 0.37 | 0.93 | 0.27 | 0.48 | 0.58 | 0.26 | 0.98 | 0.79 | 0.33 | 0.60 | 0.58 |
| p-value for trend | 0.96 | 0.53 | 0.68 | 0.50 | |||||||||
| Biopsy type | |||||||||||||
| Ultrasound-guided | 195 | ref | ref | ref | ref | ||||||||
| Stereotactic-guided | 208 | 0.16 | 0.13 | 0.23 | 0.13 | 0.17 | 0.46 | 0.36 | 0.34 | 0.29 | 0.15 | 0.21 | 0.49 |
| Both | 7 | 0.41 | 0.50 | 0.41 | 0.20 | 0.66 | 0.76 | 2.63 | 1.32 | 0.047 | 0.88 | 0.81 | 0.28 |
| Biopsy laterality | |||||||||||||
| Left | 203 | ref | ref | ref | ref | ||||||||
| Right | 210 | −0.25 | 0.13 | 0.05 | 0.21 | 0.17 | 0.20 | −1.42 | 0.33 | <.0001 | 0.12 | 0.21 | 0.55 |
| Pathologic diagnosis | |||||||||||||
| Benign | 141 | ref | ref | ref | ref | ||||||||
| Proliferative | 171 | 0.10 | 0.15 | 0.51 | −0.06 | 0.19 | 0.75 | 0.28 | 0.39 | 0.47 | −0.01 | 0.24 | 0.96 |
| Proliferative with atypia | 32 | 0.55 | 0.26 | 0.03 | 0.81 | 0.33 | 0.02 | 0.81 | 0.68 | 0.24 | 0.71 | 0.41 | 0.09 |
| In situ | 34 | −0.09 | 0.25 | 0.73 | 0.21 | 0.33 | 0.53 | 0.13 | 0.67 | 0.85 | 0.20 | 0.41 | 0.63 |
| Invasive breast cancer | 35 | 0.06 | 0.25 | 0.81 | 0.06 | 0.32 | 0.86 | 0.60 | 0.65 | 0.36 | 0.23 | 0.40 | 0.56 |
| p-value for trend | 0.71 | 0.35 | 0.35 | 0.32 | |||||||||
BI-RADS, Breast Imaging Reporting and Data System; BMI, body mass index; DA, dense area; FGV, fibroglandular volume; PD, percent density
Mammographic density measures were square-root transformed.
Tertiles of height and weight are presented.
FGV and DA decreased with increasing age and with menopause, though associations were weaker than those observed for the percent density measures. Whereas DA was inversely associated with weight and BMI, FGV was positively associated with weight and BMI. Absolute density measures were positively associated with education and history of breast biopsy but findings were only statistically significant for DA. On the other hand, elevated FGV (but not DA) of the contralateral breast was associated with having a left breast biopsy at study enrollment. FGV and DA increased with increasing BI-RADS breast density categories. Statistically significant trends were not observed with any of the density measures for height, age at menarche, parity, age at first birth, final BI-RADS diagnostic mammography assessment, and pathologic diagnosis; use of oral contraceptives and MHT, and family history of breast cancer were also not associated with any of the density measures.
Results from linear models in which we regressed the residuals from a fully adjusted model for PD (in which BMI, breast biopsy prior to enrollment, age at menarche, proliferative atypia pathologic diagnosis, and ever smoking were associated with PD) on % FGV revealed that % FGV was still strongly associated with PD (p<0.0001, data not shown). Likewise, regression of residuals from a fully adjusted model for DA (in which BMI and breast biopsy prior to enrollment were associated with DA) on FGV yielded statistically significant results (p<0.0001).
Discussion
This analysis of women referred for clinically indicated breast biopsies demonstrates associations between a reproducible, valid, and automated volumetric density methodology—SXA—with some well-known density correlates, providing further support for the broad comparability of this measurement technique in FFDM. Although volume and area density measures were correlated with each other and shared important risk factor associations with several epidemiological factors, our data revealed some differences. In particular, higher absolute dense volume, but not area, was associated with elevated BMI.
The inverse associations we observed for % FGV with age, BMI and menopause are consistent with prior studies using different volumetric density approaches, including: the Standard Mammogram Form (SMF) tool, which uses imaging acquisition parameters to determine breast thickness and compute volumetric density for digitized films (14, 16, 18); a density phantom on digitized images (15); and a FFDM method which incorporates imaging acquisition parameters and internal calibration to estimate volume (17). We found elevated % FGV among never smokers and those with a history of breast biopsy, observations that are consistent with prior studies of PD (30–33). However, we did not observe associations with some reproductive factors that have been previously reported to be inversely associated with % FGV and breast cancer risk, such as parity (15, 17, 18) and early age at first birth (15, 17). With each birth, PD is thought to decrease by ~2% (12). The prior studies that observed associations for parity and age at first birth reported similar relationships for both % FGV and PD (15, 17, 18). Parity and age at first birth were not associated with % FGV or PD in our study; this may reflect unique characteristics and potentially limited generalizability of our study population, which consisted primarily of white, highly educated women, who were referred for a breast biopsy from breast imaging.
With respect to absolute density, we found significant inverse associations between age and FGV and DA. While our findings are consistent with prior work on DA (14, 17, 30), age has not been related to FGV in prior studies using different volumetric density methodologies (14, 17, 18). Similarly, we observed inverse associations between menopause and FGV, a finding consistent with one FFDM study (17) but not two other studies that evaluated the relation in digitized mammograms (14, 16). The varying results for absolute density and these established breast cancer risk factors could be due to differences in volumetric density assessment across studies. Indeed, SXA is the only volumetric methodology that has been shown to provide stronger risk associations than area measures for both % FGV and FGV (23). As absolute density is thought to reflect the breast tissue at risk, it is possible that SXA captures a potentially more biologically relevant measure of absolute dense tissue as compared with other density methods.
Volume and area density measures were positively correlated with one another, but not perfectly so, suggesting that volumetric density measurements do provide some different information. The divergent findings we observed for BMI – its positive association with FGV but inverse association with DA – have been reported previously in studies using different volumetric density methods (14, 16–18), including SXA in digitized films (23). We delved further into the relation between volume and area density, stratifying by BMI, and found that the correlations between FGV and DA were strongest among the leanest women and decreased with increasing BMI. One explanation for the contrasting BMI associations is that FGV and DA likely capture different variations in breast tissue composition. For SXA, water contained in adipose tissue contributes to the FGV measure (23), which translates into higher % FGV than PD, and potentially contributes to the accuracy of % and absolute FGV in risk prediction (23). Indeed, it is thought that both the fibroglandular and adipose tissue components, which are reflected radiographically in mammographic breast density, play a role in breast carcinogenesis (12).
We had the unique opportunity to evaluate density associations with characteristics associated with biopsy and subsequent pathologic diagnosis. We found that neither volume nor area density measures were associated with lesion severity, although our study population was limited in that patients with breast imaging assessments highly suggestive of malignancy were less likely to be enrolled. Nevertheless, our null finding is not necessarily surprising; prior work in the VBCSS has shown that risk factors that traditionally predict the future development of breast cancer, including BI-RADS density (34), do not necessarily predict biopsy outcome at the time of biopsy (35). We observed that elevated FGV in the breast contralateral to the area of suspicion was related to an increased likelihood of undergoing a biopsy in the left breast. This finding could be related to chance, although prior studies have consistently demonstrated that breast cancer is more frequently diagnosed in the left breast (36–38).
SXA requires the installation of density phantoms and prospective collection of data, as compared with other volumetric methods (39, 40), which can be retrospectively applied. Although SXA has been previously shown to be associated with breast cancer risk in digitized mammograms (23), its definitive relationship with risk in FFDM remains to be established. Nevertheless, the demonstrated associations between SXA density measures with established density correlates in expected directions, combined with the strong associations between SXA with quantitative area and BI-RADS density measures, lends support to its validity in FFDM. Though volumetric in its conceptual design, SXA still represents a volumetric measure that is derived from a 2-D mammography system. The distribution of fibroglandular tissue may be assessed by true 3-D breast imaging modalities (e.g., magnetic resonance imaging (MRI), ultrasound tomography (41)), but the added utility of these methods has not been established. However, a recent study showed that SXA from FFDM corresponds well to MRI measures of fibroglandular volume, suggesting that SXA may indeed be an accurate and valid representation of breast tissue volumes (42).
Strengths of our study include the use of an automated volumetric density method that precludes the need for operator training. Volumetric measures were calibrated to permit estimation of dense volume using a reference standard. Evaluation of the contralateral breast mitigated concerns that density estimates were influenced by so-called “field effects” related to the suspicious lesions. On the other hand, these field effects – if apparent in the mammogram – may serve as a useful clinical indicator of underlying pathology (43). Prior studies have reported that high-risk lesions tend to occur in regions of the breast that are mammographically dense (44, 45), suggesting that localized density measures may prove to be informative with respect to risk prediction. Research relating peri-lesional dense volumes surrounding the biopsy target to pathologic diagnosis in this study population is ongoing.
In conclusion, our findings suggest that risk factor associations with volumetric density, estimated with the SXA method, differ from those with area density, particularly for BMI. Future comparisons of volume and area density measures stratified by BMI may clarify whether differences between these measures translate into differences in breast cancer risk, particularly among obese women.
Supplementary Material
Acknowledgments
Financial Support: This research was supported in part by the Intramural Research Program of the NIH, National Cancer Institute and Breast Cancer Research Stamp Funds. Cooperative agreement U01CA70013 (B.M. Geller, P.M. Vacek, D.L. Weaver, R.E. Chicoine, S.D. Herschorn) and 1R21CA157254 (J.A. Shepherd, B. Fan, A.P. Mahmoudzadeh) from the National Cancer Institute funded some of the data collection and image analysis for this study.
The authors are indebted to the participants in the BREAST Stamp Project for their outstanding cooperation and to the physicians, pathologists, nurses, technologists, and interviewers for their efforts in the field. The authors thank Clair Bove, Patricia Lutton, Ellen Young, Aileen Burke, Laura Linville, and Daphne Papathomas for research assistance. We also thank Janet Lawler-Heaver and Kerry Grace Morrissey from Westat for study management support and Franklin Demuth at Information Management Services for data support and analysis.
Footnotes
Disclosure of Potential Conflicts of Interest: No potential conflicts were disclosed by any authors.
References
- 1.Boyd NF, Lockwood GA, Byng JW, Tritchler DL, Yaffe MJ. Mammographic densities and breast cancer risk. Cancer Epidemiol Biomarkers Prev. 1998;7:1133–44. [PubMed] [Google Scholar]
- 2.McCormack VA, dos Santos Silva I. Breast Density and Parenchymal Patterns as Markers of Breast Cancer Risk: A Meta-analysis. Cancer Epidemiol Biomarkers Prev. 2006;15:1159–69. doi: 10.1158/1055-9965.EPI-06-0034. [DOI] [PubMed] [Google Scholar]
- 3.D’Orsi CJ, Bassett LW, Berg WA, et al. Breast Imaging Reporting and Data System: ACR BI-RADS-Mammography. 4. Reston, VA: American College of Radiology; 2003. [Google Scholar]
- 4.Yaffe M. Mammographic density. Measurement of mammographic density. Breast Cancer Research. 2008;10:209. doi: 10.1186/bcr2102. [DOI] [PMC free article] [PubMed] [Google Scholar]
- 5.Highnam R, Pan X, Warren R, Jeffreys M, Davey Smith G, Brady M. Breast composition measurements using retrospective standard mammogram form (SMF) Phys Med Biol. 2006;51:2695–713. doi: 10.1088/0031-9155/51/11/001. [DOI] [PubMed] [Google Scholar]
- 6.Pawluczyk O, Augustine BJ, Yaffe MJ, Rico D, Yang J, Mawdsley GE, et al. A volumetric method for estimation of breast density on digitized screen-film mammograms. Med Phys. 2003;30:352–64. doi: 10.1118/1.1539038. [DOI] [PubMed] [Google Scholar]
- 7.Shepherd JA, Herve L, Landau J, Fan B, Kerlikowske K, Cummings SR. Novel use of single X-ray absorptiometry for measuring breast density. Technol Cancer Res Treat. 2005;4:173–82. doi: 10.1177/153303460500400206. [DOI] [PubMed] [Google Scholar]
- 8.Gweon HM, Youk JH, Jeong-Ah K, Son EJ. Radiologist Assessment of Breast Density by BI-RADS Categories Versus Fully Automated Volumetric Assessment. American Journal of Roentgenology. 2013;201:692–7. doi: 10.2214/AJR.12.10197. [DOI] [PubMed] [Google Scholar]
- 9.van Engeland S, Snoeren PR, Huisman H, Boetes C, Karssemeijer N. Volumetric breast density estimation from full-field digital mammograms. IEEE Trans Med Imaging. 2006;25:273–82. doi: 10.1109/TMI.2005.862741. [DOI] [PubMed] [Google Scholar]
- 10.Malkov S, Wang J, Kerlikowske K, Cummings SR, Shepherd JA. Single x-ray absorptiometry method for the quantitative mammographic measure of fibroglandular tissue volume. Med Phys. 2009;36:5525–36. doi: 10.1118/1.3253972. [DOI] [PMC free article] [PubMed] [Google Scholar]
- 11.Ciatto S, Bernardi D, Calabrese M, Durando M, Gentilini MA, Mariscotti G, et al. A first evaluation of breast radiological density assessment by QUANTRA software as compared to visual classification. Breast. 2012;21:503–6. doi: 10.1016/j.breast.2012.01.005. [DOI] [PubMed] [Google Scholar]
- 12.Martin LJ, Boyd NF. Mammographic density - Potential mechanisms of breast cancer risk associated with mammographic density: hypotheses based on epidemiological evidence. Breast Cancer Res. 2008;10:201. doi: 10.1186/bcr1831. [DOI] [PMC free article] [PubMed] [Google Scholar]
- 13.Martin LJ, Minkin S, Boyd NF. Hormone therapy, mammographic density, and breast cancer risk. Maturitas. 2009;64:20–6. doi: 10.1016/j.maturitas.2009.07.009. [DOI] [PubMed] [Google Scholar]
- 14.Aitken Z, McCormack VA, Highnam RP, Martin L, Gunasekara A, Melnichouk O, et al. Screen-Film Mammographic Density and Breast Cancer Risk: A Comparison of the Volumetric Standard Mammogram Form and the Interactive Threshold Measurement Methods. Cancer Epidemiology Biomarkers & Prevention. 2010;19:418–28. doi: 10.1158/1055-9965.EPI-09-1059. [DOI] [PMC free article] [PubMed] [Google Scholar]
- 15.Boyd N, Martin L, Gunasekara A, Melnichouk O, Maudsley G, Peressotti C, et al. Mammographic density and breast cancer risk: evaluation of a novel method of measuring breast tissue volumes. Cancer Epidemiol Biomarkers Prev. 2009;18:1754–62. doi: 10.1158/1055-9965.EPI-09-0107. [DOI] [PubMed] [Google Scholar]
- 16.Jeffreys M, Warren R, Highnam R, Davey Smith G. Breast cancer risk factors and a novel measure of volumetric breast density: cross-sectional study. Br J Cancer. 2008;98:210–6. doi: 10.1038/sj.bjc.6604122. [DOI] [PMC free article] [PubMed] [Google Scholar]
- 17.Lokate M, Kallenberg MG, Karssemeijer N, Van den Bosch MA, Peeters PH, Van Gils CH. Volumetric breast density from full-field digital mammograms and its association with breast cancer risk factors: a comparison with a threshold method. Cancer Epidemiol Biomarkers Prev. 2010;19:3096–105. doi: 10.1158/1055-9965.EPI-10-0703. [DOI] [PubMed] [Google Scholar]
- 18.McCormack VA, Highnam R, Perry N, dos Santos Silva I. Comparison of a new and existing method of mammographic density measurement: intramethod reliability and associations with known risk factors. Cancer Epidemiol Biomarkers Prev. 2007;16:1148–54. doi: 10.1158/1055-9965.EPI-07-0085. [DOI] [PMC free article] [PubMed] [Google Scholar]
- 19.van den Brandt PA, Spiegelman D, Yaun SS, Adami HO, Beeson L, Folsom AR, et al. Pooled analysis of prospective cohort studies on height, weight, and breast cancer risk. American Journal of Epidemiology. 2000;152:514–27. doi: 10.1093/aje/152.6.514. [DOI] [PubMed] [Google Scholar]
- 20.Protani M, Coory M, Martin JH. Effect of obesity on survival of women with breast cancer: systematic review and meta-analysis. Breast Cancer Res Treat. 2010;123:627–35. doi: 10.1007/s10549-010-0990-0. [DOI] [PubMed] [Google Scholar]
- 21.Ding J, Warren R, Warsi I, Day N, Thompson D, Brady M, et al. Evaluating the Effectiveness of Using Standard Mammogram Form to Predict Breast Cancer Risk: Case-Control Study. Cancer Epidemiol Biomarkers Prev. 2008;17:1074–81. doi: 10.1158/1055-9965.EPI-07-2634. [DOI] [PubMed] [Google Scholar]
- 22.Stone J, Ding J, Warren RM, Duffy SW. Predicting breast cancer risk using mammographic density measurements from both mammogram sides and views. Breast Cancer Res Treat. 2010;124:551–4. doi: 10.1007/s10549-010-0976-y. [DOI] [PubMed] [Google Scholar]
- 23.Shepherd JA, Kerlikowske K, Ma L, Duewer F, Fan B, Wang J, et al. Volume of Mammmographic Density and Risk of Breast Cancer. Cancer Epidemiology Biomarkers & Prevention. 2011;20:1473–82. doi: 10.1158/1055-9965.EPI-10-1150. [DOI] [PMC free article] [PubMed] [Google Scholar]
- 24.Gierach GL, Yang XR, Figueroa JD, Sherman ME. Emerging concepts in breast cancer risk prediction. Obstet Gynecol Rep. doi: 10.1007/s13669-012-0034-3. In Press. [DOI] [PMC free article] [PubMed] [Google Scholar]
- 25.Ballard-Barbash R, Taplin SH, Yankaskas BC, Ernster VL, Rosenberg RD, Carney PA, et al. Breast Cancer Surveillance Consortium: a national mammography screening and outcomes database. AJR Am J Roentgenol. 1997;169:1001–8. doi: 10.2214/ajr.169.4.9308451. [DOI] [PubMed] [Google Scholar]
- 26.Breastscreening.cancer.gov [Internet] Bethesda, MD: Applied Research Program, Division of Cancer Control and Population Sciences, National Cancer Institute, U.S. National Institutes of Health; updated 07 Feb 2014 [cited 2014 May 21]; Available from: http://breastscreening.cancer.gov/ [Google Scholar]
- 27.Prevrhal S, Shepherd JA, Smith-Bindman R, Cummings SR, Kerlikowske K. Accuracy of Mammographic Breast Density Analysis: Results of Formal Operator Training. Cancer Epidemiol Biomarkers Prev. 2002;11:1389–93. [PubMed] [Google Scholar]
- 28.Byng JW, Boyd NF, Fishell E, Jong RA, Yaffe MJ. The quantitative analysis of mammographic densities. Phys Med Biol. 1994;39:1629–38. doi: 10.1088/0031-9155/39/10/008. [DOI] [PubMed] [Google Scholar]
- 29.Box G, Cox D. An analysis of transformations. Journal of the Royal Statistical Society. 1964;26:211–522. [Google Scholar]
- 30.Stone J, Warren RML, Pinney E, Warwick J, Cuzick J. Determinants of Percentage and Area Measures of Mammographic Density. Am J Epidemiol. 2009;170:1571–8. doi: 10.1093/aje/kwp313. [DOI] [PubMed] [Google Scholar]
- 31.Cabanes A, Pastor-Barriuso R, García-López M, Pedraz-Pingarrón C, Sánchez-Contador C, Vázquez Carrete J, et al. Alcohol, tobacco, and mammographic density: a population-based study. Breast Cancer Research and Treatment. 2011;129:135–47. doi: 10.1007/s10549-011-1414-5. [DOI] [PubMed] [Google Scholar]
- 32.Butler L, Gold E, Conroy S, Crandall C, Greendale G, Oestreicher N, et al. Active, but not passive cigarette smoking was inversely associated with mammographic density. Cancer Causes and Control. 2010;21:301–11. doi: 10.1007/s10552-009-9462-4. [DOI] [PMC free article] [PubMed] [Google Scholar]
- 33.Byrne C, Schairer C, Wolfe J, Parekh N, Salane M, Brinton LA, et al. Mammographic features and breast cancer risk: effects with time, age, and menopause status. J Natl Cancer Inst. 1995;87:1622–9. doi: 10.1093/jnci/87.21.1622. [DOI] [PubMed] [Google Scholar]
- 34.Vacek PM, Geller BM. A Prospective Study of Breast Cancer Risk Using Routine Mammographic Breast Density Measurements. Cancer Epidemiol Biomarkers Prev. 2004;13:715–22. [PubMed] [Google Scholar]
- 35.Weaver DL, Vacek PM, Skelly JM, Geller BM. Predicting Biopsy Outcome After Mammography: What Is the Likelihood the Patient Has Invasive or In Situ Breast Cancer? Annals of Surgical Oncology. 2005;12:660–73. doi: 10.1245/ASO.2005.09.008. [DOI] [PubMed] [Google Scholar]
- 36.Weiss HA, Devesa SS, Brinton LA. Laterality of breast cancer in the United States. Cancer Causes Control. 1996;7:539–43. doi: 10.1007/BF00051887. [DOI] [PubMed] [Google Scholar]
- 37.Perkins CI, Hotes J, Kohler BA, Howe HL. Association between breast cancer laterality and tumor location, United States, 1994–1998. Cancer Causes Control. 2004;15:637–45. doi: 10.1023/B:CACO.0000036171.44162.5f. [DOI] [PubMed] [Google Scholar]
- 38.Garfinkel L, Craig L, Seidman H. An appraisal of left and right breast cancer. J Natl Cancer Inst. 1959;23:617–31. [PubMed] [Google Scholar]
- 39.Jeffreys M, Warren R, Highnam R, Davey Smith G. Initial experiences of using an automated volumetric measure of breast density: the standard mammogram form. Br J Radiol. 2006;79:378–82. doi: 10.1259/bjr/24769358. [DOI] [PubMed] [Google Scholar]
- 40.Ellison-Loschmann L, McKenzie F, Highnam R, Cave A, Walker J, Jeffreys M. Age and ethnic differences in volumetric breast density in new zealand women: a cross-sectional study. PLoS One. 2013;8:e70217. doi: 10.1371/journal.pone.0070217. [DOI] [PMC free article] [PubMed] [Google Scholar]
- 41.Boyd NF, Martin LJ, Bronskill M, Yaffe MJ, Duric N, Minkin S. Breast Tissue Composition and Susceptibility to Breast Cancer. J Natl Cancer Inst. 2010;102:1224–37. doi: 10.1093/jnci/djq239. [DOI] [PMC free article] [PubMed] [Google Scholar]
- 42.Wang J, Azziz A, Fan B, Malkov S, Klifa C, Newitt D, et al. Agreement of mammographic measures of volumetric breast density to MRI. PLoS One. 2013;8:e81653. doi: 10.1371/journal.pone.0081653. [DOI] [PMC free article] [PubMed] [Google Scholar]
- 43.Sherman ME, Mies C, Gierach GL. Opportunities for molecular epidemiological research on ductal carcinoma in-situ and breast carcinogenesis: Interdisciplinary approaches. Breast Dis. 2013 Nov 13; doi: 10.3233/BD-130359. (E-pub) [DOI] [PMC free article] [PubMed] [Google Scholar]
- 44.Ursin G, Hovanessian-Larsen L, Parisky Y, Pike M, Wu A. Greatly increased occurrence of breast cancers in areas of mammographically dense tissue. Breast Cancer Research. 2005;7:R605–R8. doi: 10.1186/bcr1260. [DOI] [PMC free article] [PubMed] [Google Scholar]
- 45.Pinto Pereira SM, McCormack VA, Hipwell JH, Record C, Wilkinson LS, Moss SM, et al. Localized fibroglandular tissue as a predictor of future tumor location within the breast. Cancer Epidemiol Biomarkers Prev. 2011;20:1718–25. doi: 10.1158/1055-9965.EPI-11-0423. [DOI] [PMC free article] [PubMed] [Google Scholar]
Associated Data
This section collects any data citations, data availability statements, or supplementary materials included in this article.