

Abstract
Aims
Ultraviolet irradiation and carcinogens have been reported to induce epigenetic alterations, which potentially contribute to the development of skin cancer. We aimed to study the genome-wide DNA methylation profiles of skin cancers induced by ultraviolet B (UVB) irradiation and 7,12-dimethylbenz(a)anthracene (DMBA)/12-O-tetradecanoylphorbol-1,3-acetate (TPA).
Main methods
Methylated DNA immunoprecipitation (MeDIP) followed by next-generation sequencing was utilized to ascertain the DNA methylation profiles in the following common mouse skin cancer models: SKH-1 mice treated with UVB irradiation and CD-1 mice treated with DMBA/TPA. Ingenuity® pathway analysis (IPA) software was utilized to analyze the data and to identify gene interactions among the different pathways.
Key findings
6,003 genes in the UVB group and 5,424 genes in the DMBA/TPA group exhibited a greater than 2-fold change in CpG methylation as mapped by the IPA software. The top canonical pathways identified by IPA after the two treatments were ranked were pathways related to cancer development, cAMP-mediated signaling, G protein-coupled receptor signaling and PTEN signaling associated with UVB treatment, whereas protein kinase A signaling and xenobiotic metabolism signaling were associated with DMBA/TPA treatment. In addition, the mapped IL-6-related inflammatory pathways displayed alterations in the methylation profiles of inflammation-related genes linked to UVB treatment.
Significance
Genes with altered methylation were ranked in the UVB and DMBA/TPA models, and the molecular interaction networks of those genes were identified by the IPA software. The genome-wide DNA methylation profiles of skin cancers induced by UV irradiation or by DMBA/TPA will be useful for future studies on epigenetic gene regulation in skin carcinogenesis.
Keywords: DNA methylation, epigenetics, MeDIP-Seq, UVB, DMBA/TPA
Introduction
Accumulating evidence suggests that epigenetic DNA alterations play a crucial role in cancer initiation and development. Specifically, aberrant DNA methylation at the 5′-position of cytosine in CG dinucleotides in the cancer genome is postulated to be the most relevant epigenetic change in cancer [1]. DNA methylation affects gene expression and therefore regulates a wide range of biological processes, including proliferation, cell death, mutation and cancer initiation/promotion/progression [2, 3]. Both global hypomethylation and regional hypermethylation are characteristics of tumorigenesis [4, 5]. DNA hypermethylation at promoter regions is a predominant epigenetic mechanism for reducing the expression of tumor suppressor genes. Epigenetic silencing of tumor suppressor genes has been reported in mouse models of malignant tumors [6, 7]. Thus, the present study aimed to profile the global DNA methylation changes that occur during carcinogenesis. To address this aim, we conducted global profiling of DNA methylation changes in two representative skin carcinogenesis models, ultraviolet B (UVB)-exposed SKH-1 hairless mice and DMBA/TPA-induced carcinogenesis in CD-1 mice.
Ultraviolet irradiation has been reported to induce epigenetic alterations, which may contribute to the development of skin cancer [8]. However, the precise mechanism by which UV irradiation is related to melanomagenesis remains unclear. In addition, a method for screening epigenetically modified genes in melanoma patients needs to be established [9, 10]. Mutations in oncogenes and tumor suppressor genes have been reported in melanoma. However, most of these mutations are not present in non-melanoma skin cancer [11], suggesting a specific role for UV irradiation in melanomagenesis. In skin tumors, UV irradiation has been reported to induce epigenetic modifications and may contribute to the development of skin cancer. Epigenetic changes, such as DNA methylation and histone modification, may play a crucial role in the initiation and development of certain types of cancer [12]. Epigenetic alterations generally represent the interface between the environment and the genome [13].
The multistage skin carcinogenesis model is established by applying a sub-threshold dose of the carcinogen DMBA followed by repetitive treatments with the tumor promoter TPA. With three well-defined stages—initiation, promotion, and progression—this model is similar to natural human tumor development. This model has been widely used to investigate the anti-tumor efficacy of chemicals and the molecular events that occur during each stage of tumor development. Several genetic alterations identified in human skin cancer patients have also been described in the mouse multistage skin carcinogenesis model, such as changes in cyclin D1 [14], TP53 [15], CDKN21 [16] and PTEN [17]. The underlying similarity in the biology of cancer between mice and humans implies that genes related to mouse tumor development may also be relevant to human tumor development.
In the present study, we used methylated DNA immunoprecipitation (MeDIP) coupled with next-generation sequencing to profile the whole genome DNA methylation patterns from the UVB and DMBA/TPA models. The MeDIP-Seq results were evaluated by Ingenuity® Pathway Analysis (IPA) to investigate genetic crosstalk and signal/function overlap. The present study included an initial assessment of genes with a modified methylation profile and the identification of interacting molecular networks in skin carcinogenesis models.
Materials and methods
Chemicals and antibodies
The chemicals used in the current study were as follows: 7,12-dimethylbenz(a)anthracene (DMBA; Sigma-Aldrich, MO, USA) and 12-O-tetradecanoylphorbol-1,3-acetate (TPA; Alexis Co., CA, USA). The 5-methylcytidine monoclonal antibody was purchased from Eurogentec., Belgium.
Mice and skin cancer induction
Two representative skin carcinogenesis models were utilized in the present study. SKH-1 hairless female mice, 7-8 weeks old, were treated with UVB (30 mJ/cm2) twice a week for 36 weeks. The UV lamps (FS72T12-UVB-HO; National Biological, Twinsburg, OH) emitted UVB (280-320 nm; 70-80% of the total energy) and ultraviolet A (320-375 nm; 20-75% of the total energy). The dose of UVB was quantified using a UVB Spectra 305 dosimeter (The Daavlin Company, Bryan, OH). The radiation was further calibrated using a research radiometer/photometer (model IL-1700; International Light Inc., Newburyport, MA). The mice were assessed twice weekly for the appearance of papillomas and carcinomas. Skin papilloma and carcinoma samples were collected, frozen in liquid nitrogen and stored at −80 °C. The epidermises of age-matched untreated mice were isolated from fresh skin as a control group.
Six-week-old female CD-1 mice were used for the DMBA/TPA-induced multistage carcinogenesis model. One day before treatment, the backs of the mice were shaved. For tumor initiation, 200 nmol DMBA in 200 μL of acetone was injected into the back skin of the mice. Three days after DMBA treatment, 5 nmol TPA in 200 μL of acetone was applied three times a week for 11 weeks to induce tumor promotion and progression.
Global analysis of methylated DNA
Genomic DNA (gDNA) was extracted from UV irradiation-induced tumor samples from 3 female mice and from non-irradiated epidermis samples from 3 female age-matched SKH-1 mice; from female CD-1 mice in the DMBA/TPA-induced carcinogenesis model for the MeDIP-Seq assay. gDNA was extracted using a DNeasy Kit (Qiagen, Valencia, CA) according to the manufacturer’s protocol. The gDNA was electrophoresed on an agarose gel, and the OD ratios were determined to confirm the purity and concentration of the gDNA prior to fragmentation by Covaris (Covaris, Inc., Woburn, MA USA). Fragmented gDNA was evaluated for size distribution and concentration using an Agilent Bioanalyzer 2100 and a NanoDrop spectrophotometer.
MeDIP-Seq
MeDIP was performed to analyze genome-wide methylation. MeDIP was performed using a MagMeDIP Kit from Diagenode according to the manufacturer’s instructions. Methylated DNA was recovered by immunoprecipitation with antibodies specific to methylated cytosine used to separate methylated DNA fragments from unmethylated fragments, and Illumina libraries were created from the captured gDNA using NEBNext reagents (catalog# E6040; New England Biolabs, Ipswich, MA, USA). Enriched libraries were evaluated for size distribution and concentration using an Agilent Bioanalyzer 2100. The samples were then sequenced on an Illumina HiSeq2000 machine, which generated paired-end reads of 90 or 100 nucleotides (nt). The results were analyzed for data quality and exome coverage using the platform provided by DNAnexus (DNAnexus, Inc., Mountain View, CA, USA). Samples were sent to Otogenetics Corporation (Norcross, GA) for Illumina sequencing and alignment with the genome. The resulting BAM files were downloaded for analysis.
MeDIP alignments were compared with control samples using Cuffdiff 2.0.2 with no length correction [18]. Briefly, a list of overlapping regions of sequence alignment common to both the immunoprecipitated and the control samples was created and used to judge the quantitative enrichment in MeDIP samples over control samples using Cuffdiff; statistically significant peaks at 5% FDR and a minimum 4-fold difference using the Cummerbund package in R were selected [18]. Peaks were matched with adjacent annotated genes using ChIPpeakAnno [19].
Functional and pathway analysis by Ingenuity Pathway Analysis (IPA)
We analyzed lists of genes with significant fold changes (based on the P values; UV-induced tumor vs. control and DMBA/TPA treatment vs. control) in the methylation pattern (increases and decreases) ascertained in the MeDIP-Seq experiment using Ingenuity® Pathways Analysis 4.0 (IPA 4.0, Ingenuity Systems, www.ingenuity.com). IPA utilized gene symbols that were identified as neighboring enriched methylation peaks by ChIPpeakAnno used for all of the analyses. IPA mapped 6,003 genes in the UVB group and 5,424 genes in the DMBA/TPA group with a ≥ 2-fold change compared with the control correspondingly. Based on these fold change data, IPA identified biological functions and canonical pathways related to UVB-induced cancer. The list of genes within canonical pathways was ranked using the ratio of the number of genes mapped to each pathway to the total number of genes in the corresponding pathway, which is presented as observations/total in Table 3.
Table 3.
Top 5 altered canonical pathways determined using Ingenuity Pathways Software in the UVB and DMBA/TPA groups. The shared pathways are shown in bold.
| Rank | Name | Ratio | Observation/Total | p-value |
|---|---|---|---|---|
| UVB/Control | ||||
| 1 | cAMP-mediated signaling | 0.478 | 108/226 | 1.27E-09 |
| 2 | G-Protein Coupled Receptor Signaling | 0.442 | 122/276 | 5.24E-09 |
| 3 | Molecular Mechanisms of Cancer | 0.371 | 144/388 | 9.86E-07 |
| 4 | PTEN Signaling | 0.42 | 58/138 | 5.21E-06 |
| 5 | Role of Osteoblasts, Osteoclasts and Chondrocytes in Rheumatoid Arthritis | 0.388 | 97/250 | 5.58E-06 |
| DMBA-TPA/Control | ||||
| 1 | Protein Kinase A Signaling | 0.352 | 144/409 | 5.5E-06 |
| 2 | Molecular Mechanisms of Cancer | 0.325 | 126/338 | 4.57E-05 |
| 3 | Xenobiotic Metabolism Signaling | 0.351 | 101/288 | 7.59E-05 |
| 4 | Regulation of the Epithelial-Mesenchymal Transition Pathway | 0.342 | 67/196 | 0.0011 |
| 5 | Mouse Embryonic Stem Cell Pluripotency | 0.394 | 39/99 | 0.0013 |
Results
MeDIP-Seq results
Skin samples were collected from the UVB- and DMBA/TPA-induced mouse skin cancer models, and gDNA was isolated from each sample. A whole-genome DNA methylation analysis was performed on the DNA samples using the described MeDIP-Seq method. The results were analyzed in a paired manner comparing the tumor to the normal skin tissue samples for each model.
In the UVB group, 6,003 genes were identified in the two samples with a ≥ 2-fold change in methylation and an increase or decrease in gene expression. Compared with the control, 4,140 genes exhibited increased methylation, and methylation was decreased in 1,863 genes (Figure 1). However, in the DMBA/TPA treatment group, 5,424 genes were identified with a ≥ 2-fold change in peak reads between the tumor and the normal skin samples. Among these 5,424 genes, the methylation pattern was up-regulated in 3,781 genes and down-regulated in 1,643 genes. To prioritize those changes, we ranked the top 50 up-regulated (+, Table 1) and down-regulated (−, Table 2) genes based on the log2 fold change from highest to lowest, all with P values less than 0.05.
Figure 1.
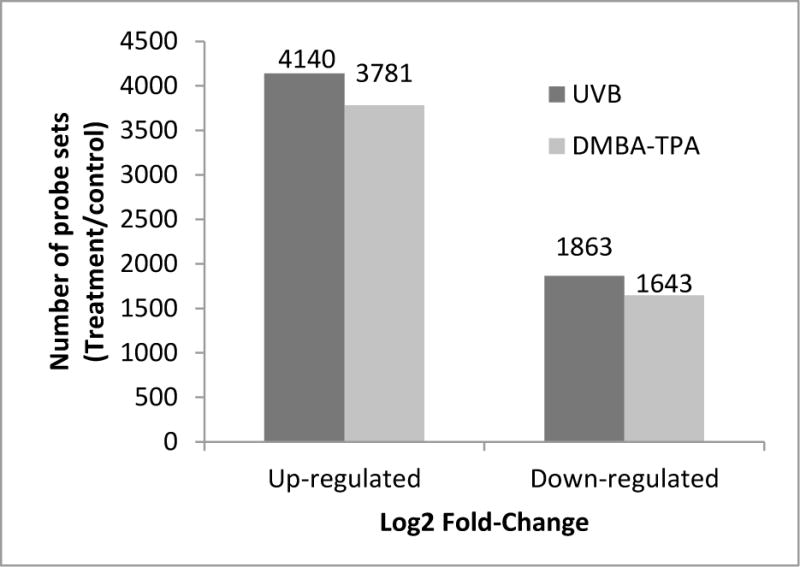
Total number of significantly up-regulated and down-regulated genes based on changes in methylation (≥ 2-fold change) in the UVB and DMBA/TPA groups.
Table 1.
Top 50 annotated genes with up-regulated methylation ranked by log2 fold change. (A) UVB group. (B) DMBA/TPA group.
| (A)
| |||||
|---|---|---|---|---|---|
| Rank | Symbol | Gene Name | Log2 Fold Change (UVB/Control) | Location | Type(s) |
| 1 | RBFOX1 | RNA binding protein, fox-1 homolog (C. elegans) 1 | 5.457 | Cytoplasm | other |
| 2 | IMPG2 | interphotoreceptor matrix proteoglycan 2 | 5.367 | Extracellular Space | other |
| 3 | DGKK | diacylglycerol kinase, kappa | 5.31 | Cytoplasm | kinase |
| 4 | MAD1L1 | MAD1 mitotic arrest deficient-like 1 (yeast) | 5.252 | Nucleus | other |
| 5 | EVX2 | even-skipped homeobox 2 | 5.19 | Nucleus | transcription regulator |
| 6 | PAN3 | PAN3 poly(A) specific ribonuclease subunit homolog (S. cerevisiae) | 4.989 | Cytoplasm | other |
| 7 | AAMP | angio-associated, migratory cell protein | 4.837 | Plasma Membrane | other |
| 8 | ARHGAP18 | Rho GTPase activating protein 18 | 4.837 | Cytoplasm | other |
| 9 | ACAA2 | acetyl-CoA acyltransferase 2 | 4.574 | Cytoplasm | enzyme |
| 10 | OLFM1 | olfactomedin 1 | 4.574 | Cytoplasm | other |
| 11 | TGS1 | trimethylguanosine synthase 1 | 4.574 | Nucleus | enzyme |
| 12 | DYM | dymeclin | 4.525 | Cytoplasm | other |
| 13 | Hspg2 | heparan sulfate proteoglycan 2 | 4.474 | Extracellular Space | other |
| 14 | Kcnip2 | Kv channel-interacting protein 2 | 4.474 | Plasma Membrane | other |
| 15 | TNS1 | tensin 1 | 4.474 | Plasma Membrane | other |
| 16 | AGAP1 | ArfGAP with GTPase domain, ankyrin repeat and PH domain 1 | 4.367 | Cytoplasm | enzyme |
| 17 | CCDC180 | coiled-coil domain containing 180 | 4.367 | Other | other |
| 18 | EDN1 | endothelin 1 | 4.367 | Extracellular Space | cytokine |
| 19 | FOXE1 | forkhead box E1 (thyroid transcription factor 2) | 4.367 | Nucleus | transcription regulator |
| 20 | KCNN4 | potassium intermediate/small conductance calcium-activated channel, subfamily N, member 4 | 4.367 | Plasma Membrane | ion channel |
| 21 | LOXHD1 | lipoxygenase homology domains 1 | 4.367 | Extracellular Space | other |
| 22 | DCP2 | decapping mRNA 2 | 4.252 | Nucleus | enzyme |
| 23 | DET1 | de-etiolated homolog 1 (Arabidopsis) | 4.252 | Nucleus | other |
| 24 | DSC3 | desmocollin 3 | 4.252 | Plasma Membrane | other |
| 25 | HOXD11 | homeobox D11 | 4.252 | Nucleus | transcription regulator |
| 26 | MAML2 | mastermind-like 2 (Drosophila) | 4.252 | Nucleus | transcription regulator |
| 27 | MYO1E | myosin IE | 4.252 | Cytoplasm | enzyme |
| 28 | PCBD1 | pterin-4 alpha-carbinolamine dehydratase/dimerization cofactor of hepatocyte nuclear factor 1 alpha | 4.252 | Nucleus | transcription regulator |
| 29 | WNT3 | wingless-type MMTV integration site family, member 3 | 4.252 | Extracellular Space | other |
| 30 | CENPF | centromere protein F, 350/400kDa | 4.126 | Nucleus | other |
| 31 | Dos | downstream of Stk11 | 4.126 | Other | other |
| 32 | FBXO11 | F-box protein 11 | 4.126 | Cytoplasm | enzyme |
| 33 | GPR37 | G protein-coupled receptor 37 (endothelin receptor type B-like) | 4.126 | Plasma Membrane | G-protein coupled receptor |
| 34 | HPCA | hippocalcin | 4.126 | Cytoplasm | other |
| 35 | LIMS2 | LIM and senescent cell antigen-like domains 2 | 4.126 | Cytoplasm | other |
| 36 | LRRC8B | leucine rich repeat containing 8 family, member B | 4.126 | Other | other |
| 37 | LTA4H | leukotriene A4 hydrolase | 4.126 | Cytoplasm | enzyme |
| 38 | MEMO1 | mediator of cell motility 1 | 4.126 | Cytoplasm | other |
| 39 | mir-221 | microRNA 221 | 4.126 | Cytoplasm | microRNA |
| 40 | mir-802 | microRNA 802 | 4.126 | Cytoplasm | microRNA |
| 41 | Olfr1323 | olfactory receptor 1323 | 4.126 | Plasma Membrane | G-protein coupled receptor |
| 42 | PLN | phospholamban | 4.126 | Cytoplasm | transporter |
| 43 | PTPN23 | protein tyrosine phosphatase, non-receptor type 23 | 4.126 | Cytoplasm | phosphatase |
| 44 | SLC7A9 | solute carrier family 7 (amino acid transporter light chain, bo,+ system), member 9 | 4.126 | Plasma Membrane | transporter |
| 45 | VRK1 | vaccinia related kinase 1 | 4.126 | Nucleus | kinase |
| 46 | ZBTB34 | zinc finger and BTB domain containing 34 | 4.126 | Nucleus | other |
| 47 | ZNF622 | zinc finger protein 622 | 4.126 | Nucleus | other |
| 48 | SMYD2 | SET and MYND domain containing 2 | 4.082 | Cytoplasm | enzyme |
| 49 | DYSF | dysferlin, limb girdle muscular dystrophy 2B (autosomal recessive) | 3.989 | Plasma Membrane | other |
| 50 | Ear2 (includes others) | eosinophil-associated, ribonuclease A family, member 2 | 3.989 | Cytoplasm | enzyme |
| (B)
| |||||
|---|---|---|---|---|---|
| Rank | Symbol | Gene Name | Log2 Fold Change (DMBA-TPA/Control) | Location | Type(s) |
| 1 | FAM135A | family with sequence similarity 135, member A | 5.974 | Other | enzyme |
| 2 | CADM2 | cell adhesion molecule 2 | 5.231 | Plasma Membrane | other |
| 3 | VWC2L | von Willebrand factor C domain containing protein 2-like | 4.877 | Extracellular Space | other |
| 4 | PTH2R | parathyroid hormone 2 receptor | 4.708 | Plasma Membrane | G-protein coupled receptor |
| 5 | NPY | neuropeptide Y | 4.515 | Extracellular Space | other |
| 6 | TNS1 | tensin 1 | 4.408 | Plasma Membrane | other |
| 7 | PHYHIPL | phytanoyl-CoA 2-hydroxylase interacting protein-like | 4.408 | Cytoplasm | other |
| 8 | COX7C | cytochrome c oxidase subunit VIIc | 4.408 | Cytoplasm | enzyme |
| 9 | CMYA5 | cardiomyopathy associated 5 | 4.408 | Plasma Membrane | other |
| 10 | HELB | helicase (DNA) B | 4.351 | Nucleus | enzyme |
| 11 | WDR63 | WD repeat domain 63 | 4.292 | Other | other |
| 12 | SIPA1L2 | signal-induced proliferation-associated 1 like 2 | 4.292 | Other | other |
| 13 | let-7 | microRNA let-7a-1 | 4.292 | Cytoplasm | microRNA |
| 14 | DSEL | dermatan sulfate epimerase-like | 4.292 | Extracellular Space | enzyme |
| 15 | ZNF521 | zinc finger protein 521 | 4.167 | Nucleus | other |
| 16 | TMTC2 | transmembrane and tetratricopeptide repeat containing 2 | 4.167 | Cytoplasm | other |
| 17 | OTOL1 | otolin 1 | 4.167 | Other | other |
| 18 | METTL21A | methyltransferase like 21A | 4.167 | Other | enzyme |
| 19 | INTU | inturned planar cell polarity protein | 4.167 | Cytoplasm | other |
| 20 | DHCR7 | 7-dehydrocholesterol reductase | 4.167 | Cytoplasm | enzyme |
| 21 | Cyp2a12/Cyp2a22 | cytochrome P450, family 2, subfamily a, polypeptide 12 | 4.167 | Cytoplasm | enzyme |
| 22 | CTSC | cathepsin C | 4.167 | Cytoplasm | peptidase |
| 23 | CHORDC1 | cysteine and histidine-rich domain (CHORD) containing 1 | 4.167 | Other | other |
| 24 | CBLN1 | cerebellin 1 precursor | 4.167 | Cytoplasm | other |
| 25 | THAP1 | THAP domain containing, apoptosis associated protein 1 | 4.029 | Nucleus | other |
| 26 | RYBP | RING1 and YY1 binding protein | 4.029 | Nucleus | transcription regulator |
| 27 | NDUFA12 | NADH dehydrogenase (ubiquinone) 1 alpha subcomplex, 12 | 4.029 | Cytoplasm | enzyme |
| 28 | Mug1/Mug2 | murinoglobulin 1 | 4.029 | Extracellular Space | transporter |
| 29 | MFSD10 | major facilitator superfamily domain containing 10 | 4.029 | Other | transporter |
| 30 | KIF16B | kinesin family member 16B | 4.029 | Cytoplasm | enzyme |
| 31 | GRID2 | glutamate receptor, ionotropic, delta 2 | 4.029 | Plasma Membrane | ion channel |
| 32 | Gm4836 (includes others) | predicted gene 4836 | 4.029 | Cytoplasm | other |
| 33 | FOXN3 | forkhead box N3 | 4.029 | Nucleus | transcription regulator |
| 34 | Cyp4f16/Gm9705 | cytochrome P450, family 4, subfamily f, polypeptide 16 | 4.029 | Cytoplasm | enzyme |
| 35 | CXorf22 | chromosome X open reading frame 22 | 4.029 | Other | other |
| 36 | Pag1 | phosphoprotein associated with glycosphingolipid microdomains 1 | 3.955 | Plasma Membrane | other |
| 37 | MSH6 | mutS homolog 6 | 3.923 | Nucleus | enzyme |
| 38 | ZFAT | zinc finger and AT hook domain containing | 3.877 | Nucleus | other |
| 39 | Vmn1r188 (includes others) | vomeronasal 1 receptor 217 | 3.877 | Plasma Membrane | G-protein coupled receptor |
| 40 | TYW3 | tRNA-yW synthesizing protein 3 homolog (S. cerevisiae) | 3.877 | Other | other |
| 41 | TPO | thyroid peroxidase | 3.877 | Plasma Membrane | enzyme |
| 42 | TLR4 | toll-like receptor 4 | 3.877 | Plasma Membrane | transmembrane receptor |
| 43 | THSD7B | thrombospondin, type I, domain containing 7B | 3.877 | Other | other |
| 44 | SPINK5 | serine peptidase inhibitor, Kazal type 5 | 3.877 | Extracellular Space | other |
| 45 | SLC9A8 | solute carrier family 9, subfamily A (NHE8, cation proton antiporter 8), member 8 | 3.877 | Cytoplasm | transporter |
| 46 | SEC23A | Sec23 homolog A (S. cerevisiae) | 3.877 | Cytoplasm | transporter |
| 47 | RPS4Y1 | ribosomal protein S4, Y-linked 1 | 3.877 | Cytoplasm | other |
| 48 | PPP1R1C | protein phosphatase 1, regulatory (inhibitor) subunit 1C | 3.877 | Cytoplasm | phosphatase |
| 49 | PARP8 | poly (ADP-ribose) polymerase family, member 8 | 3.877 | Other | other |
| 50 | NLRP4 | NLR family, pyrin domain containing 4 | 3.877 | Cytoplasm | other |
Table 2.
Top 50 annotated genes with down-regulated methylation ranked by log2 fold change. (A) UVB group. (B) DMBA/TPA group.
| (A)
| |||||
|---|---|---|---|---|---|
| Symbol | Gene Name | Log2 Fold Change (UVB/Control) | Location | Type(s) | |
| 1 | Nrxn3 | neurexin III | −4.543 | Plasma Membrane | other |
| 2 | SYN2 | synapsin II | −4.378 | Plasma Membrane | other |
| 3 | Mup1 (includes others) | major urinary protein 1 | −4.333 | Extracellular Space | other |
| 4 | KRT86 | keratin 86 | −4.24 | Cytoplasm | other |
| 5 | SULT1C3 | sulfotransferase family, cytosolic, 1C, member 3 | −4.24 | Cytoplasm | enzyme |
| 6 | ATP1A3 | ATPase, Na+/K+ transporting, alpha 3 polypeptide | −4.191 | Plasma Membrane | transporter |
| 7 | CHORDC1 | cysteine and histidine-rich domain (CHORD) containing 1 | −4.191 | Other | other |
| 8 | NRXN1 | neurexin 1 | −4.191 | Plasma Membrane | transporter |
| 9 | Htr6 | 5-hydroxytryptamine (serotonin) receptor 6, G protein-coupled | −4.141 | Plasma Membrane | G-protein coupled receptor |
| 10 | PAM | peptidylglycine alpha-amidating monooxygenase | −4.141 | Plasma Membrane | enzyme |
| 11 | SERPINB3 | serpin peptidase inhibitor, clade B (ovalbumin), member | −4.141 | Cytoplasm | other |
| 12 | TDRD3 | tudor domain containing 3 | −4.141 | Nucleus | transcription regulator |
| 13 | Olfr1153 | olfactory receptor 1153 | −4.088 | Plasma Membrane | G-protein coupled receptor |
| 14 | WFIKKN2 | WAP, follistatin/kazal, immunoglobulin, kunitz and netrin domain containing 2 | −4.088 | Other | other |
| 15 | ABAT | 4-aminobutyrate aminotransferase | −4.034 | Cytoplasm | enzyme |
| 16 | ARHGAP6 | Rho GTPase activating protein 6 | −4.034 | Cytoplasm | other |
| 17 | AUH | AU RNA binding protein/enoyl-CoA hydratase | −4.034 | Cytoplasm | enzyme |
| 18 | CEP70 | centrosomal protein 70kDa | −4.034 | Cytoplasm | other |
| 19 | DGKH | diacylglycerol kinase, eta | −4.034 | Cytoplasm | kinase |
| 20 | GRIA1 | glutamate receptor, ionotropic, AMPA 1 | −4.034 | Plasma Membrane | ion channel |
| 21 | SLC4A7 | solute carrier family 4, sodium bicarbonate cotransporter, member 7 | −4.034 | Plasma Membrane | transporter |
| 22 | SLITRK1 | SLIT and NTRK-like family, member 1 | −4.034 | Other | other |
| 23 | Speer4a (includes others) | spermatogenesis associated glutamate (E)-rich protein 4a | −4.034 | Nucleus | other |
| 24 | CETN1 | centrin, EF-hand protein, 1 | −3.977 | Nucleus | enzyme |
| 25 | CYLC1 | cylicin, basic protein of sperm head cytoskeleton 1 | −3.977 | Cytoplasm | other |
| 26 | HS3ST5 | heparan sulfate (glucosamine) 3-O-sulfotransferase 5 | −3.977 | Cytoplasm | enzyme |
| 27 | Ott (includes others) | ovary testis transcribed | −3.977 | Other | other |
| 28 | Scg5 | secretogranin V | −3.977 | Cytoplasm | other |
| 29 | CHM | choroideremia (Rab escort protein 1) | −3.918 | Cytoplasm | enzyme |
| 30 | Clvs2 | clavesin 2 | −3.918 | Cytoplasm | other |
| 31 | MRPS30 | mitochondrial ribosomal protein S30 | −3.918 | Cytoplasm | enzyme |
| 32 | Olfr1010 | olfactory receptor 1010 | −3.918 | Plasma Membrane | G-protein coupled receptor |
| 33 | PPP1R12A | protein phosphatase 1, regulatory subunit 12A | −3.918 | Cytoplasm | phosphatase |
| 34 | ZMYND11 | zinc finger, MYND-type containing 11 | −3.918 | Nucleus | other |
| 35 | ADCY10 | adenylate cyclase 10 (soluble) | −3.857 | Cytoplasm | enzyme |
| 36 | Agtr1b | angiotensin II receptor, type 1b | −3.857 | Plasma Membrane | G-protein coupled receptor |
| 37 | APAF1 | apoptotic peptidase activating factor 1 | −3.857 | Cytoplasm | other |
| 38 | AQP1 | aquaporin 1 | −3.857 | Plasma Membrane | transporter |
| 39 | CDH10 | cadherin 10, type 2 (T2-cadherin) | −3.857 | Plasma Membrane | other |
| 40 | CHRM3 | cholinergic receptor, muscarinic 3 | −3.857 | Plasma Membrane | G-protein coupled receptor |
| 41 | GCNT2 | glucosaminyl (N-acetyl) transferase 2, I-branching enzyme (I blood group) | −3.857 | Cytoplasm | enzyme |
| 42 | GNAI1 | guanine nucleotide binding protein (G protein), alpha inhibiting activity polypeptide 1 | −3.857 | Plasma Membrane | enzyme |
| 43 | SELENBP1 | selenium binding protein 1 | −3.857 | Cytoplasm | other |
| 44 | SP110 | SP110 nuclear body protein | −3.857 | Nucleus | other |
| 45 | TMEM5 | transmembrane protein 5 | −3.857 | Plasma Membrane | other |
| 46 | XIRP2 | xin actin-binding repeat containing 2 | −3.857 | Other | other |
| 47 | ZKSCAN2 | zinc finger with KRAB and SCAN domains 2 | −3.857 | Nucleus | transcription regulator |
| 48 | 1700009N14Rik | RIKEN cDNA 1700009N14 gene | −3.793 | Other | transporter |
| 49 | AGPAT9 | 1-acylglycerol-3-phosphate O-acyltransferase 9 | −3.793 | Cytoplasm | enzyme |
| 50 | ASCL1 | achaete-scute complex homolog 1 (Drosophila) | −3.793 | Nucleus | transcription regulator |
| (B)
| |||||
|---|---|---|---|---|---|
| Rank | Symbol | Gene Name | Log2 Fold Change (DMBA-TPA/Control) | Location | Type(s) |
| 1 | EBPL | emopamil binding protein-like | −5.292 | Cytoplasm | enzyme |
| 2 | PANX1 | pannexin 1 | −5.247 | Plasma Membrane | transporter |
| 3 | HES5 | hairy and enhancer of split 5 (Drosophila) | −4.632 | Nucleus | other |
| 4 | LHX4 | LIM homeobox 4 | −4.247 | Nucleus | transcription regulator |
| 5 | GSG1L | GSG1-like | −4.247 | Plasma Membrane | other |
| 6 | PBX1 | pre-B-cell leukemia homeobox 1 | −4.199 | Nucleus | transcription regulator |
| 7 | LRRC8B | leucine rich repeat containing 8 family, member B | −4.199 | Other | other |
| 8 | ASAH2 | N-acylsphingosine amidohydrolase (non-lysosomal ceramidase) 2 | −4.199 | Cytoplasm | enzyme |
| 9 | ALKBH3 | alkB, alkylation repair homolog 3 (E. coli) | −4.199 | Nucleus | enzyme |
| 10 | ZNF518B | zinc finger protein 518B | −4.100 | Other | other |
| 11 | MAN1A1 | mannosidase, alpha, class 1A, member 1 | −4.100 | Cytoplasm | enzyme |
| 12 | TOX3 | TOX high mobility group box family member 3 | −3.993 | Other | other |
| 13 | LSM11 | LSM11, U7 small nuclear RNA associated | −3.936 | Nucleus | other |
| 14 | TCEA3 | transcription elongation factor A (SII), 3 | −3.877 | Nucleus | transcription regulator |
| 15 | OR7D2 | olfactory receptor, family 7, subfamily D, member 2 | −3.877 | Plasma Membrane | G-protein coupled receptor |
| 16 | KIAA0947 | KIAA0947 | −3.877 | Other | other |
| 17 | CBLB | Cbl proto-oncogene B, E3 ubiquitin protein ligase | −3.877 | Nucleus | other |
| 18 | NOS1AP | nitric oxide synthase 1 (neuronal) adaptor protein | −3.816 | Cytoplasm | other |
| 19 | MACC1 | metastasis associated in colon cancer 1 | −3.816 | Nucleus | other |
| 20 | ZNF277 | zinc finger protein 277 | −3.752 | Nucleus | transcription regulator |
| 21 | Sp100 | nuclear antigen Sp100 | −3.752 | Nucleus | transcription regulator |
| 22 | KCNA6 | potassium voltage-gated channel, shaker-related subfamily, member 6 | −3.752 | Plasma Membrane | ion channel |
| 23 | C19orf10 | chromosome 19 open reading frame 10 | −3.752 | Extracellular Space | cytokine |
| 24 | TMEM17 | transmembrane protein 17 | −3.685 | Extracellular Space | other |
| 25 | FAM92B | family with sequence similarity 92, member B | −3.650 | Other | other |
| 26 | TBC1D5 | TBC1 domain family, member 5 | −3.646 | Extracellular Space | other |
| 27 | Nrg1 | neuregulin 1 | −3.614 | Extracellular Space | growth factor |
| 28 | GORASP1 | golgi reassembly stacking protein 1, 65kDa | −3.614 | Cytoplasm | other |
| 29 | AHRR | aryl-hydrocarbon receptor repressor | −3.614 | Nucleus | other |
| 30 | ADORA2A | adenosine A2a receptor | −3.614 | Plasma Membrane | G-protein coupled receptor |
| 31 | RAB11A | RAB11A, member RAS oncogene family | −3.540 | Cytoplasm | enzyme |
| 32 | ISY1-RAB43 | ISY1-RAB43 readthrough | −3.540 | Nucleus | other |
| 33 | GNE | glucosamine (UDP-N-acetyl)-2-epimerase/N-acetylmannosamine kinase | −3.540 | Cytoplasm | kinase |
| 34 | FAM98A | family with sequence similarity 98, member A | −3.540 | Other | other |
| 35 | ENPP4 | ectonucleotide pyrophosphatase/phosphodiesterase 4 (putative) | −3.540 | Other | enzyme |
| 36 | CCDC43 | coiled-coil domain containing 43 | −3.540 | Other | other |
| 37 | ARHGEF10 | Rho guanine nucleotide exchange factor (GEF) 10 | −3.540 | Cytoplasm | enzyme |
| 38 | TARSL2 | threonyl-tRNA synthetase-like 2 | −3.462 | Other | enzyme |
| 39 | SCARB1 | scavenger receptor class B, member 1 | −3.462 | Plasma Membrane | transporter |
| 40 | RAB27A | RAB27A, member RAS oncogene family | −3.462 | Cytoplasm | enzyme |
| 41 | L3MBTL3 | l(3)mbt-like 3 (Drosophila) | −3.462 | Nucleus | other |
| 42 | Higd1a | HIG1 domain family, member 1A | −3.462 | Cytoplasm | other |
| 43 | GRIA1 | glutamate receptor, ionotropic, AMPA 1 | −3.462 | Plasma Membrane | ion channel |
| 44 | GPC5 | glypican 5 | −3.462 | Plasma Membrane | other |
| 45 | CLGN | calmegin | −3.462 | Cytoplasm | peptidase |
| 46 | CHKA | choline kinase alpha | −3.462 | Cytoplasm | kinase |
| 47 | ASGR1 | asialoglycoprotein receptor 1 | −3.462 | Plasma Membrane | transmembrane receptor |
| 48 | AMY2A | amylase, alpha 2A (pancreatic) | −3.462 | Extracellular Space | enzyme |
| 49 | C1orf109 | chromosome 1 open reading frame 109 | −3.444 | Other | other |
| 50 | CADPS | Ca++-dependent secretion activator | −3.430 | Plasma Membrane | other |
Pathway analysis by IPA
To ascertain the significance of the methylation changes, 6,003 genes in the UVB group and 5,424 genes in the DMBA/TPA group with a greater than 2-fold change in methylation were analyzed using the Ingenuity® Pathway Analysis (IPA) software package. The top 5 canonical signaling pathways were categorized (Table 3) based on the ratio of the number of input genes to the total number of genes in the corresponding pathway in the Ingenuity® Pathway Analysis software. Fisher’s exact test was used to calculate P values to determine the significance of the associations of the input genes with the canonical pathways.
IPA identified more than 50 signaling pathways containing genes with significantly up-regulated and down-regulated methylation. The interleukin-6 (IL-6)-related signaling pathway was mapped by IPA to the UVB group (Figure 2); the methylation profile is presented in red (up-regulation) and green (down-regulation). Figure 2B lists the genes involved in the IL-6 signaling pathway that exhibited altered methylation (14 up-regulated and 30 down-regulated) as mapped by IPA. It has been reported that IL-6 protein expression is induced by UV irradiation [20]. Correspondingly, the MeDIP-Seq data revealed that IL-6 up-regulated methylation by 3.252-fold (log2). Based on the IPA functional pathways, skin cancer belongs to the category of mechanism of cancer. The top 5 genes related to skin cancer based on IPA are ranked by fold change in Table 4. This list includes genes with increased methylation and genes with decreased methylation that are related to skin cancer pathways by IPA.
Figure 2.
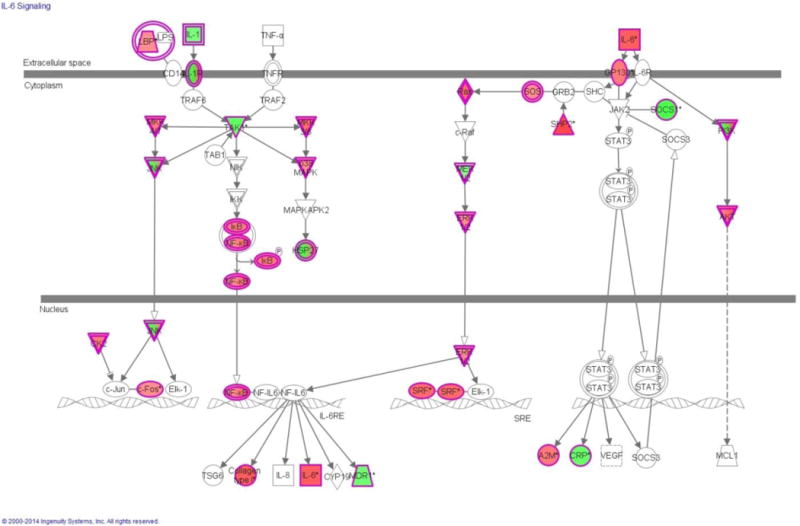
(A) Genes mapped to the IL-6 pathway by IPA Software. Red, increased methylation; green, decreased methylation; UVB irradiated vs. control. (B) List of genes mapped to the IL-6 pathway by IPA.
Table 4.
Top 5 genes with altered methylation (up-regulated or down-regulated) that were related to skin cancer using the IPA Software Functional and Diseases analysis module in the UVB and the DMBA/TPA groups. The shared genes are shown in bold.
| Rank | Mapped Genes | Log2 Fold Change |
|---|---|---|
| UVB/Control | ||
| Up-regulated | ||
| 1 | RBFOX1 | 5.457 |
| 2 | LOXHD1 | 4.367 |
| 3 | EDN1 | 4.367 |
| 4 | DYSF | 3.989 |
| 5 | NPSR1 | 3.837 |
| Down-regulated | ||
| 1 | SULT1C3 | −4.24 |
| 2 | ABAT | −4.034 |
| 3 | GRIA1 | −4.034 |
| 4 | PCSK1 | −3.726 |
| 5 | SCN2A | −3.655 |
| DMBA-TPA/Control | ||
| Up-regulated | ||
| 1 | GRID2 | 4.029 |
| 2 | NLRP4 | 3.877 |
| 3 | EMR1 | 3.877 |
| 4 | IL15 | 3.877 |
| 5 | PCDH18 | 3.708 |
| Down-regulated | ||
| 1 | GRIA1 | −3.462 |
| 2 | CADPS | −3.43 |
| 3 | BCL2L11 | −3.292 |
| 4 | ACVR1C | −3.292 |
| 5 | GRM3 | −3.292 |
Discussion
It was previously reported that hypermethylation of CpG islands in tumor suppressor genes occurs in human squamous cell carcinoma cell lines and in primary skin tumor tissues. Similar changes in DNA methylation patterns were observed in the multistage mouse skin cancer model. In addition, loss of global genomic methylation has been shown to be associated with increased aggressiveness of mouse skin cancer cell lines. However, the precise mechanism by which UV irradiation promotes melanoma remains unclear. Furthermore, there is no method for screening potential epigenetically modified genes involved in promoting skin cancers [10, 21–23]. Long-term exposure to UV irradiation is considered a major etiologic risk factor for the development of melanoma and non-melanoma skin cancers. Epigenetic alterations are generally considered to represent the interface between the environment and the genome [13]. Ultraviolet irradiation has been reported to induce epigenetic alterations, which may contribute to the development of skin cancer. In the present study, we performed global genome methylation screening using MeDIP-Seq to identify genomic loci with aberrant methylation patterns in cancer tissues.
One of the adverse effects of UV irradiation that has been observed in skin tumor development is a chronic and sustained inflammatory response. The relationship between inflammation and epigenetic modifications in cancer is under active investigation [24–26]. In this study, a UV irradiation-induced abnormal inflammatory response was suggested based on the IPA mapped IL-6 pathways, which included the methylation profiles of pro-inflammatory cytokines, receptors and mitogen-activated protein kinases. Higher levels of pro-inflammatory cytokines are associated with tumor development and progression [27, 28]. Interleukins (ILs) have different systemic functions and are involved in inflammation. Nile et al. reported that the methylation of CpGs in the promoter region of IL-6 affected the mRNA levels in mononuclear cells [24]. Tekpli et al. reported that the methylation of CpGs near the IL-6 transcriptional start site is significantly higher in non-small cell lung cancer cells and is associated with lower IL-6 mRNA expression [25]. Our study demonstrated that IL-6 gene methylation was significantly higher in UV irradiation-induced skin tumors.
IL-6-Jak-Stat3 inflammatory signaling is also involved in cell survival and provides a proliferative advantage in the two-stage chemical carcinogenesis model using DMBA as the tumor initiator and TPA as the promoter. Phosphorylated-Stat3 overexpression in a papilloma cell line leads to enhanced cell migration and invasion [29]. Transgenic mice with constitutive Stat3 expression have a shorter latency period and increased tumor incidence compared with non-transgenic littermates after DMBA/TPA treatment [30]. Moreover, mice with constitutively activated Stat3 bypassed the premalignant stage and were initially diagnosed with carcinoma in situ, which rapidly progressed to squamous cell carcinoma. In our present study, we found 34 genes with altered DNA methylation in total 124 genes involved in the IL-6 pathway in the UV group. Among these genes with altered methylation, the SOCS1 (suppressor of cytokine signaling 1) gene, which encodes a suppressor in the IL-6-Jak-Stat3 loop, was hypermethylated in the tumor samples.
The top-ranked hypermethylated and hypomethylated genes could enable the discovery of key genes in skin cancer development. For example, RBFOX1 is the top up-regulated gene in terms of methylation status change in UV-irradiated tumors compared with normal epidermis by IPA (Figure 1). RBFOX1 is an RNA-binding protein that is highly expressed in the cytoplasm. RBFOX1 mutations were identified in colorectal cancer cell lines (CRC), and RBFOX1 deletion was observed in a significant proportion of CRC cases (106/419) [31, 32]. However, the role of RBFOX1 in skin cancer development is unclear. Surprisingly, tumor tissues from the DMBA/TPA group exhibited a unique profile in terms of the top 50 genes with up- or down-regulated methylation compared with the profile in the UVB group. Cell adhesion molecule 2 (CADM2) was one of the top methylated genes in DMBA/TPA tumors. CADM2 belongs to a protein family that participates in maintaining cell polarity and that has been considered to be a novel category of tumor suppressors [33]. Clinically, low CADM2 expression predicts a high risk of recurrence in patients with hepatocellular carcinoma after hepatectomy [34]. It has also been reported that aberrant promoter hypermethylation and loss of CADM2 expression are associated with human renal cell carcinoma tumor progression [35]. Our study is the first report to suggest that CADM2 methylation is involved in skin carcinogenesis. Moreover, we identified changes in the methylation patterns of several genes encoding microRNAs, which are also involved in epigenetic regulation. This observation indicates that epigenetic changes may occur at multiple levels with complex crosstalk in skin cancer development and progression.
The genes identified in this study demonstrated significant alterations in response to UV irradiation-induced inflammation and skin cancer development. Although IPA revealed some overlapping signaling changes in response to both UV irradiation and DMBA-TPA treatment and certain highly affected targets were common (including, GRIA1 and TNS1), the top-ranked genes based on fold change differed markedly between the two treatments, indicating that distinct epigenetic mechanisms trigger cancer after exposure to UV or the DMBA carcinogen.
Conclusions
In this study, a comprehensive analysis of the DNA methylation patterns in the UVB or DMBA/TPA induced tumors compared with age-matched normal skin was completed. Genes coding for inflammatory cytokines were identified by IPA to exhibit altered methylation profiles and may be associated with increased susceptibility to tumor development. Specifically, based on changes in methylation, molecular networks were identified that included genes encoding inflammatory cytokines. Additional studies with a particular emphasis on epigenetic alterations, such as DNA methylation, may lead to the development of new strategies for the prevention of skin cancer and inflammation-related skin disease.
Acknowledgments
The authors would like to thank the members of Tony Kong’s laboratory for their helpful discussions. This work was supported in part by institutional funds.
Abbreviations
- MeDIP
Methylated DNA immunoprecipitation
- UVB
Ultraviolet B
- DMBA
7,12-dimethylbenz(a)anthracene
- TPA
12-O-tetradecanoylphorbol-1,3-acetate
- IPA
Ingenuity® pathway analysis
- IL
Interleukin
Footnotes
Conflict of interest statement
The authors declare that there are no conflicts of interest.
References
- 1.Esteller M. Epigenetics in cancer. N Engl J Med. 2008;358(11):1148–59. doi: 10.1056/NEJMra072067. [DOI] [PubMed] [Google Scholar]
- 2.Momparler RL, Bovenzi V. DNA methylation and cancer. J Cell Physiol. 2000;183(2):145–54. doi: 10.1002/(SICI)1097-4652(200005)183:2<145::AID-JCP1>3.0.CO;2-V. [DOI] [PubMed] [Google Scholar]
- 3.Zingg JM, Jones PA. Genetic and epigenetic aspects of DNA methylation on genome expression, evolution, mutation and carcinogenesis. Carcinogenesis. 1997;18(5):869–82. doi: 10.1093/carcin/18.5.869. [DOI] [PubMed] [Google Scholar]
- 4.Baylin SB, Belinsky SA, Herman JG. Aberrant methylation of gene promoters in cancer—concepts, misconcepts, and promise. J Natl Cancer Inst. 2000;92(18):1460–1. doi: 10.1093/jnci/92.18.1460. [DOI] [PubMed] [Google Scholar]
- 5.Laird PW, Jaenisch R. The role of DNA methylation in cancer genetic and epigenetics. Annu Rev Genet. 1996;30:441–64. doi: 10.1146/annurev.genet.30.1.441. [DOI] [PubMed] [Google Scholar]
- 6.Chen WY, et al. Heterozygous disruption of Hic1 predisposes mice to a gender-dependent spectrum of malignant tumors. Nat Genet. 2003;33(2):197–202. doi: 10.1038/ng1077. [DOI] [PubMed] [Google Scholar]
- 7.Tommasi S, et al. Tumor susceptibility of Rassf1a knockout mice. Cancer Res. 2005;65(1):92–8. [PubMed] [Google Scholar]
- 8.Nandakumar V, et al. Aberrant DNA hypermethylation patterns lead to transcriptional silencing of tumor suppressor genes in UVB-exposed skin and UVB-induced skin tumors of mice. Carcinogenesis. 2011;32(4):597–604. doi: 10.1093/carcin/bgq282. [DOI] [PMC free article] [PubMed] [Google Scholar] [Retracted]
- 9.Koga Y, et al. Genome-wide screen of promoter methylation identifies novel markers in melanoma. Genome Res. 2009;19(8):1462–70. doi: 10.1101/gr.091447.109. [DOI] [PMC free article] [PubMed] [Google Scholar]
- 10.Kanavy HE, Gerstenblith MR. Ultraviolet radiation and melanoma. Semin Cutan Med Surg. 2011;30(4):222–8. doi: 10.1016/j.sder.2011.08.003. [DOI] [PubMed] [Google Scholar]
- 11.Hocker T, Tsao H. Ultraviolet radiation and melanoma: a systematic review and analysis of reported sequence variants. Hum Mutat. 2007;28(6):578–88. doi: 10.1002/humu.20481. [DOI] [PubMed] [Google Scholar]
- 12.Ballestar E, Esteller M. Epigenetic gene regulation in cancer. Adv Genet. 2008;61:247–67. doi: 10.1016/S0065-2660(07)00009-0. [DOI] [PubMed] [Google Scholar]
- 13.Jaenisch R, Bird A. Epigenetic regulation of gene expression: how the genome integrates intrinsic and environmental signals. Nat Genet. 2003;33(Suppl):245–54. doi: 10.1038/ng1089. [DOI] [PubMed] [Google Scholar]
- 14.Wilkey JF, et al. Cyclin D1 overexpression increases susceptibility to 4-nitroquinoline-1-oxide-induced dysplasia and neoplasia in murine squamous oral epithelium. Mol Carcinog. 2009;48(9):853–61. doi: 10.1002/mc.20531. [DOI] [PMC free article] [PubMed] [Google Scholar]
- 15.Saab R, et al. p18Ink4c and p53 Act as tumor suppressors in cyclin D1-driven primitive neuroectodermal tumor. Cancer Res. 2009;69(2):440–8. doi: 10.1158/0008-5472.CAN-08-1892. [DOI] [PMC free article] [PubMed] [Google Scholar]
- 16.Nishijo K, et al. Credentialing a preclinical mouse model of alveolar rhabdomyosarcoma. Cancer Res. 2009;69(7):2902–11. doi: 10.1158/0008-5472.CAN-08-3723. [DOI] [PMC free article] [PubMed] [Google Scholar]
- 17.Zheng H, et al. p53 and Pten control neural and glioma stem/progenitor cell renewal and differentiation. Nature. 2008;455(7216):1129–33. doi: 10.1038/nature07443. [DOI] [PMC free article] [PubMed] [Google Scholar]
- 18.Trapnell C, et al. Differential gene and transcript expression analysis of RNA-seq experiments with TopHat and Cufflinks. Nat Protoc. 2012;7(3):562–78. doi: 10.1038/nprot.2012.016. [DOI] [PMC free article] [PubMed] [Google Scholar]
- 19.Zhu LJ, et al. ChIPpeakAnno: a Bioconductor package to annotate ChIP-seq and ChIP-chip data. BMC Bioinformatics. 2010;11:237. doi: 10.1186/1471-2105-11-237. [DOI] [PMC free article] [PubMed] [Google Scholar]
- 20.Vaid M, Sharma SD, Katiyar SK. Honokiol, a phytochemical from the Magnolia plant, inhibits photocarcinogenesis by targeting UVB-induced inflammatory mediators and cell cycle regulators: development of topical formulation. Carcinogenesis. 2010;31(11):2004–11. doi: 10.1093/carcin/bgq186. [DOI] [PubMed] [Google Scholar]
- 21.Jhappan C, Noonan FP, Merlino G. Ultraviolet radiation and cutaneous malignant melanoma. Oncogene. 2003;22(20):3099–112. doi: 10.1038/sj.onc.1206450. [DOI] [PubMed] [Google Scholar]
- 22.Leiter U, Garbe C. Epidemiology of melanoma and nonmelanoma skin cancer–the role of sunlight. Adv Exp Med Biol. 2008;624:89–103. doi: 10.1007/978-0-387-77574-6_8. [DOI] [PubMed] [Google Scholar]
- 23.Moan J, Porojnicu AC, Dahlback A. Ultraviolet radiation and malignant melanoma. Adv Exp Med Biol. 2008;624:104–16. doi: 10.1007/978-0-387-77574-6_9. [DOI] [PubMed] [Google Scholar]
- 24.Nile CJ, et al. Methylation status of a single CpG site in the IL6 promoter is related to IL6 messenger RNA levels and rheumatoid arthritis. Arthritis Rheum. 2008;58(9):2686–93. doi: 10.1002/art.23758. [DOI] [PubMed] [Google Scholar]
- 25.Tekpli X, et al. DNA methylation at promoter regions of interleukin 1B, interleukin 6, and interleukin 8 in non-small cell lung cancer. Cancer Immunol Immunother. 2013;62(2):337–45. doi: 10.1007/s00262-012-1340-3. [DOI] [PMC free article] [PubMed] [Google Scholar]
- 26.Gasche JA, et al. Interleukin-6 promotes tumorigenesis by altering DNA methylation in oral cancer cells. Int J Cancer. 2011;129(5):1053–63. doi: 10.1002/ijc.25764. [DOI] [PMC free article] [PubMed] [Google Scholar]
- 27.Mukhtar H, Elmets CA. Photocarcinogenesis: mechanisms, models and human health implications. Photochem Photobiol. 1996;63(4):356–7. doi: 10.1111/j.1751-1097.1996.tb03040.x. [DOI] [PubMed] [Google Scholar]
- 28.Tron VA, Rosenthal D, Sauder DN. Epidermal interleukin-1 is increased in cutaneous T-cell lymphoma. J Invest Dermatol. 1988;90(3):378–81. doi: 10.1111/1523-1747.ep12456433. [DOI] [PubMed] [Google Scholar]
- 29.Suiqing C, Min Z, Lirong C. Overexpression of phosphorylated-STAT3 correlated with the invasion and metastasis of cutaneous squamous cell carcinoma. J Dermatol. 2005;32(5):354–60. doi: 10.1111/j.1346-8138.2005.tb00906.x. [DOI] [PubMed] [Google Scholar]
- 30.Chan KS, et al. Forced expression of a constitutively active form of Stat3 in mouse epidermis enhances malignant progression of skin tumors induced by two-stage carcinogenesis. Oncogene. 2008;27(8):1087–94. doi: 10.1038/sj.onc.1210726. [DOI] [PubMed] [Google Scholar]
- 31.Cancer Genome Atlas, N. Comprehensive molecular characterization of human colon and rectal cancer. Nature. 2012;487(7407):330–7. doi: 10.1038/nature11252. [DOI] [PMC free article] [PubMed] [Google Scholar]
- 32.Sengupta N, et al. Analysis of colorectal cancers in British Bangladeshi identifies early onset, frequent mucinous histotype and a high prevalence of RBFOX1 deletion. Mol Cancer. 2013;12:1. doi: 10.1186/1476-4598-12-1. [DOI] [PMC free article] [PubMed] [Google Scholar]
- 33.Chang G, et al. Hypoexpression and epigenetic regulation of candidate tumor suppressor gene CADM-2 in human prostate cancer. Clin Cancer Res. 2010;16(22):5390–401. doi: 10.1158/1078-0432.CCR-10-1461. [DOI] [PMC free article] [PubMed] [Google Scholar]
- 34.Yang S, et al. Low CADM2 expression predicts high recurrence risk of hepatocellular carcinoma patients after hepatectomy. J Cancer Res Clin Oncol. 2014;140(1):109–16. doi: 10.1007/s00432-013-1536-8. [DOI] [PubMed] [Google Scholar]
- 35.He W, et al. Aberrant methylation and loss of CADM2 tumor suppressor expression is associated with human renal cell carcinoma tumor progression. Biochem Biophys Res Commun. 2013;435(4):526–32. doi: 10.1016/j.bbrc.2013.04.074. [DOI] [PubMed] [Google Scholar]