

Background: G protein-coupled receptors (GPCRs) adopt multiple structural conformations whose functional significance remains unclear.
Results: Novel FRET-based sensors were developed to detect the stabilization of G protein-specific GPCR conformations in live cells.
Conclusion: FRET measurements delineate distinct structural mechanisms for three β2-adrenergic receptor ligands.
Significance: This study extensively validates a new technology that links GPCR conformation and function in live cells.
Keywords: 7-Helix Receptor, Cell Signaling, Fret, G Protein-coupled Receptors (GPCR), G Proteins, (E/D)RY Motif, Functional Selectivity
Abstract
Although several recent studies have reported that GPCRs adopt multiple conformations, it remains unclear how subtle conformational changes are translated into divergent downstream responses. In this study, we report on a novel class of FRET-based sensors that can detect the ligand/mutagenic stabilization of GPCR conformations that promote interactions with G proteins in live cells. These sensors rely on the well characterized interaction between a GPCR and the C terminus of a Gα subunit. We use these sensors to elucidate the influence of the highly conserved (E/D)RY motif on GPCR conformation. Specifically, Glu/Asp but not Arg mutants of the (E/D)RY motif are known to enhance basal GPCR signaling. Hence, it is unclear whether ionic interactions formed by the (E/D)RY motif (ionic lock) are necessary to stabilize basal GPCR states. We find that mutagenesis of the β2-AR (E/D)RY ionic lock enhances interaction with Gs. However, only Glu/Asp but not Arg mutants increase G protein activation. In contrast, mutagenesis of the opsin (E/D)RY ionic lock does not alter its interaction with transducin. Instead, opsin-specific ionic interactions centered on residue Lys-296 are both necessary and sufficient to promote interactions with transducin. Effective suppression of β2-AR basal activity by inverse agonist ICI 118,551 requires ionic interactions formed by the (E/D)RY motif. In contrast, the inverse agonist metoprolol suppresses interactions with Gs and promotes Gi binding, with concomitant pertussis toxin-sensitive inhibition of adenylyl cyclase activity. Taken together, these studies validate the use of the new FRET sensors while revealing distinct structural mechanisms for ligand-dependent GPCR function.
Introduction
A fundamental unanswered question in GPCR2 signaling is the role of GPCR structural conformations in G protein selection. An emerging view from several studies is that GPCRs are not simple “on-off” switches but adopt a continuum of conformations (1). Structural studies show that ligands stabilize different subsets of structural conformations (2–5). In turn, these ligands are observed to elicit diverse functional responses through the activation of specific G protein heterotrimers or G protein-independent effectors such as arrestins (6). This model would explain the phenomenon of functional selectivity, wherein the same GPCR can elicit diverse ligand-dependent responses (7, 8). However, currently there is no method to directly link ligand-specific changes in GPCR conformations to differential downstream responses (9). This limitation arises in part due to the wide range of factors that influence GPCR signaling, including differential expression of the GPCR and components of the G protein heterotrimer in different cell types, localization to different membrane surfaces or microdomains, and the influence of regulatory proteins such as scaffolds, RGS proteins, kinases, arrestins, and the cellular endocytic apparatus. In this study, this limitation is addressed in part with a novel FRET-based sensor that is designed to detect the relative stabilization of G protein-specific conformations of the same GPCR.
The FRET sensors used in this study are based on a recently developed technique termed systematic protein affinity strength modulation (SPASM) and involve the fusion of a native peptide from the C terminus of a Gα subunit to the C terminus of the intact GPCR (10). The Gα C terminus has been extensively characterized as an important component of the GPCR-G protein binding interface (11–13). Recent structures reveal that the Gα C terminus inserts itself into a cytosolic groove formed in the active GPCR (14–16). Peptides derived from the Gα C terminus bind specifically to the activated GPCR (11, 17) and can competitively inhibit GPCR-G protein interactions (13). The Gα C terminus is also a key determinant of G protein selection by a GPCR (18, 19). The SPASM sensors use a peptide comprising the α5-helix of a Gα C terminus to probe the stabilization of GPCR conformations that favor interactions with the corresponding G protein. In this regard, the SPASM sensors are distinct from established FRET-based GPCR sensors that rely on the insertion of a FRET probe in the third intracellular loop of the GPCR with its pair (donor/acceptor) at the GPCR C terminus (4).
In this study, SPASM sensors were used to examine the conformational changes accompanying ligand-stimulation or mutagenesis of opsin and β2 adrenergic receptor (β2-AR). Specifically, we address a long standing paradox in the function of the highly conserved (E/D)RY motif located at the cytosolic face of the GPCR (20, 21). High-resolution structures of GPCRs bound to canonical inverse agonists display electrostatic interactions (termed the ionic lock) between the positively charged arginine in the (E/D)RY motif and two negatively charged residues (Glu or Asp) (21, 22). In contrast, in high-resolution structures of GPCRs bound to canonical agonists these residues move apart such that the ionic lock appears to be disrupted (15, 21). Therefore, the (E/D)RY ionic lock has been proposed to stabilize conformations that suppress basal signaling (20). Consistent with this model, mutagenesis of the Glu/Asp residues that form the ionic lock typically results in constitutive (ligand-free) signaling from the GPCR (20, 23). However, mutagenesis of Arg ((E/D)RY) does not result in constitutive signaling from the GPCR (20). The paradoxical effect of Arg mutants has muddled the simple model of the (E/D)RY motif as an ionic lock. In this study, we use the SPASM sensors to show that mutagenesis of either Arg or Glu/Asp residues in the (E/D)RY motif of the β2-AR, enhances β2-AR interactions with Gs. However, only Glu/Asp but not Arg mutants increase constitutive GPCR signaling, consistent with our finding that the Arg mutant does not enhance G protein activation.
Opsin represents a notable exception to the function of the (E/D)RY motif because it has a second ionic lock formed by residue Lys-296 at the ligand-binding site (24). This second ionic lock is unique to opsin, which covalently binds to its ligand through the formation of a protonated Schiff-base at Lys-296 (25). We find that the Lys-296 ionic lock dominates the effect of the (E/D)RY motif, such that (E/D)RY mutants do not enhance ligand-free interactions with the G protein. In contrast, the intact (E/D)RY ionic lock in β2-AR is only observed in high-resolution structures obtained in the presence of inverse agonists that suppress its ligand-free activity (22). Here, we demonstrate that an intact (E/D)RY ionic lock is necessary for effective suppression of β2-AR basal signaling by the potent inverse agonist ICI 118,551.
Inverse agonist suppression of basal β2-AR signaling can be achieved either by reducing Gs or enhancing Gi activity. Thus, SPASM sensors were used to probe ligand-biased conformations of two β-adrenergic inverse agonists, ICI 118,551 and metoprolol (6, 26). We find that metoprolol but not ICI 118,551 stabilizes conformations that enhance interaction with Gi (Gi conformations). Distinction between Gs suppression and Gi activation is routinely achieved by treatment of cells with pertussis toxin (PTX), which covalently modifies Gi and prevents its coupling to the GPCR (27). PTX treatment has been previously used to uncover a Gi-mediated ERK signaling pathway initiated by β2-AR (6). However, PTX has not been used to examine G protein selection by ICI 118,551 and metoprolol. We find that stabilization of Gi conformations by metoprolol correlates with a PTX-sensitive suppression of cAMP accumulation for this compound. In contrast, cAMP suppression by ICI 118,551 is not PTX-sensitive. Taken together, this study validates a new technology to examine G protein-specific GPCR conformations in live cells, while providing new insights into the structure-to-function link for opsin and β2-AR.
EXPERIMENTAL PROCEDURES
Buffer and Reagents
9-cis-Retinal, (−)-isoproterenol (+)-bitartrate salt, ICI 118,551 hydrochloride, (+/−)-propranolol hydrochloride, (+/−)-metoprolol (+)-tartrate salt, forskolin, PTX, 3-isobutyl-1-methylxanthine, and poly-l-lysine were purchased from Sigma-Aldrich. Bovine retinal cDNA was acquired from Zyagen. Human β2-AR, Gαq, Gαi2, and long splice variant of human Gαs cDNA clones were obtained from Open Biosystems. Gαs (sc-823), Gαq (sc-393), and Gαi2 (sc-13534) antibodies were acquired from Santa Cruz Biotechnology. Buffer A is HEPES-buffered saline supplemented with 0.2% dextrose (w/v), 500 μm ascorbic acid, and 1.5 μg ml−1 aprotinin and 1.5 μg ml−1 leupeptin at pH 7.45.
Molecular Cloning
A modular cloning scheme was used to construct the different GPCR sensors. All GPCRs sensors were expressed as single polypeptides. Opsin and β2-AR were derived from PCR of bovine retinal cDNA and human cDNA, respectively. Briefly, GPCR (β2-AR or opsin), mCitrine (FRET acceptor), 10 nm ER/K α-helix, mCerulean (FRET donor), and Gα C terminus peptide/Gα were sequentially cloned between HindIII, XbaI, EcoRI, AscI, PacI, NotI restriction sites in the PCS2 vector. No-pep sensors did not contain peptide after mCerulean and instead had a repeating (Gly-Ser-Gly)4 residues. Constructs were then subcloned into the PCDNA5/FRT vector between HindIII and NotI. A (Gly-Ser-Gly)4 linker was inserted between all protein domains as part of the primer sequence to allow for free rotation between domains. An N-terminal HA tag was inserted in-frame to all β2-AR-sensors. All mutant constructs were generated via PCR using oligonucleotide-directed mutagenesis (QuikChange site-directed mutagenesis kit, Stratagene). Peptides encoded the last 27 C-terminal residues of the corresponding Gα. The following amino acid sequences were used: 1) t-mod, KQRNMLENLKDCGLF; 2) t-pep, DTQNVKFVFDAVTDIIIKENLKDCGLF; 3) s-pep, DTENIRRVFNDCRDIIQRMHLRQYELL; 4) i-pep, DTKNVQFVFDAVTDVIIKNNLKDCGLF; and 5) q-pep, DTENIRFVFAAVKDTILQLNLKEYNLV. All constructs were confirmed by sequencing. The wild-type sensors developed for this study, along with detailed plasmid maps to subclone other GPCRs, are available through the AddGene plasmid depository.
Sensor Protein Expression and Cell Preparation
HEK293T-Flp-in (Invitrogen) cells were cultured in DMEM supplemented with 10% FBS (v/v), 4.5 g/liter d-glucose, 1% Glutamax, 20 mm HEPES, pH 7.5 at 37 °C in humidified atmosphere at 5% CO2. HEK293T-Flp-in cells (passages 10–30) were plated into tissue culture-treated dishes at ∼30% confluence. Cells were allowed to adhere for 16–18 h followed by transient transfection of sensor plasmid DNA (pCDNA/FRT; Invitrogen) with FuGENE HD (Promega). Transfection conditions were optimized (2.5 μg of DNA + 8 μl of reagent) to reproducibly obtain primarily membrane expression of sensors 22–32-h post-transfection (evaluated at 40× magnification on a Nikon tissue culture microscope enabled with fluorescence detection). For each experiment, expression was quantified to ensure that at least 80% of cells expressed primarily plasma membrane-bound protein, without detectable localization of protein to intracellular compartments. At least 75% transfection efficiency (percentage of visibly fluorescent cells) was consistently achieved using this protocol. The length of transfection (22–32 h) was optimized for each sensor to maintain consistent expression levels (± 20% across experiments and sensors). Sensor expression was evaluated by fluorescence measurement at matched optical density of cell suspension. Cells were resupsended by gentle pipetting (no trypsin/EDTA treatment) and washed once with buffer A. Cells were resuspended at fixed density for all measurements (optical density (OD) of 0.3 (600 nm; 3 mm path length)). Sensor expression was evaluated from mCitrine fluorescence. Samples were excited in a 3-mm path length quartz cuvette with 490-nm bandpass 8-nm setting, and emission was collected from 500 to 600 nm (4-nm bandpass setting). mCitrine fluorescence was held within 2.6–3.8 × 10⁶ counts-per-second. For each sensor, both mCitrine fluorescence and percentage of membrane expression were recorded for each experiment to ensure consistency. Cells were maintained at 37 °C throughout the experiment (all buffers were prewarmed to 37 °C; the fluorometer cuvette holder was maintained at 37 °C), and the experiment was completed within 30 min of cell resuspension in buffer A (each FRET spectrum required ∼1 min of acquisition time). For opsin, cells were incubated in the presence or absence of 9-cis-retinal for 1 h at 37 °C in the dark in buffer A. Cells were exposed to ambient light for 1 min before recording FRET spectra. For β2-AR experiments involving ligands, cells were aliquoted (90 μl) and ligand-diluted in HBS buffer was added (10 μl). A matched aliquot with buffer A (10 μl) was used as a control to avoid repeated measurements of the same sample. Measurements of control and ligand-treated conditions were performed either alternately or within 5 min of each other (no measurable difference between procedures). Each agonist isoproterenol-treated aliquot was incubated for 3–5 min, whereas those treated with inverse agonists were incubated for 5–10 min before acquisition of spectra. Separate microcuvettes were used for control and treated samples to avoid cross-contamination.
FRET Measurements
FRET spectra were generated by exciting cells at 430 nm (spectral band pass, 8 nm), and scanning emission from 450–600 nm (band pass, 4 nm) on a FluoroMax-4 fluorometer (Horiba Scientific). For mCitrine-only measurements, cells were excited at 490 nm (band pass, 8 nm), and emission was recorded from 500–600 nm (band pass, 4 nm). Each experimental condition for β2-AR constructs was collected within 30 min of resuspension in buffer A at 37 °C.
Live Cell FRET Ratio Calculations
OD measurements were taken for untransfected and transfected cells in buffer A; appropriate volumes of media were added to achieve an A600 nm reading of 0.3 (Bio-Rad SmartSpec Plus Spectophotometer, 3-mm path length, quartz cuvette). FRET (mCerulean; excitation, 430 nm; emission, 450–600 nm) emission spectra were corrected for cell-scattering noise by subtracting spectra for untransfected HEK293 cell suspension from FRET emission spectra of transfected cells of matched cell density (OD). The corrected fluorescence emission spectra were then normalized to mCerulean emission (475 nm). FRET ratio was measured by calculating ratio of normalized emission of mCitrine (525 nm) to mCerulean (475 nm).
Quantification of cAMP Production
HEK293T-Flp-in cells were transiently transfected with HD-FuGENE (Promega) according to the manufacturer's instructions, and cAMP levels were assessed using the cAMP Glo luminescence based assay (Promega). Where indicated, 12 h after transfection, cells were incubated with 100 ng ml−1 PTX for 16 h. Briefly, 24–27 h post-transfection, cells were gently resuspended in DMEM containing 10% FBS (v/v), spun down and resuspended in PBS supplemented with 800 μm ascorbic acid and 0.02% glucose, and aliquoted into 96-well flat-bottomed opaque microplates. For assessment of basal cAMP levels, cells were incubated with 0.25 mm 3-isobutyl-1-methylxanthine/PBS for 20 min at 37 °C and exposed to 150 μm metoprolol, 10 μm ICI 118,551, or buffer control for an additional 15 min at 37 °C. For forskolin treatment, cells were incubated with 10 μm forskolin in the presence or absence of 150 μm metoprolol or 10 μm ICI 118,551 for 15 min at 37 °C. For isoproterenol treatment, cells were preincubated in the presence of absence of 150 μm metoprolol or 10 μm ICI 118,551 for 5 min and subsequently treated with 100 μm of isoproterenol for 3 min. After incubation with respective small molecules, cells were lysed, and protocol was followed according to manufacturer's instructions (Promega). Luminescence was measured using a microplate luminometer reader (Synergy 2, BioTek). cAMP production was normalized to the total amount of β2-AR sensor protein expressed as indicated by mCitrine fluorescence levels (excitation, 490 nm; emission, 525 nm).
Live Cell Microscopy and Image Analysis
Cells were imaged at 60× magnification using a Nikon TiE microscope equipped with a mercury arc lamp, 63× and 100× 1.4 numerical aperture plan-apo oil objectives and on an Evolve 512 × 512 EM charge-coupled device camera (Photometrics). Cells were imaged on 35-mm glass-bottomed dishes (MatTek Corp.) coated with 0.001% poly-l-lysine/PBS. 16 h after plating, cells on poly-l-lysine-coated MatTek plates, cells were transfected with Mirus-LT or HD-FuGENE (Promega). 18–24 h post-transfection, cells were washed multiple times with warm buffer A to remove excess phenol red from the media and were subsequently imaged in warm buffer A. Z-stack images were taken with 1-μm steps, and the resultant stack of images was deconvolved using AutoQuantX software.
Membrane Preparation
Membrane preparation follows a protocol modified from Clark et al. (28). HEK293 cells expressing indicated sensors were washed once with ice-cold PBS buffer. Cells were resuspended in an ice-cold hypotonic buffer (buffer B, 20 mm HEPES, pH 7.4, 0.5 mm EDTA, aprotinin (1.5 μg ml−1), leupeptin (1.5 μg ml−1), 0.1 mm DTT), incubated for 30 min (4 °C) on a rotator, and lysed with a FisherBrand rotary pestle for 30 s. Lysates were cleared by centrifugation (500 × g, 5 min), followed by pelleting of membranes (40,000 × g, 20 min). Membranes were washed once with buffer B, 3 μm GDP, 5 mm MgCl2 (10-s resuspension with rotary pestle), and respun at 40,000 × g for 20 min. Pellets were resuspended in identical buffer to a concentration of 0.5–1 mg/ml, aliquoted, and frozen at −80 °C. Total protein concentration (mg/ml) was calculated using a DC Protein Assay (Bio-Rad).
Protein Expression Levels
HEK293 cell membranes expressing β2-AR control or β2-AR-s-peptide sensors were collected 24 h post-transfection. Samples were treated with peptide N-glycosidase F and endoglycosidase H (3 h at room temperature) to remove β2-AR glycosylation sites. Supernatant- and pellet-containing membranes were separated on 4–15% gradient polyacrylamide/SDS gel. Concentration (mol/mg) of sensor was assessed by loading mCitrine concentration standards alongside a known concentration (mg/ml) of membranes expressing β2-AR control sensor on a SDS-PAGE. Gels were scanned for fluorescence on a Typhoon Gel Imager (GE Healthcare) by exciting mCitrine at 488 nm and scanned at 520 nm band pass 40.
Western Blotting
Membranes expressing the indicated sensors were prepared as described above. Briefly, membranes were separated on 10% polyacrylamide/SDS gels and scanned for fluorescence on a Typhoon Gel Imager (GE Healthcare) before being transferred to PVDF membranes for 3 h at 300 milliamperes. Blots were blocked with 5% milk/TBST for 1 h. Primary Gαs antibody (N-terminal; sc-823, Santa Cruz Biotechnology) or Gαq antibody (N-terminal; sc-393, Santa Cruz Biotechnology) were used at a concentration of 1:1000 in 1% milk/TBST. Primary Gαi antibody (sc-13534, Santa Cruz Biotechnology) was used at a concentration of 1:200 in 2% BSA/TBST. All antibodies were incubated overnight at 4 °C. Blots were washed with TBST (3 × 10 min) before addition of secondary antibody (goat anti-rabbit (Jackson ImmunoResearch Laboratories), 1:2000 in 1% milk/TBST) and incubated at room temperature for 1 h. Blots were washed again with TBST (3 × 10 min) and developed using Immobilon Western Chemiluminescent HRP substrate (Millipore). Blots were either imaged using film or using a ChemiDoc-it Imaging system (Ultraviolet Products) with no discernable difference in quality of signal.
Radioligand Assays
Radioligand assays followed previously published protocols (29). Bmax values were estimated by incubation of 2.5, 5, and 10 μg of membrane with 5 nm [3H]dihydroalprenolol ([3H]DHA; PerkinElmer Life Science) for 90 min at room temperature in Tris-buffered saline, pH 7.4. Samples were transferred to GF/C membranes pretreated with 0.3% polyethylenimine solution in TBS, washed extensively with TBS, treated with scintillation liquid (Microscint0; PerkinElmer Life Science), followed by measurement of radioactivity using a 96-well scintillation counter (TopCount, PerkinElmer Life Science). Nonspecific binding was estimated with 10 μm propranolol treatment and was <1% of total binding. Dissociation constant (Kd) of [3H]DHA binding was determined by incubation of 10 pm (10 fmol/ml) of receptor with increasing concentrations of [3H]DHA. Kd of [3H]DHA binding was ∼0.2 nm for wild-type, D130N, and R131A β2-AR-no-pep sensors. Competitive inhibition (Ki) was assessed by incubation of 10 pm of receptor with increasing concentrations of isoproterenol, ICI 118,551, or buffer blank with 5 nm [3H]DHA for 90 min at room temperature. Radioactivity in samples for Kd and Ki experiments was measured as described above. Nonspecific binding in all instances was found to be <1%. Each experiment was done at least twice with different membrane preparations, with three separate samples prepared per condition, per experiment.
[35S]GTPγS Binding Assays
Radiolabeled GTPγS assays follow previously published procedures (28, 30). Briefly, 60 fmol of wild-type or mutant (D130N or R131A) β2-AR-no-pep sensor expressing membranes (14–33 μg of membrane; receptor amounts determined by radioligand Bmax binding as described above) were incubated in buffer C (20 mm HEPES, pH 7.4, 100 mm NaCl, 5 mm MgCl2, 0.1 mm DTT, 100 μm GDP, 0.02% ascorbic acid) for 10 min at room temperature, followed by incubation with 10 μm ICI 118,551 or buffer control for 10 min. Membranes were treated with 1 nm [35S]GTPγS (PerkinElmer Life Science) for 60 min at room temperature, followed by assessment of membrane radioactivity levels as described above. GDP concentration and incubation times used were empirically determined to provide the largest specific binding to 14 μg of membrane expressing wild-type sensor (β2-AR-no-pep) relative to equal amount of untransfected membrane protein. Data are presented as difference between radioactivity counts (counts per minute) between untreated and ICI 118,551-treated membranes. The experiment was repeated three times, with different membrane preparations, and involves three separate samples in each experiment.
Statistical Analysis
Results are expressed as mean values ± standard error of the mean (S.E.) of at least three independent experiments with at least six repeats per condition. Statistical analysis was carried out using GraphPad Prism (version 5.0c, Graphpad Software, Inc.) Statistical significance was evaluated using Student's paired t tests with corresponding p values of *, p ≤ 0.05; **, p ≤ 0.01; ***, p ≤ 0.001. Briefly, statistical significance was calculated using Student's paired t test comparing samples to respective wild-type sensor (see “Experimental Procedures,” Molecular Cloning) for FRET ratio measurements or to matched untreated condition for ΔFRET measurements. Sigmoidal curves from concentration-response experiments were analyzed using non-linear regression curve fitting using log(agonist or inhibitor) versus response (three parameters). Each condition was repeated at least six times, and each experiment was independently conducted at least three times (n ≥ 18).
RESULTS
SPASM Sensor Expression and Receptor Function
SPASM sensors were developed for two prototypical GPCRs: β2-AR and opsin (Fig. 1a). Each SPASM sensor contains, from N to C terminus, a GPCR, mCitrine (FRET acceptor), ER/K linker, mCerulean (FRET donor), and a 27-amino acid peptide (x-pep; x denotes the type of Gα subunit; t, s, i, q; t-mod is a modified peptide that interacts with high affinity to activated rhodopsin (17)) derived from the α5-helix of the Gα C terminus (see “Experimental Procedures”). In addition, we developed sensors containing only the receptor (no-pep), which were used to measure background FRET, cAMP levels, ligand-binding affinities, and G protein activation. Intact sensor protein localized primarily at the plasma membrane (Fig. 1, b and c). β2-AR sensors display a functional response (cAMP) to agonist treatment (isoproterenol), which can be suppressed by the potent inverse agonist ICI 118,551 (Fig. 1d). Overexpression of β2-AR-no-pep sensors (500 ± 100 fmol/mg) resulted in a substantial increase in basal cAMP relative to untransfected control (Fig. 1d). The elevated basal cAMP levels for β2-AR are consistent with previously reported basal activity for this GPCR (31). The specificity of this signaling was evident in the reduction in cAMP levels following inverse agonist (metoprolol or ICI 118,551) treatment (Fig. 1d). For the consistent level of sensor expression (see “Experimental Procedures”) used throughout the study, sensors are expressed at least 5-fold in excess of endogenous Gαs, Gαi2, and Gαq (Fig. 2, a and b). Overexpression of Gα subunits (>5-fold) relative to untransfected levels does reduce the basal FRET in a Gα subtype specific-manner (Fig. 2, c and d).
FIGURE 1.

FRET-based SPASM sensors for opsin and β2-AR are intact and functional. a, schematics of the GPCR-Gα C-terminal peptide sensors (left), sensor in the inactive (middle), and active (right) conformation. Protein domains were separated with Gly-Ser-Gly (GSG)4 linkers to ensure rotational freedom. No-pep sensors do not contain the Gα C terminus peptide. b, opsin-t-mod and β2-AR-s-pep sensor localization to the plasma membrane in HEK293 live cells. c, fluorescence SDS-PAGE gel scans of HEK293 membranes expressing β2-AR no-pep or s-pep sensors. Intact membrane localization is witnessed by distinct 110 kDa bands in fractions containing membrane (P) but not supernatant (S). d, cAMP levels in the presence or absence of agonist (100 μm isoproterenol) for untransfected (gray) or HEK293 cells expressing β2-AR-no-pep sensor (white). Specificity of agonist-stimulated sensor response was verified by suppression with antagonists (150 μm metoprolol or 10 μm ICI 118,551). Results are expressed as mean ± S.E. ***, p < 0.001; n > 10. mCit, mCitrine; mCer, mCerulean; ISO, isoproterenol.
FIGURE 2.

Influence of endogenous Gα levels on sensor FRET measurements. a and b, β2-AR sensors are expressed at least 5-fold in excess of three endogenous Gα subtypes (Gαs/Gαi/Gαq). a, fluorescence SDS-PAGE gel scans of HEK293 membranes expressing β2-AR-Gαs fusion sensor. b, HEK293 membranes expressing the β2-AR-Gα fusion sensors were digested with tobacco etch virus protease to cleave a site between β2-AR-mCitrine and ER/K-α-helix-mCerulean-Gα. Membranes were separated by SDS-PAGE, transferred onto PVDF membranes, and probed with anti-Gαs (sc-823; 1:1000), anti-Gαq antibody (sc-393; 1:1000), or anti-Gαi2 antibody (sc-13534; 1:200). Intact Gα expression is witnessed by distinct 80, 76, and 75 kDa bands for tobacco etch virus-digested Gαs, Gαq, and Gαi2 fusion sensors, respectively. c and d, FRET ratios (mCitrine, 525 nm; mCerulean, 475 nm) of the β2-AR-s-pep sensor co-expressed with unlabeled (dark) Gαs (c) or Gαq (d). Ratio of plasmid DNA of β2-AR-s-pep:Gα used for the transfections is indicated along abscissa (at least 5-fold overexpression of indicated Gα compared with endogenous Gα by densitometry). Bottom panels, immunoblots of membranes transfected with plasmid DNA at indicated ratios probed with anti-Gαs (c) or anti-Gαq antibodies (d). S, supernatant; P, membrane.
Validation of SPASM Sensor Response
The SPASM sensors are designed for FRET-based detection of ligand/mutagenesis-induced stabilization of GPCR conformations that favor interactions with different G proteins (Fig. 3a) (10). Several studies have shown that peptides derived from the Gα C terminus interact with the GPCR following stimulation with canonical agonists (11–13). Furthermore, the ligand-stimulated GPCR preferentially interacts with the Gα C terminus that it signals through (18, 19). Accordingly, activation of opsin (9-cis-retinal + light) results in a greater FRET gain (ΔFRET ratio) for the opsin-t-pep compared with the opsin-s-pep sensor (Fig. 3b). The opsin-t-mod sensor uses the previously identified modified t-peptide that binds with a higher affinity than native t-pep and correspondingly shows a larger ΔFRET ratio compared with the other sensors (Fig. 3b). Given that FRET-based detection involves excitation of the sample with light (430 nm) that photoisomerizes 9-cis-retinal (< 600 nm), resulting in the activation of dark rhodopsin, the ΔFRET ratios presented here compare ligand-free opsin with light-activated rhodopsin (metarhodopsin (14)). In contrast, agonist (isoproterenol) stimulation results in enhanced FRET for β2-AR-s-pep but not for the t-pep, i-pep, or q-pep sensors (sample spectra, Fig. 3, c and d; compiled data, Fig. 3e). This is in accordance with the canonical coupling of β2-AR to Gs following activation (Fig. 1d). We note that the Gα C terminus peptides used in this study are 27 amino acids long, essentially encompassing the entire α5-helix of the Gα subunit (12). This length of peptide was selected to potentially preserve their helical structure. Regardless of peptide length, the FRET gain for the β2-AR-s-pep sensor is preserved for three different length native peptides (Fig. 3e (inset); s11, s17, and s-pep contain, respectively, the last 11, 17, and 27 amino acids of the Gα C terminus; x-pep (Fig. 3a) contains the last 27 amino acids of the Gαx C terminus). This result is consistent with the involvement of only the last 11 amino acids in the GPCR-G-protein binding interface (11). Specificity in the FRET gain is further evident in the concentration dependence of the isoproterenol response (Fig. 3f). The FRET gain at saturating isoproterenol concentrations (100 μm) can be competitively suppressed by the potent inverse agonist ICI 118,551 (Fig. 3f). As an alternative to agonist activation, the FRET levels in sensors expressing constitutively activating mutations, CAM and L272A (see “Experimental Procedures”), were also examined (32, 33). Introducing either set of mutations in β2-AR-no-pep resulted in over a 2-fold increase in basal (ligand-free) cAMP accumulation, attesting to the stabilization of Gs conformations of this GPCR (Fig. 3g). Correspondingly, mutant versions of the β2-AR-s-pep sensors showed significantly elevated FRET levels compared with their wild-type counterparts (sample spectra Fig. 3h; compiled data Fig. 3i). None of the β2-AR mutants in this study alter background (β2-AR-no-pep) FRET levels (data not shown). The FRET ratio is an ensemble measurement of ∼5000 cells in the excitation volume of the fluorometer cuvette (based on measured A600 nm of cell suspension of 0.3 for 3-mm path length). Hence, unlike fluorescence microscopy-based FRET evaluation in individual cells, the FRET ratio represents a bulk measurement that averages over potential heterogeneity across the population of cultured cells. Hence, despite the small changes in FRET, the differences in the measured FRET response are reproducible (Fig. 3, c, d, and h) and statistically significant (Fig. 3, b, e, and i), with a finite spread in the distribution of measurements both within and across experiments (Fig. 3j).
FIGURE 3.
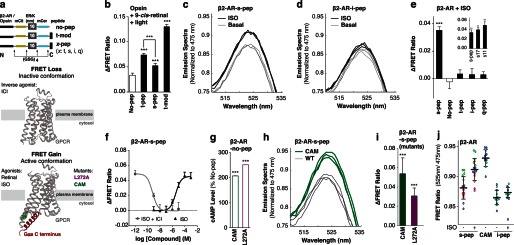
Gα C terminus peptide specifically binds to the active conformation of GPCRs in live HEK293 cells. a, schematics of the GPCR-Gα C-terminal peptide sensors (top); crystal structures of β2-AR in the inactive (middle; PDB code 3NY8) and active (bottom; PDB code 3SN6) conformation. The Gαs C terminus (s-pep; red) binds to the active β2-AR conformation induced via stimulation with agonist. b–j, GPCR condition specified at the top left and sensor abbreviation along abscissa. b, change in FRET ratio following agonist (9-cis-retinal + light) treatment for opsin-pep sensors. FRET spectra (mCerulean (mCer) excitation, 430 nm) normalized to mCerulean emission (475 nm) for β2-AR-s-pep (c), β2-AR-i-pep sensors for samples treated with or without agonist (isoproterenol) (d). e and f, change in FRET ratio following agonist (isoproterenol; ISO) treatment for β2-AR-pep sensors. f, dose-dependent inhibition of FRET with inverse agonist (ICI 118,551 (ICI); gray line). g, basal cAMP levels for β2-AR-no-pep sensors expressing the constitutively active β2-AR mutants (CAM, L272A). h, FRET spectra (mCerulean excitation, 430 nm) normalized to mCerulean emission (475 nm) for WT (black) and a constitutively active mutant (CAM; green) β2-AR-s-pep sensor. i, gain in FRET following induction of constitutively active mutations (CAM, L272A) for β2-AR-s-pep sensors. j, scatter plot of individual FRET ratio measurements (open circles) for indicated β2-AR-pep sensors/conditions derived from three independent experiments (colored red, green, and blue), collected on three different days. Results are expressed as mean ± S.E. ***, p < 0.001; n > 18.
Linking (E/D)RY Motif to Receptor Conformation (β2-AR Versus Opsin)
High-resolution structures of β2-AR bound to inverse agonist (Fig. 4a; top panel) display electrostatic interactions between Arg-131 ((E/D)RY) and both Asp-130 ((E/D)RY) and Glu-268 (22). In contrast, these interactions appear significantly weaker following agonist stimulation (Fig. 4a, bottom panel) (15). Although there is a correlation between the (E/D)RY ionic interactions and GPCR conformation, a causative connection between them has not been established. The D130N mutant does show enhanced basal signaling, suggesting the need for these interactions to suppress basal activity (Fig. 4b). However, the controversy is evidenced by the absence of enhanced downstream signaling upon mutagenesis of the Arg-131 (R131A; Fig. 4b), despite it being essential to form the ionic interactions. The R131A mutant is also deficient in providing an agonist-stimulated functional response (Fig. 4c). β2-AR-s-pep sensors provide evidence for stabilization of Gs conformations following mutagenesis of any of the residues (D130N, R131A, E268N) that form the ionic interactions, and the phenotype is compounded by a double-mutant (D130N,E268N; D/E; Fig. 4d). The basal stabilization of Gs conformations is also evident in the absence of further FRET gain following stimulation with isoproterenol (Fig. 4e). Both D130N and R131A mutants are capable of binding isoproterenol as witnessed by competitive inhibition of [3H]DHA binding to the receptor in the β2-AR-no-pep sensor (Fig. 4f). In fact, affinity of isoproterenol binding is substantially enhanced for both D130N and R131A mutants compared with wild-type (Ki ∼ 335 nm for wild-type; Ki ∼ 8 nm for D130N; Ki ∼ 20 nm for R131A). These results are consistent with a conformational change in β2-AR, upon mutagenesis of either Asp-130 or Arg-131, that mimics the effect of G protein binding, leading to ternary complex formation (34). However, only the D130N but not the R131A mutant enhances G protein activation as witnessed by enhanced basal [35S]GTPγS uptake (Fig. 4g). Basal [35S]GTPγS uptake is measured as the difference in scintillation counts (counts per minute) between basal and ICI 118,551 (10 μm) inhibited conditions for 62 fmol of receptor per condition (wild-type/mutant; see “Experimental Procedures”). This measurement facilitates comparison of specific [35S]GTPγS uptake resulting from equal amounts of the wild-type receptor, without the complication of varying levels of nonspecific [35S]GTPγS binding caused by differential expression of wild-type and mutant sensors. Importantly, the affinity of ICI 118,551 binding is similar between wild-type, D130N, and R131A mutant receptors (Ki ∼ 0.1 nm; Fig. 4h). Taken together, these complementary approaches dissect the molecular basis for differential signaling from Glu/Asp and Arg mutants. Although both Glu/Asp and Arg mutants cause conformational changes in β2-AR that enhances G protein interactions, only Glu/Asp but not Arg mutants increase G protein activation.
FIGURE 4.
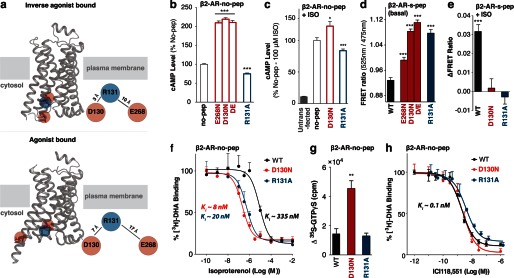
Mutagenesis of (E/D)RY motif interactions in β2-AR induces an active conformation. a, crystal structures of β2-AR in the inactive (top; PDB code 3NY8) and active (bottom; PDB code 3SN6) conformation. Top, in the inactive state, the DRY motif residues in β2-AR display electrostatic interactions formed between Arg-131 (blue) and Asp-130/Glu-268 residues (red). Bottom, indicated residues move apart following β2-AR activation. b–e, GPCR/condition specified at the top left, and sensor abbreviations are shown along the abscissa. cAMP levels of HEK293 cells expressing wild-type (no-pep) for the indicated (E/D)RY mutant β2-AR-no-pep sensor in the absence (b) or presence (c) of agonist (100 μm isoproterenol (ISO)). d, FRET ratios (mCitrine/mCerulean, 525 nm/475 nm) of β2-AR (E/D)RY motif single and double (D/E, D130N,E268N) mutant s-pep sensors. e, change in FRET following agonist (100 μm isoproterenol) treatment of (E/D)RY mutant β2-AR-s-pep sensors. f, the affinity for agonist (isoproterenol) was measured for WT, D130N, and R131A β2-AR-no-pep sensors by competitive inhibition of [3H]DHA binding. Results are expressed as percent of radioligand bound in the absence of competitor. g, change in [35S]GTPγS binding induced by 10 μm inverse agonist ICI 118,551 for WT, D130N, and R131A β2-AR-no-pep sensors. h, competitive displacement of [3H]dihydroalprenolol binding by ICI 118,551 for WT, D130N, and R131A β2-AR-no-pep sensors. Results are expressed as mean ± S.E. of three independent experiments performed in triplicate. *, p < 0.05; ***, p < 0.001; n > 18.
In contrast, mutagenesis of either of the residues (E134N (ED/RY), R135A ((E/D)RY) or E247N; Fig. 5a) implicated in similar ionic interactions for opsin (35) does not alter basal (ligand-free) FRET levels (Fig. 5b). Activation of opsin (9-cis-retinal + light) provides a substantial FRET gain for E247N and E134N but not R135A (Fig. 5c). Thus, the (E/D)RY motif interactions do not appear to be necessary for stabilization of the basal state in opsin. These results are not surprising, given a second prominent set of opsin-specific ionic interactions that are also important for binding of retinal (Lys-296, Glu-113; Fig. 5d) (24). Mutagenesis of either of these residues (K296A, K296G, K296E or E113Q) substantially elevates basal FRET levels (Fig. 5e). Presentation of counter ions to Lys-296 by mutagenesis of Ala-292 (A292E) but not Gly-90 (G90D) (24), also enhances basal FRET (Fig. 5e). Thus, the ionic interactions centered on Lys-296 are necessary and sufficient to stabilize opsin in its basal state. Opsin stimulation (9-cis-retinal + light) results in a substantial FRET gain for wild-type, G90D, A292E, and E113Q but not for K296A, K296E or K296G (Fig. 5f). The latter result is consistent with the need for the Lys-296 residue for binding retinal (25).
FIGURE 5.

Opsin-specific interactions centered on residue Lys-296 are both necessary and sufficient to stabilize an inactive conformation. a, electrostatic interactions formed by the (E/D)RY motif are indicated on the crystal structure of inactive, dark rhodopsin (opsin + 9-cis-retinal; PDB code 1GZM). b–f, GPCR condition specified at top left, and sensor abbreviations are specified along abscissa. b and c, FRET ratios (mCitrine/mCerulean, 525 nm/475 nm) of basal (b, untreated) and change in FRET (c) following retinal addition and photo-activation of the (E/D)RY motif mutant t-mod sensors of opsin. d, RP inducing constitutively active opsin mutations and their interactions are indicated in the inactive dark rhodopsin crystal structure (PDB code 1GZM). e, FRET ratios of RP mutant opsin-t-mod sensors in the absence of retinal. f, change in FRET following retinal addition and photoactivation of sensors in e. Results are expressed as mean ± S.E. **, p < 0.01; ***, p < 0.001; n > 18.
Inverse Agonism of β2-AR Requires a Functional (E/D)RY Motif
High-resolution structures of the receptor bound to inverse agonists display an intact ionic lock (Fig. 6a) (21, 22). This suggests that the inverse agonist stabilizes the ionic lock; however, a causative mechanism remains to be established. To test this connection, the effects of the inverse agonist ICI 118,551 on β2-AR-s-pep sensors were examined in the context of WT and (E/D)RY motif mutants. Sensors with a single counter-ion (E268N or D130N) mutation showed sensitivity to ICI 118,551 (suppression of cAMP and decreased FRET; Fig. 6, b and c), whereas a double mutant that abolishes the ionic lock (D130N,E268N) showed a reversal of FRET response with minimal suppression of constitutive activity (Fig. 6, b and c). Together, these results suggest that the function of inverse agonist ICI 118,551 requires an intact (E/D)RY motif. In contrast, the inverse agonist metoprolol does not affect the FRET levels for the D130N mutant (Fig. 6b). This suggests that inverse agonism of metoprolol is distinct from that of ICI 118,551.
FIGURE 6.

Inverse agonist ICI 118,551 requires a functional (E/D)RY motif to suppress β2-AR basal activity. a, electrostatic interactions formed by the (E/D)RY motif are indicated on the crystal structure of β2-AR bound to inverse agonist (ICI 118,551; ICI) (PDB code 3NY8). b, change in FRET following inverse agonists (10 μm ICI 118,551 or 150 μm metoprolol (Meto)) treatment of indicated (E/D)RY motif mutant β2-AR-s-pep sensors. c, ICI 118,551 induced percent cAMP inhibition of HEK293 cells expressing wild-type (no-pep) or the indicated (E/D)RY motif mutant β2-AR-no-pep sensors. Results are expressed as mean ± S.E. *, p < 0.05; **, p < 0.01; ***, p < 0.001; n > 18.
Metoprolol Stabilizes Gi Conformations
Inverse agonist suppression of basal cAMP signaling can be achieved by reducing Gs activity or enhancing Gi. Although a previous study has demonstrated that metoprolol suppresses cAMP accumulation, it did not distinguish between effects on Gs and Gi (26). Metoprolol (150 μm) decreases FRET levels for the β2-AR-s-pep sensor, while elevating FRET levels for the β2-AR-i-pep sensor in a dose-dependent manner (Fig. 7, a and b). Thus, metoprolol appears to stabilize Gi conformations at the expense of those that promote interactions with Gs. To test whether the Gi conformations precipitates a Gi-dependent response, we examined the PTX sensitivity of the forskolin response (10 μm). Metoprolol inhibition of cAMP accumulation was sensitive to PTX treatment, a characteristic of Gi stimulation induced by a receptor-ligand combination (Fig. 7c) (36). In contrast, saturating concentrations of ICI 118,551 (10 μm) did not alter basal FRET levels for either the β2-AR-s-pep or β2-AR-i-pep sensors. Further, ICI 118,551 inhibition of cAMP accumulation is not PTX-sensitive (Fig. 7, a and c). Together, these results suggest that metoprolol stabilizes Gi conformations in β2-AR, which in turn enhance coupling to Gi.
FIGURE 7.

Sensors detect stabilization of Gi conformations in β2-AR stimulated with metoprolol. Shown is the change in FRET following treatment of indicated β2-AR-pep sensors with inverse agonist (150 μm metoprolol (Meto)) (a) or with varying concentrations of metoprolol (b). c, percent inhibition of 100 μm isoproterenol (ISO) or 10 μm forskolin-induced (Fsk) cAMP levels with 150 μm metoprolol or 10 μm ICI 118,551, in PTX-treated or untreated HEK293T cells expressing β2-AR-no-pep sensor. Results are expressed as mean ± S.E. *, p < 0.05; **, p < 0.01; ***, p < 0.001; n >18.
DISCUSSION
Detecting the Stabilization of G Protein-specific Conformations of a GPCR
The phenomenon of functional selectivity, wherein the same GPCR can signal through multiple effectors (G proteins/arrestin) is well established (8). The emerging view in the field suggests that GPCRs exist in a continuum of conformations with certain subsets more or less favorable for interactions with one or more effectors (1). Ligands stabilize non-identical subsets of GPCR conformations leading to their traditional classification as agonists, partial agonists, antagonists, inverse agonists, and biased agonists (7). Recent structural studies have detected ligand-specific stabilization of β2-AR conformations (2–5) but do not directly link them to function in the absence of documented functional responses in cell or membrane preparations (6, 26, 37). Given the wide range of factors that influence the functional response, there is a need for complementary tools that can detect the stabilization of G protein-selective conformations (9).
A well characterized determinant of G protein selection is the C terminus of the Gα subunit (18, 19). The Gα subunit inserts itself into a cytosolic groove formed in the activated GPCR (14, 15). Hence, we hypothesized that peptides derived from the Gα C terminus could be used as “bait” to detect G protein-selective conformations of a GPCR. Sensors developed using the SPASM technique (10) detect ligand/mutagenic stabilization of GPCR conformations that result in changes in interaction with one or more G protein peptides. The enhanced G protein interactions can result in enhanced downstream signaling. However, the conformational states detected by the sensor are not necessarily identical to those that trigger G protein activation. Hence, sensor readout needs to be verified using complementary approaches such as examination of second messenger levels, ligand-binding affinities (evaluates ternary complex formation) and G protein activation.
In this study, we show that β2-AR, a GPCR that has been proposed to signal through both Gs (canonical) and Gi (37, 38), displays ligand-dependent conformations that promote interactions with Gs and/or Gi (Gs and Gi conformations). Although the classic agonist isoproterenol stabilizes Gs conformations, the inverse agonist metoprolol stabilizes Gi conformations (Fig. 8). Ligand-free β2-AR is known to stimulate cAMP accumulation and several inverse agonists reduce this basal activity (26, 31). Given that cAMP accumulation is regulated by both Gs and Gi, it remains to be established whether inverse agonists suppress Gs and/or activate Gi. Thus, PTX treatment was used to uncover a new Gi-dependent activity for metoprolol but not ICI 118,551. Accordingly, only metoprolol but not ICI 118,551 stabilizes Gi conformations. Together, these studies support the presence of Gs and Gi conformations of β2-AR that can be stabilized in a ligand-dependent manner.
FIGURE 8.

Distinct structural mechanisms of β2-AR agonists and inverse agonists. In the absence of ligand (basal state), only a small proportion of the β2-AR population adopts Gs conformations. Isoproterenol (ISO; agonist) treatment destabilizes the DRY ionic lock and enhances interaction with the Gαs C terminus, resulting in activation of adenylyl cyclase. Conversely, ICI 118,551 (ICI; inverse agonist), reinforces the DRY ionic lock, and shifts the equilibrium toward inactive conformations. Biased agonist (metoprolol; Meto) stabilizes Gi conformations, promoting Gi-dependent inhibition of adenylyl cyclase. mCit, mCitrine; mCer, mCerulean.
What Is the Role of the (E/D)RY Motif in GPCR Conformation?
High-resolution structures of GPCRs stabilized bound to inverse agonists show strong electrostatic interactions centered on residues in the conserved (E/D)RY motif (22, 39). In contrast, these residues move apart in structures of GPCRs activated with agonist (14, 15). This has led to the model that the (E/D)RY ionic interactions (ionic lock) are required to stabilize GPCRs in an inactive state (20, 21). Although structural studies support this model, they have not established cause and effect between ionic lock stabilization and GPCR inactivation. This model posits that disrupting the ionic lock would be sufficient to transition the GPCR to an active conformation, resulting in constitutive (ligand-free) activity (20). However, mutation of the acidic (Glu/Asp) but not basic (Arg) residues enhances basal activity of the GPCR as measured from the downstream functional response (cAMP) (20, 40). Therefore, functional studies have not resolved the role of the (E/D)RY ionic lock in GPCR conformation. In this study, the SPASM sensors were used to decouple conformational changes in the GPCR (as detected by Gα C terminus peptide binding) from the downstream response (cAMP) to show that for β2-AR, mutagenesis of either of the residues that form the ionic lock is sufficient to enhance interactions with Gs. However, Arg mutants do not show enhanced cAMP accumulation, in line with our finding that they do not enhance G protein activation. Opsin is a notable exception to the role of the (E/D)RY motif, in that it has a second, unique, ionic lock centered residue Lys-296 at the ligand-binding interface (24). We find that mutagenesis of the Lys-296 ionic lock but not the one formed by the (E/D)RY motif is sufficient to transition this GPCR to an active conformation. Thus, although the role of the (E/D)RY motif continues to be receptor-specific, the use of the SPASM sensors complemented with traditional approaches allows us to directly examine the role of intramolecular interactions on GPCR conformation.
Severity of Disease Phenotype Correlates with Stabilization of a GPCR Active Conformation
Retinitis pigmentosa (RP) affects 1 in 4000 of the general population with symptoms ranging from night blindness to complete loss of eyesight (41). More than 25% of autosomal dominant RP patients have a single point mutation in opsin, with >120 mutations documented to date (42). A subset of RP mutations constitutively activates opsin by perturbing the Lys-296–Glu-113 ionic interaction within this receptor (24, 43). The effects of these mutations on opsin function have been inferred primarily by examining signaling downstream of transducin (Gαt), such that the molecular mechanisms translating these mutations to differential disease phenotype remain poorly understood (43). Mutation of residue Lys-296 (K296A, K296E, or K296G) leads to severe RP, causing blindness (24). Mutations that introduce a destabilizing counter ion to Lys-296 (G90D or A292E) instead lead to mild RP, resulting in night blindness (24). We report that most of these mutations (with the exception of G90D) increase the strength of interaction of opsin for a peptide derived from the transducin C terminus. Our finding is in line with the current model of constitutive activation of opsin in RP (24, 43). Importantly, the gain in basal affinity directly correlates with the reported severity of RP phenotype (K296G/K296A > K296E > A292E > G90D). Hence, our results support a model wherein in the absence of retinal, the Lys-296 mutation enhances opsin interaction with transducin (24, 44). In contrast, the counter-ion mutants only partially populate an active conformation in the basal state and need a combination of retinal and light for full activity.
Distinct Mechanisms for Different Inverse Agonists
The basal activity of β2-AR suggests that it samples both active and inactive states in the absence of ligand (31). Therefore, it is not surprising that high-resolution structures of β2-AR with an intact (E/D)RY ionic lock have all been obtained in the presence of ligands that suppress basal signaling (inverse agonists) (22). Although these structures suggest a connection between inverse agonists and the (E/D)RY motif, it remains to be established whether the ionic lock is necessary for inverse agonist function. Here, we find that efficient suppression of β2-AR basal activity by the potent inverse agonist, ICI 118,551, is dependent on the integrity of the (E/D)RY ionic lock. Disruption of the ionic interactions formed by the (E/D)RY motif reduces ICI 118,551 ability to suppress β2-AR basal signaling. In contrast, metoprolol suppresses basal activity by enhancing β2-AR interactions with Gi, rather than stabilizing the (E/D)RY ionic lock. The distinct mechanisms of inverse agonism for metoprolol and ICI 118,551, along with the tools developed here to detect the relative stabilization of G protein selective receptor conformations need to be factored into the identification and selection of inhibitors that target GPCR function.
SPASM Sensor Toolbox
This study uses the recently developed technique termed SPASM to directly detect the interaction between a GPCR and native peptides derived from the C terminus of the Gα subunit. The specificity of the FRET response is validated with two prototypical GPCRs, β2-AR and opsin, which show selectively enhanced interaction for the C terminus of Gαs and Gαt (transducin) respectively, following GPCR activation (opsin, 9-cis-retinal + light; β2-AR, isoproterenol). Furthermore, as expected, constitutively active mutants of both GPCRs display enhanced interactions relative to their wild-type counterparts. The enhanced FRET with agonist is dose-dependent and can be competitively inhibited with an inverse agonist. The FRET measurements of the sensor can be influenced by competition with endogenous G proteins. However, the consistent levels of sensor expression (±20%) used throughout the study, along with the tools to measure expression relative to endogenous Gα subtypes factors in the effects of endogenous G proteins.
The functional significance of Gi conformations mediated by metoprolol is verified by a standard PTX sensitivity assay. The studies with the (E/D)RY motif and the opsin Lys-296 ionic lock support existing models for their function, while providing much needed clarity on their influence in stabilizing GPCR conformations. Therefore, taken together, this study is a first defined step toward the use of these sensors to broadly examine G protein-selective GPCR conformations.
Acknowledgments
We thank J. Tesmer and B. Allen for helpful discussions and manuscript review.
This work was supported by American Heart Association National Scientist Development Grant 13SDG14270009 and McKay award (to S. S.) and the Rackham Merit fellowship (to R. U. M.).
- GPCR
- G protein-coupled receptor
- SPASM
- systematic protein affinity strength modulation
- β2-AR
- β2 adrenergic receptor
- PTX
- pertussis toxin
- [3H]DHA
- [3H]dihydroalprenolol
- RP
- retinitis pigmentosa
- PDB
- Protein Data Bank.
REFERENCES
- 1. Bockenhauer S., Fürstenberg A., Yao X. J., Kobilka B. K., Moerner W. E. (2011) Conformational dynamics of single G protein-coupled receptors in solution. J. Phys. Chem. B 115, 13328–13338 [DOI] [PMC free article] [PubMed] [Google Scholar]
- 2. Liu J. J., Horst R., Katritch V., Stevens R. C., Wüthrich K. (2012) Biased signaling pathways in β2-adrenergic receptor characterized by 19F-NMR. Science 335, 1106–1110 [DOI] [PMC free article] [PubMed] [Google Scholar]
- 3. Kahsai A. W., Xiao K., Rajagopal S., Ahn S., Shukla A. K., Sun J., Oas T. G., Lefkowitz R. J. (2011) Multiple ligand-specific conformations of the β2-adrenergic receptor. Nat. Chem. Biol. 7, 692–700 [DOI] [PMC free article] [PubMed] [Google Scholar]
- 4. Vilardaga J. P., Steinmeyer R., Harms G. S., Lohse M. J. (2005) Molecular basis of inverse agonism in a G protein-coupled receptor. Nat. Chem. Biol. 1, 25–28 [DOI] [PubMed] [Google Scholar]
- 5. Yao X. J., Vélez Ruiz G., Whorton M. R., Rasmussen S. G., DeVree B. T., Deupi X., Sunahara R. K., Kobilka B. (2009) The effect of ligand efficacy on the formation and stability of a GPCR-G protein complex. Proc. Natl. Acad. Sci. U.S.A. 106, 9501–9506 [DOI] [PMC free article] [PubMed] [Google Scholar]
- 6. Azzi M., Charest P. G., Angers S., Rousseau G., Kohout T., Bouvier M., Piñeyro G. (2003) β-arrestin-mediated activation of MAPK by inverse agonists reveals distinct active conformations for G protein-coupled receptors. Proc. Natl. Acad. Sci. U.S.A. 100, 11406–11411 [DOI] [PMC free article] [PubMed] [Google Scholar]
- 7. Granier S., Kobilka B. (2012) A new era of GPCR structural and chemical biology. Nat. Chem. Biol. 8, 670–673 [DOI] [PMC free article] [PubMed] [Google Scholar]
- 8. Urban J. D., Clarke W. P., von Zastrow M., Nichols D. E., Kobilka B., Weinstein H., Javitch J. A., Roth B. L., Christopoulos A., Sexton P. M., Miller K. J., Spedding M., Mailman R. B. (2007) Functional selectivity and classical concepts of quantitative pharmacology. J. Pharmacol. Exp. Ther. 320, 1–13 [DOI] [PubMed] [Google Scholar]
- 9. Onaran H. O., Costa T. (2012) Where have all the active receptor states gone? Nat. Chem. Biol. 8, 674–677 [DOI] [PubMed] [Google Scholar]
- 10. Sivaramakrishnan S., Spudich J. A. (2011) Systematic control of protein interaction using a modular ER/K α-helix linker. Proc. Natl. Acad. Sci. U.S.A. 108, 20467–20472 [DOI] [PMC free article] [PubMed] [Google Scholar]
- 11. Hamm H. E., Deretic D., Arendt A., Hargrave P. A., Koenig B., Hofmann K. P. (1988) Site of G protein binding to rhodopsin mapped with synthetic peptides from the α subunit. Science 241, 832–835 [DOI] [PubMed] [Google Scholar]
- 12. Oldham W. M., Hamm H. E. (2008) Heterotrimeric G protein activation by G-protein-coupled receptors. Nat. Rev. Mol. Cell Biol. 9, 60–71 [DOI] [PubMed] [Google Scholar]
- 13. Rasenick M. M., Watanabe M., Lazarevic M. B., Hatta S., Hamm H. E. (1994) Synthetic peptides as probes for G protein function. Carboxyl-terminal G α s peptides mimic Gs and evoke high affinity agonist binding to beta-adrenergic receptors. J. Biol. Chem. 269, 21519–21525 [PubMed] [Google Scholar]
- 14. Choe H. W., Kim Y. J., Park J. H., Morizumi T., Pai E. F., Krauss N., Hofmann K. P., Scheerer P., Ernst O. P. (2011) Crystal structure of metarhodopsin II. Nature 471, 651–655 [DOI] [PubMed] [Google Scholar]
- 15. Rasmussen S. G., DeVree B. T., Zou Y., Kruse A. C., Chung K. Y., Kobilka T. S., Thian F. S., Chae P. S., Pardon E., Calinski D., Mathiesen J. M., Shah S. T., Lyons J. A., Caffrey M., Gellman S. H., Steyaert J., Skiniotis G., Weis W. I., Sunahara R. K., Kobilka B. K. (2011) Crystal structure of the β2 adrenergic receptor-Gs protein complex. Nature 477, 549–555 [DOI] [PMC free article] [PubMed] [Google Scholar]
- 16. Chung K. Y., Rasmussen S. G., Liu T., Li S., DeVree B. T., Chae P. S., Calinski D., Kobilka B. K., Woods V. L., Jr., Sunahara R. K. (2011) Conformational changes in the G protein Gs induced by the β2 adrenergic receptor. Nature 477, 611–615 [DOI] [PMC free article] [PubMed] [Google Scholar]
- 17. Martin E. L., Rens-Domiano S., Schatz P. J., Hamm H. E. (1996) Potent peptide analogues of a G protein receptor-binding region obtained with a combinatorial library. J. Biol. Chem. 271, 361–366 [DOI] [PubMed] [Google Scholar]
- 18. Conklin B. R., Farfel Z., Lustig K. D., Julius D., Bourne H. R. (1993) Substitution of three amino acids switches receptor specificity of Gq α to that of Gi α. Nature 363, 274–276 [DOI] [PubMed] [Google Scholar]
- 19. Conklin B. R., Herzmark P., Ishida S., Voyno-Yasenetskaya T. A., Sun Y., Farfel Z., Bourne H. R. (1996) Carboxyl-terminal mutations of Gq α and Gs α that alter the fidelity of receptor activation. Mol. Pharmacol. 50, 885–890 [PubMed] [Google Scholar]
- 20. Rovati G. E., Capra V., Neubig R. R. (2007) The highly conserved DRY motif of class A G protein-coupled receptors: beyond the ground state. Mol. Pharmacol. 71, 959–964 [DOI] [PubMed] [Google Scholar]
- 21. Hofmann K. P., Scheerer P., Hildebrand P. W., Choe H. W., Park J. H., Heck M., Ernst O. P. (2009) A G protein-coupled receptor at work: the rhodopsin model. Trends Biochem. Sci. 34, 540–552 [DOI] [PubMed] [Google Scholar]
- 22. Wacker D., Fenalti G., Brown M. A., Katritch V., Abagyan R., Cherezov V., Stevens R. C. (2010) Conserved binding mode of human β2 adrenergic receptor inverse agonists and antagonist revealed by X-ray crystallography. J. Am. Chem. Soc. 132, 11443–11445 [DOI] [PMC free article] [PubMed] [Google Scholar]
- 23. Ballesteros J. A. (2001) Activation of the β2-adrenergic receptor involves disruption of an ionic lock between the cytoplasmic ends of transmembrane segments 3 and 6. J. Biol. Chem. 276, 29171–29177 [DOI] [PubMed] [Google Scholar]
- 24. Rao V. R., Oprian D. D. (1996) Activating mutations of rhodopsin and other G protein-coupled receptors. Annu. Rev. Biophys. Biomol. Struct. 25, 287–314 [DOI] [PubMed] [Google Scholar]
- 25. Wald G. (1968) The molecular basis of visual excitation. Nature 219, 800–807 [DOI] [PubMed] [Google Scholar]
- 26. Galandrin S., Bouvier M. (2006) Distinct signaling profiles of beta1 and beta2 adrenergic receptor ligands toward adenylyl cyclase and mitogen-activated protein kinase reveals the pluridimensionality of efficacy. Mol. Pharmacol. 70, 1575–1584 [DOI] [PubMed] [Google Scholar]
- 27. Locht C., Coutte L., Mielcarek N. (2011) The ins and outs of pertussis toxin. FEBS J. 278, 4668–4682 [DOI] [PubMed] [Google Scholar]
- 28. Clark M. J., Neubig R. R., Traynor J. R. (2004) Endogenous regulator of G protein signaling proteins suppress Gαo-dependent, mu-opioid agonist-mediated adenylyl cyclase supersensitization. J. Pharmacol. Exp. Ther. 310, 215–222 [DOI] [PubMed] [Google Scholar]
- 29. Fung J. J., Deupi X., Pardo L., Yao X. J., Velez-Ruiz G. A., Devree B. T., Sunahara R. K., Kobilka B. K. (2009) Ligand-regulated oligomerization of β(2)-adrenoceptors in a model lipid bilayer. EMBO J. 28, 3315–3328 [DOI] [PMC free article] [PubMed] [Google Scholar]
- 30. Harrison C., Traynor J. R. (2003) The [35S]GTPγS binding assay: approaches and applications in pharmacology. Life Sci. 74, 489–508 [DOI] [PubMed] [Google Scholar]
- 31. Chidiac P., Hebert T. E., Valiquette M., Dennis M., Bouvier M. (1994) Inverse agonist activity of β-adrenergic antagonists. Mol. Pharmacol. 45, 490–499 [PubMed] [Google Scholar]
- 32. Samama P., Cotecchia S., Costa T., Lefkowitz R. J. (1993) A mutation-induced activated state of the β2-adrenergic receptor. Extending the ternary complex model. J. Biol. Chem. 268, 4625–4636 [PubMed] [Google Scholar]
- 33. Kjelsberg M. A., Cotecchia S., Ostrowski J., Caron M. G., Lefkowitz R. J. (1992) Constitutive activation of the α1B-adrenergic receptor by all amino acid substitutions at a single site. Evidence for a region which constrains receptor activation. J. Biol. Chem. 267, 1430–1433 [PubMed] [Google Scholar]
- 34. De Lean A., Stadel J. M., Lefkowitz R. J. (1980) A ternary complex model explains the agonist-specific binding properties of the adenylate cyclase-coupled β-adrenergic receptor. J. Biol. Chem. 255, 7108–7117 [PubMed] [Google Scholar]
- 35. Li J., Edwards P. C., Burghammer M., Villa C., Schertler G. F. (2004) Structure of bovine rhodopsin in a trigonal crystal form. J. Mol. Biol. 343, 1409–1438 [DOI] [PubMed] [Google Scholar]
- 36. Rudling J. E., Richardson J., Evans P. D. (2000) A comparison of agonist-specific coupling of cloned human α(2)-adrenoceptor subtypes. Br. J. Pharmacol. 131, 933–941 [DOI] [PMC free article] [PubMed] [Google Scholar]
- 37. Daaka Y., Luttrell L. M., Lefkowitz R. J. (1997) Switching of the coupling of the β2-adrenergic receptor to different G proteins by protein kinase A. Nature 390, 88–91 [DOI] [PubMed] [Google Scholar]
- 38. Xiao R. P. (2001) β-adrenergic signaling in the heart: dual coupling of the β2-adrenergic receptor to G(s) and G(i) proteins. Sci. STKE 2001, re15. [DOI] [PubMed] [Google Scholar]
- 39. Okada T., Sugihara M., Bondar A. N., Elstner M., Entel P., Buss V. (2004) The retinal conformation and its environment in rhodopsin in light of a new 2.2 A crystal structure. J. Mol. Biol. 342, 571–583 [DOI] [PubMed] [Google Scholar]
- 40. Chuang J. Z., Vega C., Jun W., Sung C. H. (2004) Structural and functional impairment of endocytic pathways by retinitis pigmentosa mutant rhodopsin-arrestin complexes. J. Clin. Invest. 114, 131–140 [DOI] [PMC free article] [PubMed] [Google Scholar]
- 41. Musarella M. A., MacDonald I. M. (2011) Current concepts in the treatment of retinitis pigmentosa. J. Ophthalmol. 2011, 1–8 [DOI] [PMC free article] [PubMed] [Google Scholar]
- 42. Daiger S. P., Bowne S. J., Sullivan L. S. (2007) Perspective on genes and mutations causing retinitis pigmentosa. Arch. Ophthalmol. 125, 151–158 [DOI] [PMC free article] [PubMed] [Google Scholar]
- 43. Lem J., Fain G. L. (2004) Constitutive opsin signaling: night blindness or retinal degeneration? Trends Mol. Med. 10, 150–157 [DOI] [PubMed] [Google Scholar]
- 44. Kim J. M., Altenbach C., Kono M., Oprian D. D., Hubbell W. L., Khorana H. G. (2004) Structural origins of constitutive activation in rhodopsin: Role of the K296/E113 salt bridge. Proc. Natl. Acad. Sci. U.S.A. 101, 12508–12513 [DOI] [PMC free article] [PubMed] [Google Scholar]