

Abstract
We present a procedure that supports the acquisition of 1H-15N residual dipolar coupling (RDC) values for individual subunits in binary or ternary protein assemblies from a single experimental sample. Our method relies on asymmetric labeling of each subunit with the following scheme: species A uniformly with 15N, species B uniformly with 15N and 13C, and species C uniformly with 15N but selectively with 13C′ or 13Cα. Because only a single sample is required, the approach obviates the need for preparing multiple samples and eliminates potential errors introduced from differences in sample conditions. Because numerous biological processes rely on protein assemblies or transient interactions, this method should be well suited for a wide range of future applications.
NMR spectroscopy is a powerful method for analyzing changes at the atomic level in the structure and dynamics of macromolecular complexes.1-4 NMR distance restraints used to define the conformational space of protein-protein assemblies are commonly derived from intermolecular nuclear Overhauser effects,5-7 paramagnetic relaxation enhancements,8,9 cross-saturation,10 and chemical shift perturbations.11 However, because full analysis requires spectral information from each partner in the complex, multiple samples are used for such measurements. Thus the full atomic details of protein assemblies, which only NMR can offer in solution, can be time and cost restrictive. Other strategies have exploited amino acid selective12 or asymmetric labeling patterns13,14 to facilitate measurements of inter-molecular distances. Unfortunately, only the interface is characterized and the full backbone conformation and relative orientation of protein-protein complexes is not defined. In some cases, the approach requires sequences which are insensitive for large assemblies with inherently short transverse relaxation times (T2).
The conformational space of macromolecular complexes also can be determined from orientational restraints derived from residual dipolar couplings (RDCs) under weak alignment.15,16 Again, a common strategy for avoiding spectral overlap and for associating NMR signals with a particular subunit is to prepare multiple samples with differential labeling patterns. Particular care is necessary in the case of RDC measurements because slight changes in the experimental conditions can alter the alignment tensor, such that information from different samples cannot be correlated directly.
The implementation of a spin-echo difference during a constant time period of an HSQC was originally introduced by Bax and co-workers17 for the measurement of sidechain dihedral angles. We recently applied a similar constant time spin-echo filter element to replace a two-dimensional version of the triple resonance HNCO pulse sequence to identify sequential pairs of amino acids in large proteins and enzymes,18 and extended this idea to enable chemical shift perturbation mapping of samples containing three isotopically labeled species in solution.19
In this Communication we report an approach that, in combination with an asymmetric isotopic labeling scheme, enables the simultaneous measurements of RDCs from subunits of binary and ternary complexes with high sensitivity. Unlike recently reported schemes,20,21 the pulse sequence used in this approach is shorter, and therefore provides higher sensitivity, particularly for large systems. Additionally, the approach supports the unambiguous identification of spectral information from each subunit of a binary or ternary complex.
The complete details for the detection and deconvolution of a spectrum containing three isotopically labeled species were provided in a previous publication19 and only a brief description is provided here. The subunits of the ternary complex are labeled differentially as follows: uniformly 15N (U-15N) labeled (species A), uniformly 15N and 13C (U-15N,13C) labeled (species B), and U-15N and selectively 13C′ or 13Cα labeled (species C). Selective 13C′ or 13Cα labeling can be achieved for recombinant proteins expressed in Escherichia coli by utilizing 1-13C or 2-13C glucose, respectively, as the sole carbon source.22 Signals from either or both 13C labeled species (species B or C) can be suppressed in a selective manner by using a [1H/15N]-HSQC sequence containing a modified constant-time period which leads to JNC′ or JNCα modulation (Figure 1). Thus resonances from either species A or species A and C can be produced in subspectra. Linear combinations of these subspectra lead to the observation of the three individual subunits.19
Figure 1.
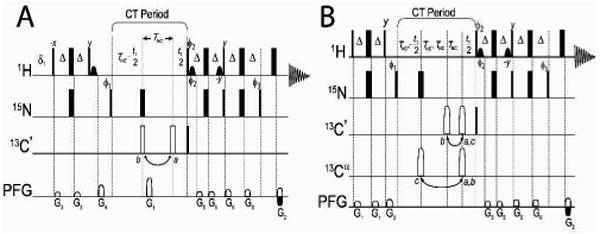
Schematic for the gradient-selected TROSY-based pulse sequences for binary (A) or ternary (B) protein mixtures. A reference spectrum is obtained by applying the 180° 13C pulses (open pulses) at position a; while 13C′ or 13Cα suppression is obtained with pulses position b or c, respectively. Delay durations: Δ = 2.4 ms; δ = 0.11 ms; TNC′ = 16.5 ms, TNCα = 23.5 ms. Further details, including spectral editing to obtain each subunit, are provided in the Supporting Information.
For the measurement of RDCs, we adapted these sequences to utilize sensitivity-enhanced TROSY or anti-TROSY spin-state selection, and we allowed JHN coupling to become active during chemical shift evolution so that 1H-15N splittings could be measured accurately (Figure 1). Alternatively, RDCs can be extracted by measuring the 1H-15N half-splitting between a pair of TROSY and decoupled HSQC spectra.23 Because the introduction of JNC′ or JNCα modulation is used only for the purpose of suppressing the detection of resonances, this modulation has no effect on the accuracy of the 1H-15N splittings measured. As shown in Figure 1, the sequence is simplified to increase sensitivity in cases of a binary complex (Figure 1A), or the full pulse sequence (Figure 1B) is used in the case of a ternary complex. The total constant time period ∼33 ms (½ JNC′) or ∼49 ms (½ JNCα), respectively.19
As a proof of concept, we applied this approach to a ternary mixture of non-interacting proteins: maltose binding protein (MBP, 44 kDa), ubiquitin (8 kDa), and Kemptide (0.7 kDa). Proteins were either expressed in Escherichia coli BL21(DE3) to obtain uniform labeling ([U-2H, U-15N]-MBP and [U-15N,13C]-ubiquitin) or synthesized using solid phase synthesis with standard Fmoc chemistry ([15N-Ser5,13C′-Ala4]-Kemptide). The NMR sample contained 1.5 mM MBP, 1 mM ubiquitin, and 0.5 mM Kemptide.
The pulse sequence from Figure 1B was used to obtain the isotropic couplings for the ternary mixture shown in Figure 2. All 1H-15N correlations were observed in the reference spectrum (Figure 2A), and the sub-spectra for each component was obtained by using spectral editing of the suppressed spectra (Figures 2B-D). Weak alignment was then introduced using pf1 phage (12 mg/ml), and the couplings were re-measured to obtain backbone RDC values for the well-folded proteins ubiquitin and MBP. Back-calculated RDC values based on the crystal structures 1UBQ (ubiquitin)24 and 1OMP (MBP)25 matched well with experimentally measured values obtained in this study (Figure S1, Supporting Information). Outliers from the MBP structure may arise from a small difference in pH (∼7.3 used here, vs. pH of 7.0 used previously) and possibly from the slightly different construct used in this study which has an N-terminal His6 tag and an artifact of a TEV-cleavage site that left four extra residues at the C-terminus.26 Thus, coupling values from this single sample were sufficient to define the backbone conformational space of these structured proteins, along with their relative alignment tensors.
Figure 2.
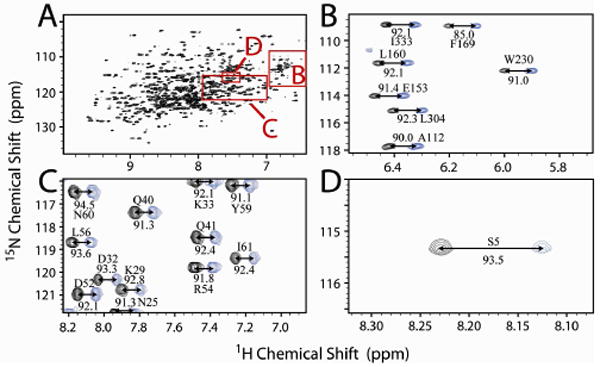
Spectral analysis of the convoluted spectrum containing [U-2H, U-15N]-MBP, [U-15N,13C]-ubiquitin, and [15N-Ser5, 13C′-Ala4]- Kemptide. TROSY-detection was used to obtain all 15N resonances in the sample (A). Isotropic J-coupling values were obtained from spectral editing of TROSY and anti-TROSY datasets as shown for MBP (B), ubiquitin (C), and Kemptide (D).
This new approach to measuring backbone RDC values in a ternary complex eliminates the need for multiple samples, removes errors from sample inconsistencies, and ultimately reduces costs related to the preparation of multiple samples. Although shown only for a tertiary mixture of proteins, this approach will work for soluble and membrane proteins, so long as the reference HSQC experiment can be obtained. In the case of membrane proteins, lanthanides or polyacrylamide gels may be used to introduce weak alignment so that the detergent or bicelle are not perturbed.16,27
When a binary mixture of proteins is studied, the signal-to-noise (S/N) resulting from the pulse sequence (Figure 1A) used to detect the 15N-labeled species is √2 higher than approaches that rely on a HNCO-based sequence,18 as has been proposed recently.20,21 In addition, the time period in which magnetization is transverse in HNCO-based experiments is ∼68 ms, whereas the sequences presented here only require half this time period (∼33 ms) for a binary mixture or ∼49 ms for a ternary mixture. Our laboratories have shown that, for large proteins, the constant-time spin-echo filter used in this approach has superior S/N and works well when HNCO-based sequences provide insufficient S/N, particularly in cases which T2 values are less than ∼50 ms.18
In summary, we present a new approach for the acquisition of backbone amide RDCs for binary or ternary complexes using a single sample. Together with the applicability of these sequences to monitor chemical shift perturbations in titration experiments,19 this method provides useful orientational restraints for high-resolution studies of protein complexes.11 Since numerous biological processes rely on protein assemblies or transient interactions, this approach should be well suited for a wide range of applications.
Supplementary Material
Acknowledgments
Financial support provided by NIH grants GM64742, GM072701 and HL080081 (G.V.), RR02301 and GM66326 (J.L.M.), and AHA support from 0615546Z (L.R.M.). NMR data were collected at NMRFAM (NIH: P41RR02301, P41GM66326, RR02781, and RR08438; NSF: (DMB-8415048, OIA-9977486, BIR-9214394) and USDA. U. of Minnesota NMR Facility is supported by NSF (BIR-961477).
Footnotes
Supporting Information available: pulse sequence and spectral editing details, and experimental RDC fitting to available structures. This material is available free of charge via the Internet at http://pubs.acs.org.
References
- 1.Teague SJ. Nat Rev Drug Discov. 2003;2:527–541. doi: 10.1038/nrd1129. [DOI] [PubMed] [Google Scholar]
- 2.Clarkson J, Campbell ID. Biochem Soc Trans. 2003;31:1006–1009. doi: 10.1042/bst0311006. [DOI] [PubMed] [Google Scholar]
- 3.Kay LE. J Magn Reson. 2005;173:193–207. doi: 10.1016/j.jmr.2004.11.021. [DOI] [PubMed] [Google Scholar]
- 4.Betz M, Saxena K, Schwalbe H. Curr Opin Chem Biol. 2006;10:219–225. doi: 10.1016/j.cbpa.2006.04.006. [DOI] [PMC free article] [PubMed] [Google Scholar]
- 5.Clore GM, Gronenborn AM. Nat Struct Biol. 1997;4:849–853. [PubMed] [Google Scholar]
- 6.Zwahlen C, Legault P, Vincent SJF, Greenblatt J, Konrat R, Kay LE. J Am Chem Soc. 1997;119:6711–6721. [Google Scholar]
- 7.Post CB. Curr Opin Struct Biol. 2003;13:581–588. doi: 10.1016/j.sbi.2003.09.012. [DOI] [PubMed] [Google Scholar]
- 8.Clore GM, Tang C, Iwahara J. Curr Opin Struct Biol. 2007;17:603–616. doi: 10.1016/j.sbi.2007.08.013. [DOI] [PMC free article] [PubMed] [Google Scholar]
- 9.Arora A, Tamm LK. Curr Opin Struct Biol. 2001;11:540–547. doi: 10.1016/s0959-440x(00)00246-3. [DOI] [PubMed] [Google Scholar]
- 10.Shimada I. Methods Enzymol. 2005;394:483–506. doi: 10.1016/S0076-6879(05)94020-2. [DOI] [PubMed] [Google Scholar]
- 11.Zuiderweg ER. Biochemistry. 2002;41:1–7. doi: 10.1021/bi011870b. [DOI] [PubMed] [Google Scholar]
- 12.Igarashi S, Osawa M, Takeuchi K, Ozawa S, Shimada I. J Am Chem Soc. 2008;130:12168–12176. doi: 10.1021/ja804062t. [DOI] [PubMed] [Google Scholar]
- 13.Walters KJ, Ferentz AE, Hare BJ, Hidalgo P, Jasanoff A, Matsuo H, Wagner G. Methods Enzymol. 2001;339:238–58. doi: 10.1016/s0076-6879(01)39316-3. [DOI] [PubMed] [Google Scholar]
- 14.Traaseth NJ, Ha KN, Verardi R, Shi L, Buffy JJ, Masterson LR, Veglia G. Biochemistry. 2008;47:3–13. doi: 10.1021/bi701668v. [DOI] [PMC free article] [PubMed] [Google Scholar]
- 15.Prestegard JH, Bougault CM, Kishore AI. Chem Rev. 2004;104:3519–3540. doi: 10.1021/cr030419i. [DOI] [PubMed] [Google Scholar]
- 16.Bax A, Grishaev A. Curr Opin Struct Biol. 2005;15:563–570. doi: 10.1016/j.sbi.2005.08.006. [DOI] [PubMed] [Google Scholar]
- 17.Vuister GW, Wang AC, Bax A. J Am Chem Soc. 1993;115:5334–5335. [Google Scholar]
- 18.Tonelli M, Masterson LR, Hallenga K, Veglia G, Markley JL. J Biomol NMR. 2007;39:177–185. doi: 10.1007/s10858-007-9185-3. [DOI] [PMC free article] [PubMed] [Google Scholar]
- 19.Masterson LR, Tonelli M, Markley JL, Veglia G. J Am Chem Soc. 2008;130:7818–7819. doi: 10.1021/ja802701w. [DOI] [PMC free article] [PubMed] [Google Scholar]
- 20.Ortega-Roldan JL, Jensen MR, Brutscher B, Azuaga AI, Blackledge M, van Nuland NA. Nucleic Acids Res. 2009;37:e70. doi: 10.1093/nar/gkp211. [DOI] [PMC free article] [PubMed] [Google Scholar]
- 21.Bermel W, Tkach EN, Sobol AG, Golovanov AP. J Am Chem Soc. 2009;131:8564–8570. doi: 10.1021/ja901602c. [DOI] [PubMed] [Google Scholar]
- 22.Lundstrom P, Teilum K, Carstensen T, Bezsonova I, Wiesner S, Hansen DF, Religa TL, Akke M, Kay LE. J Biomol NMR. 2007;38:199–212. doi: 10.1007/s10858-007-9158-6. [DOI] [PubMed] [Google Scholar]
- 23.Kontaxis G, Clore GM, Bax A. J Magn Reson. 2000;143:184–196. doi: 10.1006/jmre.1999.1979. [DOI] [PubMed] [Google Scholar]
- 24.Vijay-Kumar S, Bugg CE, Cook WJ. J Mol Biol. 1987;194:531–544. doi: 10.1016/0022-2836(87)90679-6. [DOI] [PubMed] [Google Scholar]
- 25.Sharff AJ, Rodseth LE, Spurlino JC, Quiocho FA. Biochemistry. 1992;31:10657–10663. doi: 10.1021/bi00159a003. [DOI] [PubMed] [Google Scholar]
- 26.Masterson LR, Bortone N, Yu T, Ha KN, Gaffarogullari EC, Nguyen O, Veglia G. Protein Expr Purif. 2009;64:231–236. doi: 10.1016/j.pep.2008.10.016. [DOI] [PMC free article] [PubMed] [Google Scholar]
- 27.Veglia G, Opella SJ. J Am Chem Soc. 2000;122:11733–11734. [Google Scholar]
Associated Data
This section collects any data citations, data availability statements, or supplementary materials included in this article.