

Abstract
Objective: To determine the prognostic significance of inflammatory response-associated genes in acute myeloid leukemia (AML). Methods: Transcriptomic profiles and related clinical information of AML patients were acquired from a public database. To establish a multi-gene prognosis signature, we performed least absolute shrinkage and selection operator Cox analysis for the TCGA cohort and evaluated the ICGC cohort for verification. Subsequently, Kaplan-Meier analysis was carried out to compare the overall survival (OS) rates between high- and low-risk groups. Biological function and single-sample gene set enrichment (ssGSEA) analyses were employed to investigate the association of risk score with immune status and the tumor microenvironment. Prognostic gene expression levels in AML samples and normal controls were confirmed by qRT-PCR and immunofluorescence. Results: We identified a potential inflammatory response-related signature comprising 11 differentially expressed genes, including ACVR2A, CCL22, EBI3, EDN1, FFAR2, HRH1, ICOSLG, IL-10, INHBA, ITGB3, and LAMP3, and found that AML patients with high expression levels in the high-risk group had poor OS rates. Biological function analyses revealed that prognostic genes mainly participated in inflammation and immunity signaling pathways. Analyses of cancer-infiltrating immunocytes indicated that in high-risk patients, the immune suppressive microenvironment was significantly affected. The expression of the inflammation reaction-associated signature was found to be associated with susceptibility to chemotherapy. There was a significant difference in prognostic gene expression between AML and control tissues. Conclusion: A novel inflammatory response-related signature was developed with 11 candidate genes to predict prognosis and immune status in AML patients.
Keywords: Acute myeloid leukemia, inflammatory response, prognostic gene signature, immune status, tumor microenvironment, overall survival, drug sensitivity
Introduction
Acute myelogenous leukemia (AML) is among the most common hematological malignancies; it is characterized by abnormal molecular heterogeneity and immature myeloid progenitor cells that accumulate in the bone marrow and peripheral blood [1,2]. In 2020, 19,940 patients were diagnosed with AML in the United States, and 11,180 AML-related deaths occurred [3]. AML is a highly heterogeneous malignancy for which chemotherapy is the primary treatment. Despite the standardization of treatment, AML prognoses vary widely. Although there have been significant efforts toward developing targeted and/or combination therapies, the 5-year survival rates for AML patients remain unsatisfactory at less than 30%, partly due to resistance to antitumor drugs [4,5]. Therefore, it is imperative to determine potential indicators that can promote the diagnosis, therapy, and prognosis of AML patients as well as monitor the disease.
Recently, a growing body of evidence has suggested that the bone marrow microenvironment plays a significant role in AML pathogenesis [6,7]. Various hematologic malignancies are characterized by an inflammatory response in the bone marrow [8,9]. Various studies have highlighted the effects of inflammation on cancer progression [10-12]. For example, inflammation is a persistent and self-sustaining stimulus that forces malignant clones to generate extra subclones by inducing additional mutations in hematopoietic cells [8]. In AML mouse models, researchers have found that the microenvironmental modulation of hematopoietic stem cells is remarkably disturbed by the growth of leukemia cells [13]. Intriguingly, there is a positive relationship between inflammatory signaling and bone marrow structure remodeling [14]. Thus, exploring the mechanism by which inflammatory event-associated genes are regulated in the tumor immune microenvironment (TIME) of AML may reveal new therapeutic targets and interventions.
In this study, we acquired the mRNA expression profiles of AML patients from a public database. Subsequently, in the TCGA cohort, we established a prognosis hallmark with DEGs associated with the inflammation reaction, and the steadiness and effectiveness of the model were further verified by the ICGC cohort. Functional enrichment analysis and exploration of prognostic gene expression associated with tumor stemness and chemoresistance were also performed. The expression of prognostic genes at the mRNA and protein levels in AML and normal samples was confirmed by experimental assays.
Materials and methods
Data collection and processing
The transcriptomic dataset and associated clinical information of 151 AML patients were acquired from the TCGA web site (TCGA-AML Cohort, https://www.cancer.gov/about-nci/organization/ccg/research/structural-genomics/tcga), and 264 normal samples were acquired from GTEx web site (GTEx-Normal Cohort, https://xena.ucsc.edu/). The transcriptomic dataset and clinical data of 356 AML specimens were acquired from the ICGC website (LAML-US Cohort, https://dcc.icgc.org/). The patients whose data were included in these sets were primarily American citizens, and all were diagnosed with AML. The information from TCGA, GTEx, and ICGC is publicly available in accordance with their data acquisition and publication protocols.
Establishment and verification of a prognostic inflammation reaction-associated genetic signature
First, as presented in Supplementary Table 1, we acquired 200 inflammation reaction-related genes (IRRGs) from the Molecule Signature data base. Then, per the standards of fold change > 2 and a false discovery rate (FDR) < 0.05, we determined the DEGs between AML specimens and healthy specimens within the TCGA cohort with “limma” R software. Least absolute shrinkage and selection operator (LASSO)-penalized Cox regressive analysis was used to establish a prognosis model and reduce the risk of overfitting to a minimum [15]. The “glmnet” R package was used to select and shrink variates, equaling certain regression coefficients to 0 and yielding a rational model.
Patient risk scores were computed based on the expression level of all evaluated inflammatory reaction-associated genes and their relevant regression coefficients. The calculation was carried out according to the following equation: risk score= esum (every genetic expression × relevant coefficient). Then, patients were separated into riskhigh and risklow groups based on the mid-value of the risk score. PCA analysis was further employed to study the distributional status of prognostic genes in various groups with “Rtsne” and “ggplot2” R packages.
To study the overall survival (OS) of the riskhigh group and risklow group, survival analysis was performed using the “survminer” R package. Moreover, the “survival” and “timeROC” R programs were implemented to complete time-reliant receiver operating characteristic (ROC) curve analyses to assess the prediction potential of the prognosis hallmark.
Functional enrichment analysis of inflammatory reaction-related DEGs
To reveal the potential roles of the prognostic signature, we employed functional enrichment analyses, like gene ontology, Kyoto Encyclopedia of Genes and Genomes (KEGG), and gene set enrichment analysis (GSEA) with program 4.1 according to the DEGs between the riskhigh group and risklow group [16]. The Banjamini-Hochberg (BH) adjusted P < 0.05 was considered statistically significant.
Tumor microenvironment (TME) and immune response analysis
Immunity and stroma score was carried out to measure the infiltrative status of immunocytes and stromal cells across the two groups [17]. Spearman’s correlation was employed to examine the association of risk score with immune and stromal score. Moreover, tumor stem cell-like characteristics, including RNA stemness score (RNAss) and DNA stemness score (DNAss), were analyzed using the PanCancer TCGA database of tumor stem cell transcriptome and epigenetic data [18]. The stemness indices of RNA and DNA were calculated according to mRNA expression and DNA methylation, respectively [19]. The correlation between cancer stemness and risk score was identified using Spearman correlative analyses.
Analysis of chemosensitivity
The NCI-60 database covers 60 tumor lineage cell lines from nine different cancer types hosted on the Cell Miner website (https://discover.nci.nih.gov/cellminer). A Pearson correlative assay was performed to explore the relationship between genetic expression prognosis and drug susceptibility. The association assay was performed on 216 medicines, selected from medications with FDA approval or those undergoing clinical trial testing (Supplementary Table 2).
Validation of prognosis gene expression between AML and control samples by qRT-PCR
Ten paired AML tissue and corresponding normal peripheral blood samples were acquired from Qinghai Provincial People’s Hospital. The mRNA expression levels of 11 prognosis genes were measured in all samples using qRT-PCR. Based on the manufacturer’s specifications, the target RNAs were extracted using TRIzol reagent (Servicebio). Extracted RNAs were then converted into cDNA by reverse transcription using the Revert Aid First Strand cDNA Synthetic Tool (Thermo). Fast Start Universal SYBR Green Master Mix (Roche) was used to complete the qRT-PCR assay using StepOne (Applied Biosystems). The relevant primer sequences are listed in Supplementary Table 3. Each RNA sampling procedure was repeated three times. The comparative expression levels of IRRGs were computed using the 2-ΔΔCt approach to compare expression levels across samples.
Validation of prognostic gene expression between AML and control samples by immunofluorescence (IF)
Paraffin-embedded tumor tissues were deparaffinized for antigen repair. IF staining was performed using anti-ACVR2A, CCL22, EBI3, EDN1, FFAR2, HRH1, ICOSLG, IL-10, INHBA, ITGB3, and LAMP3 antibodies, according to the standard protocol. The nuclei were then stained with DAPI (Invitrogen), and imaging results were observed and analyzed via fluorescence microscopy.
Statistics
The Wilcoxon test was used to compare DEGs between AML and control samples, and the chi-square test was used to compare the percentages. The Mann-Whitney test was employed to contrast the ssGSEA score of immunocytes or immunity paths between the riskhigh and risklow groups, and the BH approach was utilized to modify the P result. K-M analyses were used to compare the OS among the diverse groups. The association between prognosis model risk score, prognosis genetic expression, stemness and stroma score, immunity score, and medicine susceptibility was further determined via Spearman and Pearson correlative analyses. To generate plots, R program 3.6.3, including the various packages of venn, igraph, ggplot2, pheatmap, ggpubr, corrplot, and survminer were employed. Finally, a two-tailed P value < 0.05 was considered statistically significant.
Results
Determination of prognostic inflammation-associated DEGs in the TCGA cohort
A flow diagram of this study is presented in Figure 1. The research subjects comprised 151 AML patients from the TCGA-AML cohort, 264 normal samples from the GTEx cohort, and 356 AML patients from the ICGC (LAML-US) cohort. In AML and neighboring normal samples, 79 DEGs associated with inflammatory response and 49 prognostic genes were identified (Figure 2A). The heatmap shows the expression levels of the 21 overlapping genes in AML and normal samples (Figure 2B). Univariable Cox analysis revealed an association between the expression levels of 49 prognosis genes and OS (Supplementary Figure 1A). The 21 inflammatory response-related genes were correlated with OS and were expected to be potential prognostic markers. The hazard rate of CCL22 gene was 18.178 (95% CI = 4.296-76.910, P < 0.001, Figure 2C). As shown in Figure 2D, we determined the correlative network of these genes.
Figure 1.

The flow chart including data collection, analyses and representative experimental results in this study.
Figure 2.

Determination of the candidate inflammatory response-related genes in the TCGA cohort. A. Venn diagram to determine DEGs between AML samples and normal controls. B. Heat map showing the expression levels of 21 overlapping genes between AML samples and normal controls. C. Forest plots revealing the results of the correlation between expression of 21 overlapping gene and OS. D. The correlation network of 21 overlapping genes.
Establishment of a prognostic model for the TCGA cohort
LASSO-Cox regressive analysis was performed to construct the prognostic model of the aforementioned 21 genes, which were identified based on the optimum value of λ (Supplementary Figure 1B, 1C). The patients’ risk scores were assessed as follows: risk score = 0.120 * expression level of ACVR2A + 1.530 * expression level of CCL22 + 0.168 * expression level of EBI3 + 0.691 * expression level of EDN1 + 0.066 * expression level of FFAR2 + 0.661 * expression level of HRH1 + 0.313 * expression level of ICOSLG + 0.033 * expression level of IL10 + 0.095 * expression level of INHBA + 0.019 * expression level of ITGB3 + 1.103 * expression level of LAMP3.
Subsequently, patients were separated into riskhigh and risklow groups based on the mid-value cut-off (Figure 3A). Early mortality was observed more frequently for Riskhigh patients than for risklow patients (Figure 3B). Furthermore, PCA analyses revealed that patients in the riskhigh and risklow groups were mainly distributed in two orientations (Figure 3C). Similarly, the K-M curve revealed that riskhigh patients displayed a remarkably inferior OS compared to risklow patients (Figure 3D, P < 0.001). ROC curves were used to forecast OS in the constructed prognostic model, and the AUC was 0.799 at 1 year, 0.803 at 2 years, and 0.780 at 3 years (Figure 3E). To reveal the association between the 11 prognosis genes and prognoses, we performed survival analyses according to the optimum threshold of each prognosis gene. The results revealed that for all genes, high expression levels were significantly related to worse OS (Supplementary Figure 2A-K, P < 0.001). As presented in Supplementary Figure 3, the expression levels of each of the 11 prognostic genes were higher in AML samples than in the normal controls, which is consistent with the results shown in Figure 2B.
Figure 3.

Prognostic analysis of the eleven genes’ signature model in the TCGA cohort and ICGC cohort. TCGA cohort (A-E), ICGC cohort (F-J). (A, F) The median value and distribution of the risk scores. (B, G) The distribution of OS with risk scores. (C, H) PCA plot analysis of patients in the high- and low-risk groups. (D, I) Kaplan-Meier curves for OS of patients in the high- and low-risk groups. (E, J) AUC time-dependent ROC curves for OS at 1, 2, 3 years.
Validation of gene signatures in the ICGC cohort
AML patients within the ICGC cohort were separated into riskhigh and risklow groups according to the mid-value of the TCGA cohort to determine the validity of the established prognosis model (Figure 3F). However, all patients with survival data in the ICGC cohort died, so the data were unsuitable for comparing mortality in the different risk groups (Figure 3G). As per PCA analysis, the results verified the scattered distribution of AML patients in riskhigh and risklow groups, showing similar results to those obtained from the TCGA cohort (Figure 3H). As shown in Figure 3I, patients in the riskhigh group exhibited a lower survival rate than those in the risklow group. In addition, the AUC of the 11-gene hallmark reached 0.738 at 1 year, 0.745 at 2 years, and 0.789 at 3 years, indicating that the risk score yielded satisfactory prognostic predictability (Figure 3J).
Biological function and pathway analyses
The different OS rates of patients in the riskhigh group and risklow group were studied, and GSEA was further employed to explore the underlying diversity of biological functions and pathways between them. GO term analysis revealed that the biological process of T cell proliferation was remarkably enriched in riskhigh patients (Figure 4A; Supplementary Figure 4). In addition, five KEGG pathways were mainly sponged in the riskhigh patients, with a FDR < 0.05, which is presented in Figure 4B and Supplementary Figure 5. The pathways of the KEGG database demonstrated that the remarkably expressed DEGs in the riskhigh patients were predominantly associated with the pathways relevant to the inflammatory response, including B cell receptor, chemokine, and Fc-g receptor-mediated phagocytosis. These data indicate that these DEGs may be highly influential on the immunoresponse.
Figure 4.
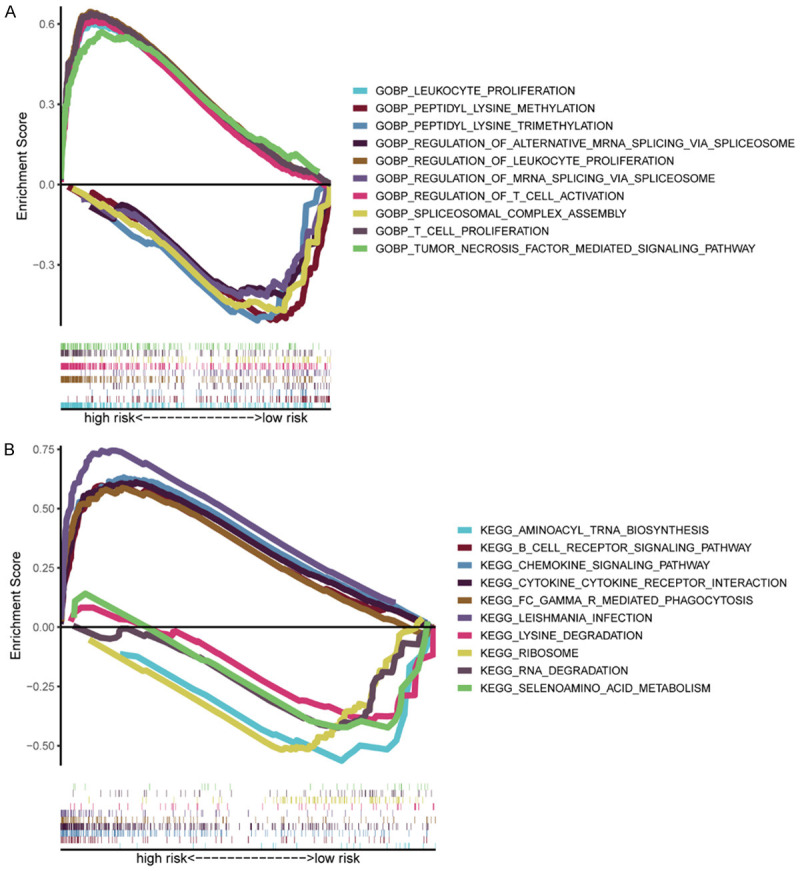
Gene set enrichment analysis of biological functions and pathways. A. Analysis of Gene Ontology (GO). B. Analysis of Kyoto Encyclopedia of Genes and Genomes (KEGG).
Potential relevance of gene signature in TIME
The TME immune status is mainly associated with cancer development, drug tolerance, and clinical results. To evaluate the association between risk score and immune status, ssGSEA was performed to study the enrichment score of diverse immunocyte subset-related roles and pathways. All genes relevant to ssGSEA analysis are presented in Supplementary Table 4. We discovered that the process of antigenic presentation within the TCGA cohort, such as iDCs, pDCs, APC co-suppression, APC co-activation, HLA, and MHC class I, was significantly promoted in riskhigh patients with a modified P < 0.05 (Figure 5A, 5B). Moreover, the ratio of Tfh cells, Th1 cells, Treg cells, T cell co-activation, and T cell co-suppression was higher in riskhigh patients than in risklow patients, suggesting that differences in T cell regulation may play a potential role in observed differences in riskhigh and risklow groups. In addition, our team observed that CCR, checkpoint, macrophage, neutrophilic cell, inflammation-facilitating activity, and type II IFN reaction activity scores were also higher in riskhigh patients than in risklow patients with a modified P < 0.05 (Figure 5A, 5B). The comparisons of the above indicators within the ICGC cohort between the two risk groups resembled that within the TCGA cohort with a modified P < 0.05 (Figure 5C, 5D).
Figure 5.

Analyses of immune status and the relationship between risk score and TME in the high- and low-risk groups. TCGA cohort (A, B), ICGC cohort (C, D). (A, C) The boxplots of showing the score of 16 immune cells and (B, D) 13 immune-related functions. (E) The relationship of risk score with RNAss, DNAss, Stromal Score and Immune Score. P values were presented as: ns, no significance; *P < 0.05; **P < 0.01; ***P < 0.001.
To further study whether risk score was associated with cancer stemness and TIME, RNAss and DNAss were performed to measure tumor stemness. Stroma and immunity score were also employed to assess TIME. As presented in Figure 5E, our team discovered that the risk score was not remarkably associated with DNAss but remarkably positively correlated with stromal and immune scores (P < 0.001) and negatively correlated with RNAss (P < 0.001).
In addition, PD-1/PD-L1 and PD-1/PD-L2 paths are critical modulators of tumor immunoescape. Thus, testing the expression levels of immunity checkpoints like PD-L1 and PD-L2 is a vital approach for immunological therapy. In comparison with the risklow patients, the expression levels of PD-L1 and PD-L2 were higher in the riskhigh patients (Figure 6A, 6B), and the relationship between the expression levels of PD-L1 and PD-L2 and the risk score was positive (Figure 6C, 6D).
Figure 6.

Analyses of detecting expression levels of PD-L1, PD-L2, MRP2 and MRP3 between different groups and the correlation between risk score and the expression of PD-L1, PD-L2, MRP2 and MRP3. A, C. PD-L1. B, D. PD-L2. E, G. MRP2. F, H. MRP3.
Prognostic gene expression and oncocyte susceptibility to chemotherapy
The multidrug resistance-associated protein (MRP) family is essential for modulating drug resistance-associated tumor genes. We found that patients in riskhigh group exhibited higher expression levels of MRP2 and MRP3 than risklow patients (Figure 6E, 6F). Additionally, the expression levels of MRP2 and MRP3 were positively related to the risk score (Figure 6G, 6H).
Subsequently, in NCI-60 lineage cells, we measured the expression of prognosis genes and investigated the association between their expression levels and medicine susceptibility (Supplementary Table 5). The results suggested that the prognostic genes were related to certain chemotherapeutic drug sensitivities (P < 0.01). Representative results are as follows: elevated expression levels of INHBA, HRH1, and IL-10 were associated with elevated susceptibility of oncocytes to dasatinib, midostaurin, lomustine, and azacitidine. In contrast, the increased expression levels of CCL22 and ACVR2A were associated with decreased susceptibility of oncocytes to midostaurin and etoposide (Figure 7). Notably, the elevated expression of both INHBA and HRH1 was related to increased drug susceptibility of oncocytes to dasatinib, which was accepted by the FDA as a first-line therapy for AML in 2006.
Figure 7.
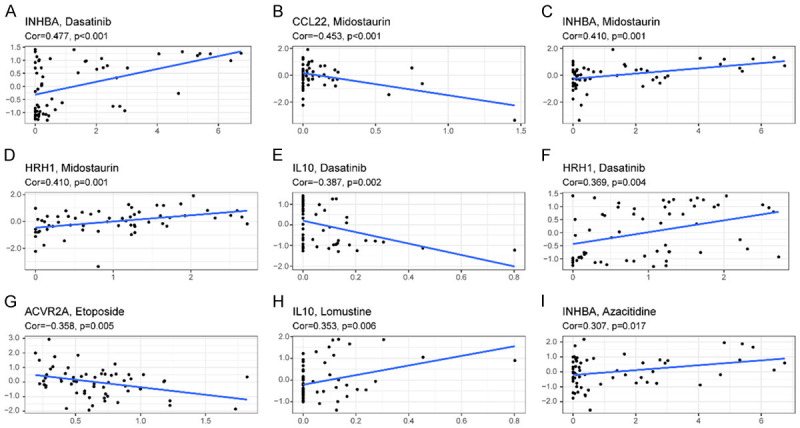
Representative top 9 scatter diagram of association between prognostic gene expression and drug susceptibility. A-I. Scatter plots sorted by Cor value. A, C, I. INHBA. B. CCL22. D, F. HRH1. E, H. IL 10. G. ACVR2A.
Verification of prognosis gene expression between AML and control samples by qRT-PCR and IF
To validate the diverse expression of the 11 prognostic genes (ACVR2A, CCL22, EBI3, EDN1, FFAR2, HRH1, ICOSLG, IL-10, INHBA, ITGB3, and LAMP3) between AML and corresponding healthy samples, the expression level of mRNA and protein was analyzed by qRT-PCR and IF. As expected, the prognosis gene expression levels were higher in AML specimens than in healthy specimens based on the qRT-PCR assay (Figure 8, P < 0.001). As depicted in Figure 9, the results of IF were similar to those of qRT-PCR (P < 0.01). These experimental results further confirmed the mRNA levels of 11 prognostic genes in the TCGA database (Supplementary Figure 3).
Figure 8.

The mRNA expression analysis of the prognostic genes between AML tissues and normal controls by qRT-RCR. A. ACVR2A. B. CCL22. C. EBI3. D. EDN1. E. FFAR2. F. HRH1. G. ICOSLG. H. IL-10. I. INHBA. J. ITGB3. K. LAMP3. ***P < 0.001.
Figure 9.

The protein expression analysis of the prognostic genes between AML tissues and normal controls by IF. The nucleus was stained with DAPI. A. ACVR2A. B. CCL22. C. EBI3. D. EDN1. E. FFAR2. F. HRH1. G. ICOSLG. H. IL-10. I. INHBA. J. ITGB3. K. LAMP3. Scale bars are 50 µm. Magnifications are 20X.
Discussion
AML is a prevalent hematological carcinoma characterized by the accumulation of immature myeloid progenitor clones [20]. The development of targeted molecular and immunization therapies has benefited AML patients, but the 5-year prognoses of AML remain unsatisfactory because of the high relapse rates [4,5]. A high-accuracy prognosis prediction method supports the decision-making capability of healthcare practitioners to develop individualized therapy programs by designating riskhigh and risklow groups using dependable gene signatures [21]. In this study, we comprehensively studied the expression of 200 IRRGs in AML samples and their association with OS. We identified 79 DEGs in the TCGA cohort. Univariate Cox analyses revealed that 21 DEGs were associated with OS. Subsequently, a prognosis model involving 11 IRRGs was established via LASSO regressive analyses and verified within the ICGC cohort. We separated the patients into riskhigh and risklow groups according to the mid-value of the risk score and found that riskhigh patients exhibited significantly poorer OS in contrast to risklow patients as per the K-M analyses. We aimed to verify the prediction ability of the hallmark and obtained an AUC of 0.780 for 3-year OS. Moreover, the AUCs of 1-year and 2-year OS were 0.799 and 0.803, respectively, suggesting that the signature had good predictive capability.
Determining gene signatures using transcriptome profiles is an attractive method for evaluating tumor risks and associated prognoses [22]. The prognostic model constructed in this study comprised 11 inflammatory reaction-associated genes, including ACVR2A, CCL22, EBI3, EDN1, FFAR2, HRH1, ICOSLG, IL-10, INHBA, ITGB3, and LAMP3. They were downregulated in AML samples, and this difference was associated with a worse prognosis. Specifically, ACVR2A is an activin A acceptor, which has a vital effect on tumorigenesis and progression by modulating cell differentiation, proliferation, and apoptosis in cancer cells [23-27]. Studies conducted on Th2 cell-related chemokine (CCL22) expressive levels and Th2 cells in tumors indicated that the expression level of CCL22 serves as a risk prognosis factor in mammary, colonic, and rectal carcinomas [28,29]. It has been reported that CCL22, acting as a receptor for CCR4, partially promotes ATL cell survival through the PI3K-Akt pathway. These results suggested that the inhibition of CCR4 signaling may have therapeutic potential in this refractory malignancy [27,30]. Epstein-Barr virus-induced protein-3 (EBI3) was found to be activated by IL-18 [31] and IL-35 [32], which play key roles in inducing Th1 immune responses and are correlated with AML clinical staging. The PI3K/mTOR dual suppressor BEZ235 impacts the chemosensitivity of AML cells by elevating the expression of miR-1-3p, resulting in EDN1, BAG4, and ABCB1 downregulation and thus regulating cell apoptosis, migration, and multidrug resistance [33]. Lower expression levels of FFAR2 have been reported in breast cancer, prostate cancer, and blood disorders, especially leukemia, which coincide with the outcomes of this study [34,35]. The expression level of HRH1 is associated with the prognosis of various cancers, such as hematological cancers, in which HRH1 can affect differentiation sensitivity and solid carcinoma development [36]. ICOSLG, a component of the B7 ligand family, is vital for modulating the T cell (Treg)-mediated immune response, and its expression in plasmacytoid dendritic cells (DCs) promotes tumor development by accumulating immune suppressive CD4+ T cells [37,38]. Additionally, in myeloproliferative diseases, CD86 and ICOSLG expression is associated with poor clinical prognosis and disease severity [39]. The IL-10 receptor is overexpressed in most AML cells, plays a vital role in facilitating leukemia cell stemness, and has been explored as a new potential therapeutic candidate for AML [40]. INHBA modulates various critical mechanisms involved in the progression of chemoresistance in pancreatic cancer, such as the enhancement of stem cell-like properties and tumorigenicity of pancreatic cancer cells [41]. The expression level and clinical value of INHBA in AML were also investigated, and the results indicated that high INHBA expression was an unfavorable prognosis factor for de novo AML [42]. ITGB3 has been reported to be a promoting factor for tumorigenesis in various malignancies, such as breast cancer [43] and hepatocellular carcinoma [44]. ITGB3 has been reported to interact with STAT6 to participate in AML progression [45]. Furthermore, Fuentes et al. demonstrated that integrin ITGB3 has a pivotal effect on intracellular crosstalk through the interaction and activation of FAK, which is crucial for tumor metastasis [43]. LAMPs are a family of glycosylated proteins presenting primarily on lysosome membranes, including LAMP3, which is overexpressed in a variety of cancers in which it is related to an unsatisfactory prognosis and may be pivotal for tumor metastasis [46-48].
Whether these genes influence prognosis in AML patients via inflammation pathways remains elusive considering that few studies have focused on this relationship. According to the GSEA analysis reported herein, inflammation-associated signal pathways, such as B cell receptor, chemokine, and Fc-g receptor-mediated phagocytosis pathways, were remarkably enriched in riskhigh patients, which substantiated that the inflammation reaction is closely related to tumor progression. Furthermore, high-risk patients displayed a higher ratio of macrophages, neutrophils, Th1 cells, and Tregs. To create and sustain an immune-permissive environment, tumors attract immune suppressive cells, such as M2 (or cancer-related) macrophages, DC subtypes, and myeloid-derived suppressor cells (MDSC) [49]. For instance, oncocytes and cancer-infiltrating macrophages generate the chemotactic factor CCL22, which attracts Tregs into the TME, thus hindering the antitumor immune response [50]. Previous studies have shown that increased numbers of cancer-related macrophages [51,52], neutrophilic cells [53], Th1 cells [54,55], and Treg cells [56,57] are associated with unsatisfactory prognoses in AML patients, partially due to the immune evasion effect.
Tumor immunotherapies targeting immune checkpoints such as PD-L1 have exhibited significant clinical activity in various cancer types [58-60]. The increased expression of immune checkpoints inhibits the anticancer immune response of T cells by elevating the expression levels of PD-1 and BRD4, and studies on immunity checkpoint inhibitors have led to remarkable advancements in AML therapies [61]. In this study, the score of immunity checkpoints in riskhigh patients was greater than that in risklow patients, and the risk score was positively related to the expression levels of PD-L1 and PD-L2. Thus, the prognostic model could be employed to forecast the expression levels of immunity checkpoints and facilitate immunotherapy. Moreover, the score in riskhigh patients was related to mitigation of the type I IFN reaction, which exerted a pivotal effect on cancer immunity monitoring, thus activating anticancer immune activity and facilitating cancer eradication [62-66]. In addition, elevated activities of Tfh cells, Treg cells, Th1 cells, T cell co-activation, and T cell co-suppression in riskhigh patients revealed that the immunoregulatory role was disrupted in riskhigh patients. Thus, it is rational to hypothesize that anticancer immune activity is weakened in riskhigh patients, which may significantly increase the likelihood of a poor prognosis.
The different environments of immune, carcinoma, and matrix cells in the TME form a dynamic landscape, facilitating interactions between tumors and immunocytes, and these interactions may be affected by cancer type [67,68]. Tregs are an important component of the microenvironment, characterized by the expression of the transcriptional factor Foxp3, which maintains immunity homeostasis and prevents excess tissular impairment [69]. The formation of Tregs relies on endocellular signaling stimulated by the T-cell receptor (TCR), costimulatory molecules, and cytokines. In particular, the ICOS/ICOSL axis is pivotal for Treg cell function by promoting Treg differentiative activity by activating the PIK3/AKT signaling pathway [70]. The expression of ICOSL in the TME may be foundational in mediating the co-stimulation of cancer-infiltrating lymph cells as a positive feedback mechanism that further promotes AML cell proliferation [71]. In addition, cancer stem cell-like cells (CSCs) are self-renewing cells that may have diverse origins, such as long-lived stem cells and progenitor cells, and converting from non-stem cells via de-differentiation process [19,72]. CSCs can promote tumorigenesis, metastasis, and resistance to cancer therapy [73]. Transcriptomic analysis of various tumor types indicated a potential relationship between stemness and immune signatures, suggesting that such biological interactions are vital in the development of tumors [74]. Based on the ESTIMATE algorithm, the risk score was positively associated with the immune score, implying that AML tissues were remarkably infiltrated by immunocytes in riskhigh patients.
According to the data of the NCI-60 lineage cells, our team revealed that the elevated expression levels of certain prognosis genes were related to elevated drug tolerance to various chemotherapy drugs with FDA approval, including dasatinib, midostaurin, etoposide, lomustine, and azacitidine. For instance, increased INHBA and HRH1 expression levels were related to the susceptibility of oncocytes to dasatinib, which was accepted by the FDA as a first-line therapy for AML in 2006. Furthermore, the MRP family is composed of 13 components, among which MRP1 to MRP9 act as the primary transporters involved in triggering multidrug tolerance via the extrusion of antitumor drugs from tumor cells [75]. In summary, the association between risk score and medicine tolerance genes such as MRP3 revealed that targeting camera medicine tolerance genes seem to be an effective treatment for riskhigh patients with AML. These outcomes revealed that certain prognosis genes are expected to be utilized as treatment targets to tackle medicine tolerance and auxiliary medicine susceptibility.
Conclusion
This study constructed a prognostic inflammation-associated signature composed of 11 DEGs to predict the OS of AML patients. The signature was proven to be independently related to OS in the training (TCGA and GTEx) and ICGC verification cohorts. Further analyses of biological function, TME, and drug susceptibility provided insights into the prediction of AML prognoses. The underlying mechanism between inflammatory response-associated genes and cancer immune activity in AML remains elusive and deserves further investigation. This study is expected to lay the groundwork for unveiling the effects of prognostic inflammation-related signatures on tumorigenesis, especially in terms of immune response, the TME, and drug tolerance, which is crucial for developing individualized treatments for AML.
Acknowledgements
We are grateful to the contributors to the public databases used in this study. The Fundamental Research Funds for the Central Universities of Central South University under Grant (No. 2020zzts896); the guiding project of Qinghai Provincial Health and Family Planning Commission (2018-wjzdx17). This work was supported by grants from the Project of Kunlun Elite, High-End Innovation and Entrepreneurship Talents of Qinghai Province (Qing talent zi [2021] No. 13).
Disclosure of conflict of interest
None.
Abbreviations
- AUC
Area under the curve
- BH
Benjamin-Hochberg
- DEGs
Differentially expressed genes
- DNAss
DNA stemness score
- FAK
Focal adhesion kinase
- GO
Gene Ontology
- GSEA
Gene set enrichment analysis
- KEGG
Kyoto Encyclopedia of Genes and Genomes
- LAMPs
Lysosome associated membrane proteins
- LASSO
Least absolute shrinkage and selection operator
- MW
Mann-Whitney
- OS
Overall Survival
- ROC
Receiver operating characteristic curve
- RNAss
RNA stemness score
- ssGSEA
Single-sample gene set enrichment
- TCGA
The Cancer Genome Atlas
- ICGC
International Cancer Genome Consortium
- GTEx
Genotype-Tissue Expression
Supplementary Table 1
Supplementary Table 2
Supplementary Table 3 and Supplementary Figures 1-5
Supplementary Table 4
Supplementary Table 5
References
- 1.Marando L, Huntly BJP. Molecular landscape of acute myeloid leukemia: prognostic and therapeutic implications. Curr Oncol Rep. 2020;22:61. doi: 10.1007/s11912-020-00918-7. [DOI] [PMC free article] [PubMed] [Google Scholar]
- 2.Thomas D, Majeti R. Biology and relevance of human acute myeloid leukemia stem cells. Blood. 2017;129:1577–1585. doi: 10.1182/blood-2016-10-696054. [DOI] [PMC free article] [PubMed] [Google Scholar]
- 3.Siegel RL, Miller KD, Jemal A. Cancer statistics, 2020. CA Cancer J Clin. 2020;70:7–30. doi: 10.3322/caac.21590. [DOI] [PubMed] [Google Scholar]
- 4.Tamamyan G, Kadia T, Ravandi F, Borthakur G, Cortes J, Jabbour E, Daver N, Ohanian M, Kantarjian H, Konopleva M. Frontline treatment of acute myeloid leukemia in adults. Crit Rev Oncol Hematol. 2017;110:20–34. doi: 10.1016/j.critrevonc.2016.12.004. [DOI] [PMC free article] [PubMed] [Google Scholar]
- 5.Habbel J, Arnold L, Chen Y, Möllmann M, Bruderek K, Brandau S, Dührsen U, Hanoun M. Inflammation-driven activation of JAK/STAT signaling reversibly accelerates acute myeloid leukemia in vitro. Blood Adv. 2020;4:3000–3010. doi: 10.1182/bloodadvances.2019001292. [DOI] [PMC free article] [PubMed] [Google Scholar]
- 6.Du A, Wu X, Gao Y, Jiang B, Wang J, Zhang P, Zhao Q. m6A regulator-mediated methylation modification patterns and tumor microenvironment infiltration characterization in acute myeloid leukemia. Front Immunol. 2021;12:789914. doi: 10.3389/fimmu.2021.789914. [DOI] [PMC free article] [PubMed] [Google Scholar]
- 7.Jiang D, Wu X, Sun X, Tan W, Dai X, Xie Y, Du A, Zhao Q. Bone mesenchymal stem cell-derived exosomal microRNA-7-5p inhibits progression of acute myeloid leukemia by targeting OSBPL11. J Nanobiotechnology. 2022;20:29. doi: 10.1186/s12951-021-01206-7. [DOI] [PMC free article] [PubMed] [Google Scholar]
- 8.Zambetti NA, Ping Z, Chen S, Kenswil KJG, Mylona MA, Sanders MA, Hoogenboezem RM, Bindels EMJ, Adisty MN, Van Strien PMH, van der Leije CS, Westers TM, Cremers EMP, Milanese C, Mastroberardino PG, van Leeuwen JPTM, van der Eerden BCJ, Touw IP, Kuijpers TW, Kanaar R, van de Loosdrecht AA, Vogl T, Raaijmakers MHGP. Mesenchymal inflammation drives genotoxic stress in hematopoietic stem cells and predicts disease evolution in human pre-leukemia. Cell Stem Cell. 2016;19:613–627. doi: 10.1016/j.stem.2016.08.021. [DOI] [PubMed] [Google Scholar]
- 9.Medyouf H, Mossner M, Jann JC, Nolte F, Raffel S, Herrmann C, Lier A, Eisen C, Nowak V, Zens B, Müdder K, Klein C, Obländer J, Fey S, Vogler J, Fabarius A, Riedl E, Roehl H, Kohlmann A, Staller M, Haferlach C, Müller N, John T, Platzbecker U, Metzgeroth G, Hofmann WK, Trumpp A, Nowak D. Myelodysplastic cells in patients reprogram mesenchymal stromal cells to establish a transplantable stem cell niche disease unit. Cell Stem Cell. 2014;14:824–837. doi: 10.1016/j.stem.2014.02.014. [DOI] [PubMed] [Google Scholar]
- 10.Wu X, Zhang X, Feng W, Feng H, Ding Z, Zhao Q, Li X, Tang N, Zhang P, Li J, Wang J. A targeted erythrocyte membrane-encapsulated drug-delivery system with anti-osteosarcoma and anti-osteolytic effects. ACS Appl Mater Interfaces. 2021;13:27920–27933. doi: 10.1021/acsami.1c06059. [DOI] [PubMed] [Google Scholar]
- 11.Wu Z, Zhang X, Chen D, Li Z, Wu X, Wang J, Deng Y. N6-methyladenosine-related lncRNAs are potential remodeling indicators in the tumor microenvironment and prognostic markers in osteosarcoma. Front Immunol. 2021;12:806189. doi: 10.3389/fimmu.2021.806189. [DOI] [PMC free article] [PubMed] [Google Scholar]
- 12.Zhong X, Li J, Wu X, Wu X, Hu L, Ding B, Qian L. Identification of N6-methyladenosine-related lncrnas for predicting overall survival and clustering of a potentially novel molecular subtype of breast cancer. Front Oncol. 2021;11:742944. doi: 10.3389/fonc.2021.742944. [DOI] [PMC free article] [PubMed] [Google Scholar]
- 13.Hanoun M, Zhang D, Mizoguchi T, Pinho S, Pierce H, Kunisaki Y, Lacombe J, Armstrong SA, Dührsen U, Frenette PS. Acute myelogenous leukemia-induced sympathetic neuropathy promotes malignancy in an altered hematopoietic stem cell niche. Cell Stem Cell. 2014;15:365–375. doi: 10.1016/j.stem.2014.06.020. [DOI] [PMC free article] [PubMed] [Google Scholar]
- 14.Duarte D, Hawkins ED, Akinduro O, Ang H, De Filippo K, Kong IY, Haltalli M, Ruivo N, Straszkowski L, Vervoort SJ, McLean C, Weber TS, Khorshed R, Pirillo C, Wei A, Ramasamy SK, Kusumbe AP, Duffy K, Adams RH, Purton LE, Carlin LM, Lo Celso C. Inhibition of endosteal vascular niche remodeling rescues hematopoietic stem cell loss in AML. Cell Stem Cell. 2018;22:64–77. doi: 10.1016/j.stem.2017.11.006. [DOI] [PMC free article] [PubMed] [Google Scholar]
- 15.Simon N, Friedman J, Hastie T, Tibshirani R. Regularization paths for cox’s proportional hazards model via coordinate descent. J Stat Softw. 2011;39:1–13. doi: 10.18637/jss.v039.i05. [DOI] [PMC free article] [PubMed] [Google Scholar]
- 16.Yu G, Wang LG, Han Y, He QY. clusterProfiler: an R package for comparing biological themes among gene clusters. Omics. 2012;16:284–287. doi: 10.1089/omi.2011.0118. [DOI] [PMC free article] [PubMed] [Google Scholar]
- 17.Yoshihara K, Shahmoradgoli M, Martínez E, Vegesna R, Kim H, Torres-Garcia W, Treviño V, Shen H, Laird PW, Levine DA, Carter SL, Getz G, Stemke-Hale K, Mills GB, Verhaak RG. Inferring tumour purity and stromal and immune cell admixture from expression data. Nat Commun. 2013;4:2612. doi: 10.1038/ncomms3612. [DOI] [PMC free article] [PubMed] [Google Scholar]
- 18.Dib L, San-Jose LM, Ducrest AL, Salamin N, Roulin A. Selection on the major color gene melanocortin-1-receptor shaped the evolution of the melanocortin system genes. Int J Mol Sci. 2017;18:2618. doi: 10.3390/ijms18122618. [DOI] [PMC free article] [PubMed] [Google Scholar]
- 19.Malta TM, Sokolov A, Gentles AJ, Burzykowski T, Poisson L, Weinstein JN, Kamińska B, Huelsken J, Omberg L, Gevaert O, Colaprico A, Czerwińska P, Mazurek S, Mishra L, Heyn H, Krasnitz A, Godwin AK, Lazar AJ, Stuart JM, Hoadley KA, Laird PW, Noushmehr H, Wiznerowicz M. Machine learning identifies stemness features associated with oncogenic dedifferentiation. Cell. 2018;173:338–354. doi: 10.1016/j.cell.2018.03.034. [DOI] [PMC free article] [PubMed] [Google Scholar]
- 20.Cai SF, Levine RL. Genetic and epigenetic determinants of AML pathogenesis. Semin Hematol. 2019;56:84–89. doi: 10.1053/j.seminhematol.2018.08.001. [DOI] [PMC free article] [PubMed] [Google Scholar]
- 21.Fu D, Zhang B, Wu S, Zhang Y, Xie J, Ning W, Jiang H. Prognosis and Characterization of immune microenvironment in acute myeloid leukemia through identification of an autophagy-related signature. Front Immunol. 2021;12:695865. doi: 10.3389/fimmu.2021.695865. [DOI] [PMC free article] [PubMed] [Google Scholar]
- 22.Fu D, Zhang B, Yang L, Huang S, Xin W. Development of an immune-related risk signature for predicting prognosis in lung squamous cell carcinoma. Front Genet. 2020;11:978. doi: 10.3389/fgene.2020.00978. [DOI] [PMC free article] [PubMed] [Google Scholar]
- 23.Zhao L, Zhang J, Qu X, Yang Y, Gong Z, Yang Y, Wu Z, Guo W. Microsatellite Instability-related ACVR2A mutations partially account for decreased lymph node metastasis in MSI-H gastric cancers. Onco Targets Ther. 2020;13:3809–3821. doi: 10.2147/OTT.S247757. [DOI] [PMC free article] [PubMed] [Google Scholar]
- 24.Hause RJ, Pritchard CC, Shendure J, Salipante SJ. Classification and characterization of microsatellite instability across 18 cancer types. Nat Med. 2016;22:1342–1350. doi: 10.1038/nm.4191. [DOI] [PubMed] [Google Scholar]
- 25.Rossi MR, Ionov Y, Bakin AV, Cowell JK. Truncating mutations in the ACVR2 gene attenuates activin signaling in prostate cancer cells. Cancer Genet Cytogenet. 2005;163:123–129. doi: 10.1016/j.cancergencyto.2005.05.007. [DOI] [PubMed] [Google Scholar]
- 26.Jung BH, Beck SE, Cabral J, Chau E, Cabrera BL, Fiorino A, Smith EJ, Bocanegra M, Carethers JM. Activin type 2 receptor restoration in MSI-H colon cancer suppresses growth and enhances migration with activin. Gastroenterology. 2007;132:633–644. doi: 10.1053/j.gastro.2006.11.018. [DOI] [PMC free article] [PubMed] [Google Scholar]
- 27.Nakagawa M, Schmitz R, Xiao W, Goldman CK, Xu W, Yang Y, Yu X, Waldmann TA, Staudt LM. Gain-of-function CCR4 mutations in adult T cell leukemia/lymphoma. J Exp Med. 2014;211:2497–2505. doi: 10.1084/jem.20140987. [DOI] [PMC free article] [PubMed] [Google Scholar]
- 28.Röhrle N, Knott MML, Anz D. CCL22 signaling in the tumor environment. Adv Exp Med Biol. 2020;1231:79–96. doi: 10.1007/978-3-030-36667-4_8. [DOI] [PubMed] [Google Scholar]
- 29.Gobert M, Treilleux I, Bendriss-Vermare N, Bachelot T, Goddard-Leon S, Arfi V, Biota C, Doffin AC, Durand I, Olive D, Perez S, Pasqual N, Faure C, Ray-Coquard I, Puisieux A, Caux C, Blay JY, Ménétrier-Caux C. Regulatory T cells recruited through CCL22/CCR4 are selectively activated in lymphoid infiltrates surrounding primary breast tumors and lead to an adverse clinical outcome. Cancer Res. 2009;69:2000–2009. doi: 10.1158/0008-5472.CAN-08-2360. [DOI] [PubMed] [Google Scholar]
- 30.Katsuya H, Cook LBM, Rowan AG, Satou Y, Taylor GP, Bangham CRM. Phosphatidylinositol 3-kinase-δ (PI3K-δ) is a potential therapeutic target in adult T-cell leukemia-lymphoma. Biomark Res. 2018;6:24. doi: 10.1186/s40364-018-0138-7. [DOI] [PMC free article] [PubMed] [Google Scholar]
- 31.Poleganov MA, Bachmann M, Pfeilschifter J, Mühl H. Genome-wide analysis displays marked induction of EBI3/IL-27B in IL-18-activated AML-derived KG1 cells: critical role of two kappaB binding sites in the human EBI3 promotor. Mol Immunol. 2008;45:2869–2880. doi: 10.1016/j.molimm.2008.01.021. [DOI] [PubMed] [Google Scholar]
- 32.Wang J, Tao Q, Wang H, Wang Z, Wu F, Pan Y, Tao L, Xiong S, Wang Y, Zhai Z. Elevated IL-35 in bone marrow of the patients with acute myeloid leukemia. Hum Immunol. 2015;76:681–686. doi: 10.1016/j.humimm.2015.09.020. [DOI] [PubMed] [Google Scholar]
- 33.Deng L, Jiang L, Lin XH, Tseng KF, Liu Y, Zhang X, Dong RH, Lu ZG, Wang XJ. The PI3K/mTOR dual inhibitor BEZ235 suppresses proliferation and migration and reverses multidrug resistance in acute myeloid leukemia. Acta Pharmacol Sin. 2017;38:382–391. doi: 10.1038/aps.2016.121. [DOI] [PMC free article] [PubMed] [Google Scholar]
- 34.Secker KA, Bruns L, Keppeler H, Jeong J, Hentrich T, Schulze-Hentrich JM, Mankel B, Fend F, Schneidawind D, Schneidawind C. Only hematopoietic stem and progenitor cells from cord blood are susceptible to malignant transformation by MLL-AF4 translocations. Cancers (Basel) 2020;12:1487. doi: 10.3390/cancers12061487. [DOI] [PMC free article] [PubMed] [Google Scholar]
- 35.Shankavaram UT, Reinhold WC, Nishizuka S, Major S, Morita D, Chary KK, Reimers MA, Scherf U, Kahn A, Dolginow D, Cossman J, Kaldjian EP, Scudiero DA, Petricoin E, Liotta L, Lee JK, Weinstein JN. Transcript and protein expression profiles of the NCI-60 cancer cell panel: an integromic microarray study. Mol Cancer Ther. 2007;6:820–832. doi: 10.1158/1535-7163.MCT-06-0650. [DOI] [PubMed] [Google Scholar]
- 36.Wang M, Wei X, Shi L, Chen B, Zhao G, Yang H. Integrative genomic analyses of the histamine H1 receptor and its role in cancer prediction. Int J Mol Med. 2014;33:1019–1026. doi: 10.3892/ijmm.2014.1649. [DOI] [PubMed] [Google Scholar]
- 37.Conrad C, Gregorio J, Wang YH, Ito T, Meller S, Hanabuchi S, Anderson S, Atkinson N, Ramirez PT, Liu YJ, Freedman R, Gilliet M. Plasmacytoid dendritic cells promote immunosuppression in ovarian cancer via ICOS costimulation of Foxp3(+) T-regulatory cells. Cancer Res. 2012;72:5240–5249. doi: 10.1158/0008-5472.CAN-12-2271. [DOI] [PMC free article] [PubMed] [Google Scholar]
- 38.Iwata R, Hyoung Lee J, Hayashi M, Dianzani U, Ofune K, Maruyama M, Oe S, Ito T, Hashiba T, Yoshimura K, Nonaka M, Nakano Y, Norian L, Nakano I, Asai A. ICOSLG-mediated regulatory T-cell expansion and IL-10 production promote progression of glioblastoma. Neuro Oncol. 2020;22:333–344. doi: 10.1093/neuonc/noz204. [DOI] [PMC free article] [PubMed] [Google Scholar]
- 39.Ozkazanc D, Yoyen-Ermis D, Tavukcuoglu E, Buyukasik Y, Esendagli G. Functional exhaustion of CD4(+) T cells induced by co-stimulatory signals from myeloid leukaemia cells. Immunology. 2016;149:460–471. doi: 10.1111/imm.12665. [DOI] [PMC free article] [PubMed] [Google Scholar]
- 40.Chen N, Xu Y, Mou J, Rao Q, Xing H, Tian Z, Tang K, Wang M, Wang J. Targeting of IL-10R on acute myeloid leukemia blasts with chimeric antigen receptor-expressing T cells. Blood Cancer J. 2021;11:144. doi: 10.1038/s41408-021-00536-x. [DOI] [PMC free article] [PubMed] [Google Scholar]
- 41.Abdel Mouti M, Pauklin S. TGFB1/INHBA Homodimer/Nodal-SMAD2/3 signaling network: a pivotal molecular target in PDAC treatment. Mol Ther. 2021;29:920–936. doi: 10.1016/j.ymthe.2021.01.002. [DOI] [PMC free article] [PubMed] [Google Scholar]
- 42.Si T, Lu Y, Li F, Jiang L, Pei R, Zhou JX. High expression of INHBA is an adverse prognostic factor for de novo acute myeloid leukemia. Leuk Lymphoma. 2018;59:114–120. doi: 10.1080/10428194.2017.1324157. [DOI] [PubMed] [Google Scholar]
- 43.Fuentes P, Sesé M, Guijarro PJ, Emperador M, Sánchez-Redondo S, Peinado H, Hümmer S, Ramón Y Cajal S. ITGB3-mediated uptake of small extracellular vesicles facilitates intercellular communication in breast cancer cells. Nat Commun. 2020;11:4261. doi: 10.1038/s41467-020-18081-9. [DOI] [PMC free article] [PubMed] [Google Scholar]
- 44.Zhang N, Ma D, Wang L, Zhu X, Pan Q, Zhao Y, Zhu W, Zhou J, Wang L, Chai Z, Ao J, Sun H, Tang Z. Insufficient radiofrequency ablation treated hepatocellular carcinoma cells promote metastasis by up-regulation ITGB3. J Cancer. 2017;8:3742–3754. doi: 10.7150/jca.20816. [DOI] [PMC free article] [PubMed] [Google Scholar]
- 45.Reich D, Kresinsky A, Müller JP, Bauer R, Kallenbach J, Schnoeder TM, Heidel FH, Fässler R, Mann M, Böhmer FD, Jayavelu AK. SHP1 regulates a STAT6-ITGB3 axis in FLT3ITD-positive AML cells. Leukemia. 2020;34:1444–1449. doi: 10.1038/s41375-019-0676-5. [DOI] [PubMed] [Google Scholar]
- 46.Alessandrini F, Pezzè L, Ciribilli Y. LAMPs: shedding light on cancer biology. Semin Oncol. 2017;44:239–253. doi: 10.1053/j.seminoncol.2017.10.013. [DOI] [PubMed] [Google Scholar]
- 47.Kanao H, Enomoto T, Kimura T, Fujita M, Nakashima R, Ueda Y, Ueno Y, Miyatake T, Yoshizaki T, Buzard GS, Tanigami A, Yoshino K, Murata Y. Overexpression of LAMP3/TSC403/DC-LAMP promotes metastasis in uterine cervical cancer. Cancer Res. 2005;65:8640–8645. doi: 10.1158/0008-5472.CAN-04-4112. [DOI] [PubMed] [Google Scholar]
- 48.Nagelkerke A, Mujcic H, Bussink J, Wouters BG, van Laarhoven HW, Sweep FC, Span PN. Hypoxic regulation and prognostic value of LAMP3 expression in breast cancer. Cancer. 2011;117:3670–3681. doi: 10.1002/cncr.25938. [DOI] [PubMed] [Google Scholar]
- 49.Iellem A, Mariani M, Lang R, Recalde H, Panina-Bordignon P, Sinigaglia F, D’Ambrosio D. Unique chemotactic response profile and specific expression of chemokine receptors CCR4 and CCR8 by CD4(+)CD25(+) regulatory T cells. J Exp Med. 2001;194:847–853. doi: 10.1084/jem.194.6.847. [DOI] [PMC free article] [PubMed] [Google Scholar]
- 50.Martinenaite E, Munir Ahmad S, Hansen M, Met Ö, Westergaard MW, Larsen SK, Klausen TW, Donia M, Svane IM, Andersen MH. CCL22-specific T Cells: modulating the immunosuppressive tumor microenvironment. Oncoimmunology. 2016;5:e1238541. doi: 10.1080/2162402X.2016.1238541. [DOI] [PMC free article] [PubMed] [Google Scholar]
- 51.Peña-Martínez P, Ramakrishnan R, Högberg C, Jansson C, Nord DG, Järås M. IL4 promotes phagocytosis of murine leukemia cells counteracted by CD47 upregulation. Haematologica. 2022;107:816–824. doi: 10.3324/haematol.2020.270421. [DOI] [PMC free article] [PubMed] [Google Scholar]
- 52.Hassan EM, Walker GC, Wang C, Zou S. Anti-leukemia effect associated with down-regulated CD47 and up-regulated calreticulin by stimulated macrophages in co-culture. Cancer Immunol Immunother. 2021;70:787–801. doi: 10.1007/s00262-020-02728-z. [DOI] [PMC free article] [PubMed] [Google Scholar]
- 53.Simonetti G, Angeli D, Petracci E, Fonzi E, Vedovato S, Sperotto A, Padella A, Ghetti M, Ferrari A, Robustelli V, Di Liddo R, Conconi MT, Papayannidis C, Cerchione C, Rondoni M, Astolfi A, Ottaviani E, Martinelli G, Gottardi M. Adrenomedullin expression characterizes leukemia stem cells and associates with an inflammatory signature in acute myeloid leukemia. Front Oncol. 2021;11:684396. doi: 10.3389/fonc.2021.684396. [DOI] [PMC free article] [PubMed] [Google Scholar]
- 54.Xi Y, Jingying D, Chenglong L, Hong Z, Rong Z, Xiaodong W, Chunsen W, Xiaobing H. Epigenetic therapy promotes the ratio of Th1/Th17 lineage to reverse immune evasion and treat leukemia relapse post-allogeneic stem cell transplantation in Non-APL AML patients. Front Mol Biosci. 2020;7:595395. doi: 10.3389/fmolb.2020.595395. [DOI] [PMC free article] [PubMed] [Google Scholar]
- 55.Liu Q, Hua M, Zhang C, Wang R, Liu J, Yang X, Han F, Hou M, Ma D. NLRP3-activated bone marrow dendritic cells play antileukemic roles via IL-1β/Th1/IFN-γ in acute myeloid leukemia. Cancer Lett. 2021;520:109–120. doi: 10.1016/j.canlet.2021.06.014. [DOI] [PubMed] [Google Scholar]
- 56.Dong Y, Han Y, Huang Y, Jiang S, Huang Z, Chen R, Yu Z, Yu K, Zhang S. PD-L1 is expressed and promotes the expansion of regulatory T cells in acute myeloid leukemia. Front Immunol. 2020;11:1710. doi: 10.3389/fimmu.2020.01710. [DOI] [PMC free article] [PubMed] [Google Scholar]
- 57.Dong Q, Li G, Fozza C, Wang S, Yang S, Sang Y, Liu X, Chen C. Levels and clinical significance of regulatory B Cells and T cells in acute myeloid leukemia. Biomed Res Int. 2020;2020:7023168. doi: 10.1155/2020/7023168. [DOI] [PMC free article] [PubMed] [Google Scholar]
- 58.Cha JH, Chan LC, Li CW, Hsu JL, Hung MC. Mechanisms controlling PD-L1 expression in cancer. Mol Cell. 2019;76:359–370. doi: 10.1016/j.molcel.2019.09.030. [DOI] [PMC free article] [PubMed] [Google Scholar]
- 59.Patsoukis N, Wang Q, Strauss L, Boussiotis VA. Revisiting the PD-1 pathway. Sci Adv. 2020;6:eabd2712. doi: 10.1126/sciadv.abd2712. [DOI] [PMC free article] [PubMed] [Google Scholar]
- 60.Topalian SL, Taube JM, Pardoll DM. Neoadjuvant checkpoint blockade for cancer immunotherapy. Science. 2020;367:eaax0182. doi: 10.1126/science.aax0182. [DOI] [PMC free article] [PubMed] [Google Scholar]
- 61.Chen C, Xu L, Gao R, Wang S, Zhang Y, Wang C, Zeng C, Li Y. Transcriptome-based co-expression of BRD4 and PD-1/PD-L1 predicts poor overall survival in patients with acute myeloid leukemia. Front Pharmacol. 2020;11:582955. doi: 10.3389/fphar.2020.582955. [DOI] [PMC free article] [PubMed] [Google Scholar]
- 62.Liang Y, Hannan R, Fu YX. Type I IFN activating type I dendritic cells for antitumor immunity. Clin Cancer Res. 2021;27:3818–3824. doi: 10.1158/1078-0432.CCR-20-2564. [DOI] [PubMed] [Google Scholar]
- 63.Zanker DJ, Owen KL, Baschuk N, Spurling AJ, Parker BS. Loss of type I IFN responsiveness impairs natural killer cell antitumor activity in breast cancer. Cancer Immunol Immunother. 2021;70:2125–2138. doi: 10.1007/s00262-021-02857-z. [DOI] [PMC free article] [PubMed] [Google Scholar]
- 64.Nakamura K, Karmokar A, Farrington PM, James NH, Ramos-Montoya A, Bickerton SJ, Hughes GD, Illidge TM, Cadogan EB, Davies BR, Dovedi SJ, Valge-Archer V. Inhibition of DNA-PK with AZD7648 sensitizes tumor cells to radiotherapy and induces type I IFN-dependent durable tumor control. Clin Cancer Res. 2021;27:4353–4366. doi: 10.1158/1078-0432.CCR-20-3701. [DOI] [PMC free article] [PubMed] [Google Scholar]
- 65.Liu M, Etherington MS, Hanna A, Medina BD, Vitiello GA, Bowler TG, Param NJ, Levin L, Rossi F, DeMatteo RP. Oncogenic KIT modulates type I IFN-mediated antitumor immunity in GIST. Cancer Immunol Res. 2021;9:542–553. doi: 10.1158/2326-6066.CIR-20-0692. [DOI] [PMC free article] [PubMed] [Google Scholar]
- 66.Gozgit JM, Vasbinder MM, Abo RP, Kunii K, Kuplast-Barr KG, Gui B, Lu AZ, Molina JR, Minissale E, Swinger KK, Wigle TJ, Blackwell DJ, Majer CR, Ren Y, Niepel M, Varsamis ZA, Nayak SP, Bamberg E, Mo JR, Church WD, Mady ASA, Song J, Utley L, Rao PE, Mitchison TJ, Kuntz KW, Richon VM, Keilhack H. PARP7 negatively regulates the type I interferon response in cancer cells and its inhibition triggers antitumor immunity. Cancer Cell. 2021;39:1214–1226. doi: 10.1016/j.ccell.2021.06.018. [DOI] [PubMed] [Google Scholar]
- 67.Gentles AJ, Newman AM, Liu CL, Bratman SV, Feng W, Kim D, Nair VS, Xu Y, Khuong A, Hoang CD, Diehn M, West RB, Plevritis SK, Alizadeh AA. The prognostic landscape of genes and infiltrating immune cells across human cancers. Nat Med. 2015;21:938–945. doi: 10.1038/nm.3909. [DOI] [PMC free article] [PubMed] [Google Scholar]
- 68.Kaymak I, Williams KS, Cantor JR, Jones RG. Immunometabolic interplay in the tumor microenvironment. Cancer Cell. 2021;39:28–37. doi: 10.1016/j.ccell.2020.09.004. [DOI] [PMC free article] [PubMed] [Google Scholar]
- 69.Campbell DJ, Koch MA. Phenotypical and functional specialization of FOXP3+ regulatory T cells. Nat Rev Immunol. 2011;11:119–130. doi: 10.1038/nri2916. [DOI] [PMC free article] [PubMed] [Google Scholar]
- 70.Lee HJ, Kim SN, Jeon MS, Yi T, Song SU. ICOSL expression in human bone marrow-derived mesenchymal stem cells promotes induction of regulatory T cells. Sci Rep. 2017;7:44486. doi: 10.1038/srep44486. [DOI] [PMC free article] [PubMed] [Google Scholar]
- 71.Han Y, Dong Y, Yang Q, Xu W, Jiang S, Yu Z, Yu K, Zhang S. Acute myeloid leukemia cells express ICOS ligand to promote the expansion of regulatory T cells. Front Immunol. 2018;9:2227. doi: 10.3389/fimmu.2018.02227. [DOI] [PMC free article] [PubMed] [Google Scholar]
- 72.Babaei G, Aziz SG, Jaghi NZZ. EMT, cancer stem cells and autophagy; the three main axes of metastasis. Biomed Pharmacother. 2021;133:110909. doi: 10.1016/j.biopha.2020.110909. [DOI] [PubMed] [Google Scholar]
- 73.Harris KS, Kerr BA. Prostate cancer stem cell markers drive progression, therapeutic resistance, and bone metastasis. Stem Cells Int. 2017;2017:8629234. doi: 10.1155/2017/8629234. [DOI] [PMC free article] [PubMed] [Google Scholar]
- 74.Chen P, Hsu WH, Han J, Xia Y, DePinho RA. Cancer stemness meets immunity: from mechanism to therapy. Cell Rep. 2021;34:108597. doi: 10.1016/j.celrep.2020.108597. [DOI] [PMC free article] [PubMed] [Google Scholar]
- 75.Wang JQ, Yang Y, Cai CY, Teng QX, Cui Q, Lin J, Assaraf YG, Chen ZS. Multidrug resistance proteins (MRPs): structure, function and the overcoming of cancer multidrug resistance. Drug Resist Updat. 2021;54:100743. doi: 10.1016/j.drup.2021.100743. [DOI] [PubMed] [Google Scholar]
Associated Data
This section collects any data citations, data availability statements, or supplementary materials included in this article.