Abstract
Background/Aim
Despite the emergence of cellular, animal, and clinical-based evidence demonstrating a link between hypoxia-inducible factor-1α (HIF-1α) and malignancy, the comprehensive assessment of HIF-1α in pan-cancer patients remains unclear, particularly regarding HIF-1α expression and its association with immune infiltration and immune checkpoint. The present study aimed to investigate the role of HIF-1α expression in various types of malignancies through bioinformatics analysis.
Materials and Methods
We investigated the expression and prognostic value of HIF-1α in pan-cancer based on the TCGA (The Cancer Genome Atlas) dataset. The abundance of immune infiltration was estimated by xCell immune deconvolution methods. We investigated the relationship of HIF-1α expression with immune infiltration and immune checkpoint gene expression, with a focus on gastric adenocarcinoma (STAD) and lung squamous cell carcinoma (LUSC).
Results
HIF-1α expression had different effects on the prognosis of various cancers. In contrast to the protective effect of HIF-1α expression in LUSC, high levels of HIF-1α expression played a detrimental role in the survival of STAD patients. There was a significant positive correlation between HIF-1α expression and immune infiltration in STAD patients, including regulatory T-cells (Tregs), T-cell CD4+ Th2, neutrophils, M1 and M2 macrophages. In addition, immune checkpoint molecules showed different HIF-1α-related profiles in various carcinomas.
Conclusion
A relatively comprehensive view of the oncogenic role of HIF-1α in various tumors based on a pan-cancer analysis is provided in this study. HIF-1α may be considered a poor prognostic biomarker for STAD and, moreover, it may be involved in regulating tumor immune infiltration.
Keywords: Hypoxia, HIF-1α, cancer prognosis, immune infiltration, immune checkpoint
Hypoxia is defined as a pathological phenomenon that occurs when the tissues of the body do not receive enough oxygen or cannot use it efficiently (1). Surprisingly, however, hypoxia is a typical feature of most solid tumors. Hypoxia is closely associated with tumor proliferation, differentiation, epithelial-mesenchymal transition, angiogenesis, energy metabolic pattern switching, immune response, resistance to conventional therapy, genetic instability, and ultimately poor prognosis (2). Despite this, little is known about the underlying molecular mechanisms of how tumor cells respond to a hypoxic environment. Hypoxia-inducible transcription factors (HIFs) are central regulators of tumor cell adaptation to the hypoxic environment (3). Due to the intricate mechanisms of tumorigenesis, it is valuable to investigate any target gene pan-cancerously and assess its relationship with clinical prognosis and, more importantly, the underlying functional molecular mechanisms.
A large body of evidence suggests that solid tumors frequently experience hypoxic stress. It was initially identified as a regulatory element controlling erythropoietin (EPO) production in the blood system. Currently, HIFs are widely recognized as essential controllers of the tumor response to hypoxic stress (4). HIFs are heterodimers that include oxygen-sensitive alpha subunits (HIF-1α, HIF-2α, and HIF-3α) and constitutively expressed beta subunits (HIF1β, also called ARNT1). In contrast to HIF-2α and HIF-3α, HIF-1α is commonly expressed in all cells (5,6). HIF-1α is generally overexpressed in human malignant cells; however, this depends on the type of cancer. Many investigations have shown that patients with tumors with high HIF-1α expression have a poor prognosis. Therefore HIF-1α is used as a biomarker for tumor treatment response assessment (7,8).
The recent development of immunotherapy has opened another period of modern cancer treatment. Cancer immunotherapy aims to stimulate the human immune system to eliminate cancer cells. However, due to the complexity of the tumor microenvironment, only a minority of patients benefit from immunotherapy. It is undeniable that hypoxia is crucial for the development of successful cancer immunotherapy (9). Fluctuations in oxygen stress and metabolic patterns in tumors produce unique barriers that limit the function and phenotype of immune cells. For example, the HIF-1α signaling pathway plays a central role in the biological function of macrophages. HIF-1α plays different roles in the different subtypes of macrophages, M1 and M2. In M1 macrophages, HIF-1α is fundamental for the maintenance of glycolysis and energy metabolism (10). Hypoxic exosomes derived from pancreatic malignancy cells activate the conversion of macrophages to the M2 subtype in a HIF-1α-dependent manner, which subsequently promotes the migration, invasion, and epithelial-to-mesenchymal transition of pancreatic cancer cells (11). To re-establish the anti-tumor response of T cells, the development of hostile monoclonal antibodies blocking immune checkpoints has become a hot topic in tumor immunotherapy. So far, monoclonal antibodies specific for CTLA4 and PD-1 have been shown to restore T-cell function and have achieved encouraging therapeutic results in patients with various malignancies (12). Although immune checkpoint inhibitor (ICI) therapy has made breakthroughs, it is not without exceptions and does not work ideally for all patients. There is an urgent need to discover better markers to predict the response to ICI therapy.
In the present investigation, we focused on the different expression profiles of HIF-1α in various tumors and its prognostic value. We then explored the potential relationship between HIF-1α expression and tumor immune infiltration levels. The findings from this study suggest that HIF-1α is a prognostic biomarker for various malignant tumors and it also may be the underlying mechanism involved in the regulation of tumor immune infiltration in the tumor microenvironment.
Materials and Methods
HIF-1α gene expression profile analysis. We used the “Gene_DE” module in the TIMER2 database (http://timer.cistrome.org/) to explore the differential mRNA expression profile between multiple types of tumor tissues and adjacent normal tissues of The Cancer Genome Atlas (TCGA) network. For the tumor types that lacked normal matched tissues, such as diffuse large B-cell lymphoma (DLBC), acute myeloid leukemia (LAML), and low-grade glioma (LGG), the online Gene Expression Profiling Interactive Analysis (GEPIA) (http://gepia2.cancer-pku.cn/#analysis) was utilized to visualize the mRNA expression levels of HIF-1α in these tumor types. Specifically, we put “HIF1A” as the gene symbol. The box plot function in expression analysis was utilized to obtain the box expression diagram of HIF-1α between various tumors and corresponding normal tissues based on the TCGA and Genotype-tissue expression (GTEx) databases. The statistical parameters were as follows: the Log2FC (Fold change) cutoff value was set as 1, and the p-value cutoff value was 0.01.
Survival prognosis analysis. The Kaplan-Meier Plotter (http://kmplot.com/analysis/) (13) was utilized to dissect the relationship of indicated gene expression level with overall survival (OS) and relapse-free survival (RFS) in multiple types of cancers. The effects of multi-level clinicopathological factors and HIF-1α expression on the prognosis of gastric cancer patients was also based on the analysis of the Kaplan-Meier plotter database.
Immune infiltration analysis. The mRNA expression data (RNA-Seq) of 33 types of human tumors and corresponding normal tissues were downloaded from the Genomic Data Commons (GDC) information gateway site (https://portal.gdc.cancer.gov/). To systematically and comprehensively analyze the immune infiltration of various cancer types, the abundance of immune infiltration was estimated by xCell immune deconvolution methods. R software v4.0.3 was used for statistical analysis and a p-value <0.05 was considered statistically significant.
Next, we also used the Gene module to examine the connection between HIF-1α expression and the abundance of immune infiltrates in gastric adenocarcinoma (STAD) and lung squamous cell carcinoma (LUSC) based on the TIMER database (https://cistrome.shinyapps.io/timer/). The scatter plot was obtained to show the Spearman rho value and statistical significance of the tumor purity corrected. Moreover, we employed the TIMER database to draw the Kaplan-Meier curve based on the level of immune infiltration to visualize differences in survival prognosis. The median immune infiltration was set as the threshold to distinguish between low-level and high-level tumor-infiltrating immune cells.
Then, OS and PFS analysis based on the HIF-1α expression level, as well as on the levels of tumor-infiltrating cells (B-cells, CD4+ memory T-cells, CD8+ T-cells, macrophages, natural killer T-cells, regulatory T-cells (Tregs), type 1 T-helper cells, type 2 T-helper cells) was evaluated in STAD and LUSC patients using the Kaplan-Meier plotter.
Relationship between HIF-1α expression and immune cell markers based on the TIMER and GEPIA data sets. We further investigated the correlation between the expression of HIF-1α and the expression levels of multiple immune cell markers in STAD and LUSC, based on TIMER2 and GEPIA2 (http://gepia2.cancer-pku.cn/#correlation) databases. More specifically, the immune cell markers used were initially selected to combine the information from the R&D SYSTEM (https://www.rndsystems.com/cn/resources/cell-markers/immune-cells) and Abcam (https://www.abcam.com/primary-antibodies/immune-cell-markers-poster). For TIMER2 analysis, the Gene_Corr module was used to explore Spearman’s rho value and p-value between the HIF-1α gene and a set of immune marker genes in various cancer types. Similarly, in the GEPIA2 database, the correlation analysis between the expression of the HIF-1α gene and specific immune cell markers in STAD and LUSC tumor samples and corresponding normal samples was conducted. The Spearman correlation test was employed to ascertain the correlation coefficient.
Immune checkpoint analysis. We extracted the expression data of 8 immune checkpoint-related genes (SIGLEC15, TIGIT, CD274, HAVCR2, PDCD1, CTLA4, LAG3, and PDCD1LG2) in STAD and LUSC tumor tissue samples, and normal samples from the TCGA and GTEx. Gene expression differences between the two groups were calculated by the Wilcox test. The prognostic value of these 8 immune checkpoint-related genes was further assessed in STAD and LUSC based on the Kaplan-Meier Plotter database.
Statistical analysis. For gene expression analysis, statistical significance was calculated by the Wilcoxon test. The Kaplan–Meier method was utilized to assess survival outcomes. Gene expression correlation analysis was evaluated by Spearman’s rank test. A p-value <0.05 was considered as a statistically significant threshold if there is no special note.
Results
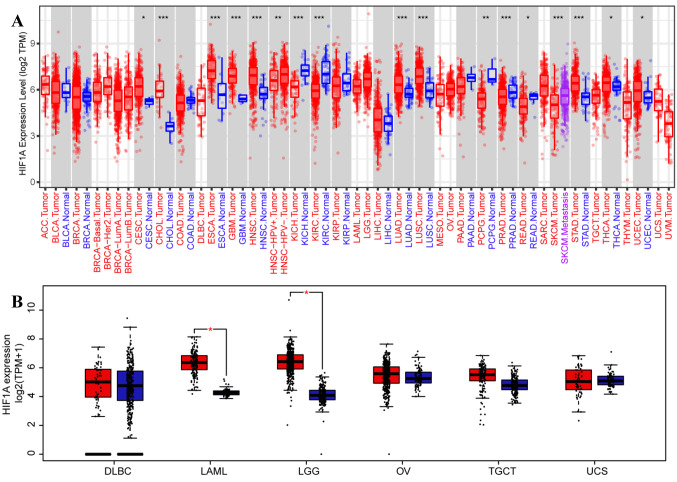
Pan-cancer analysis of HIF-1α mRNA expression profile. We first applied the TIMER2-dependent analysis of the TCGA database to analyze the mRNA expression levels of HIF-1α in different malignant tumor types. As shown in Figure 1A, the mRNA expression level of HIF-1α in the carcinoma tissues of cholangiocarcinoma (CHOL) (p<0.001), esophageal carcinoma (ESCA) (p<0.001), glioblastoma multiforme (GBM) (p<0.001), head and neck squamous cell carcinoma (HNSC) (p<0.001), lung adenocarcinoma (LUAD) (p<0.001), LUSC (p<0.001), STAD (p<0.001), cervical squamous cell carcinoma and endocervical adenocarcinoma (CESC) (p=0.046), thyroid carcinoma (THCA) (p=0.011), uterine corpus endometrial carcinoma (UCEC) (p=0.018) was significantly higher than the corresponding normal tissues. In contrast, the mRNA expression of HIF-1α was significantly decreased in kidney chromophobe (KICH) (p<0.001), kidney renal clear cell carcinoma (KIRC) (p<0.001), pancreatic adenocarcinoma (PAAD) (p<0.001), pheochromocytoma and paraganglioma (PCPG) (p=0.006) and rectum adenocarcinoma (READ) (p=0.016), compared to the corresponding normal tissues.
Figure 1. HIF-1α expression levels in human carcinomas based on pan-cancer analysis. The mRNA expression level of HIF-1α in various cancers or certain cancer subtypes was analyzed by TIMER2 based on the TCGA database. *p<0.05, **p<0.01, ***p<0.001 (A). The expression level of HIF1α in indicated cancer tissues and normal tissues (based on TCGA normal and GTEx data) was analyzed by the GEPIA web tool, with the pvalue=0.01 as the cutoff (B). TCGA: The Cancer Genome Atlas; GTEx: genotype-tissue expression project.
After matching TCGA normal and GTEx data, the patients were divided into low- and high-expression groups, using the median value of HIF-1α expression level as a threshold. As shown in Figure 1B, mRNA expression of HIF-1α was increased in acute myeloid leukemia (LAML) and brain lower-grade glioma (LGG), compared to corresponding normal tissues (p<0.01).
HIF-1α survival analysis in pan-cancer. Next, we aimed to assess the prognostic value of HIF-1α in various types of human cancers. First, we divided tumor cases into high and low expression groups according to the mRNA expression of HIF-1α. Then, the relationship between HIF-1α expression and prognosis of tumor patients was evaluated.
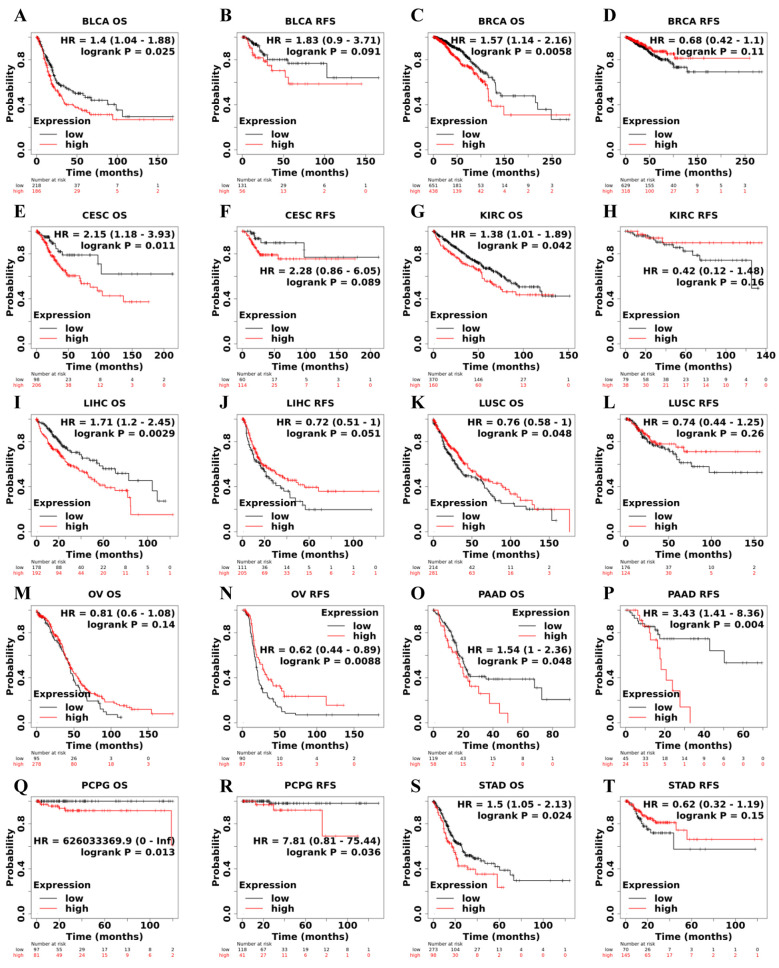
According to microarray analysis in the Kaplan- Meier Plotter database, in terms of OS, HIF-1α expression was shown to play a detrimental role in 8 types of cancer including bladder urothelial carcinoma (BLCA) (p=0.025) (Figure 2A), breast invasive carcinoma (BRCA) (p=0.0058) (Figure 2C), CESC (p=0.011) (Figure 2E), KIRC (p=0.042) (Figure 2G), liver hepatocellular carcinoma (LIHC) (p=0.0029) (Figure 2I), pancreatic adenocarcinoma (PAAD) (p=0.048) (Figure 2O), PCPG (p=0.013) (Figure 2Q) and STAD (p=0.024) (Figure 2S). In contrast, HIF-1α expression owed a protective role in LUSC (p=0.048) (Figure 2K). In the RFS analysis, high expression of HIF-1α related to poor RFS prognosis in PAAD (p=0.004) (Figure 2P), PCPG (p=0.036) (Figure 2R), while it had a significant protective role in ovarian serous cystadenocarcinoma (OV) (p=0.0088) (Figure 2N).
Figure 2. Correlation between HIF-1α expression and survival prognosis of cancers based on Kaplan-Meier Plotter database. Overall survival (OS) and relapse-free survival (RFS) Kaplan–Meier curves analyses by HIF-1α gene expression were supplied in bladder urothelial carcinoma (BLCA) (A, B), breast invasive carcinoma (BRCA) (C, D), cervical squamous cell carcinoma and endocervical adenocarcinoma (CESC) (E, F), kidney renal clear cell carcinoma (KIRC) (G, H), liver hepatocellular carcinoma (LIHC) (I, J), lung squamous cell carcinoma (LUSC) (K, L), ovarian serous cystadenocarcinoma (OV) (M, N), pancreatic adenocarcinoma (PAAD) (O, P), pheochromocytoma and paraganglioma (PCPG) (Q, R), stomach adenocarcinoma (STAD) (S, T). Hazard ratio (HR) with 95% confidence interval (CI) and p-value from the log-rank test are shown in the curve.
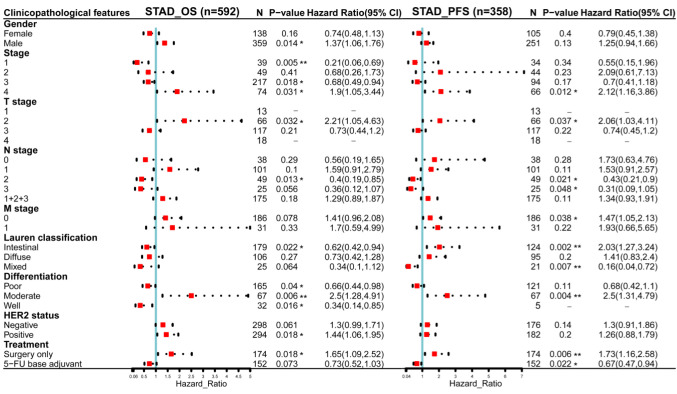
The relationship between HIF-1α expression and multifaceted clinicopathological features in STAD. Since the mRNA expression of HIF-1α was significantly higher in gastric cancer than in normal tissues and the increased HIF-1α expression was significantly associated with poor prognosis of STAD patients, we examined the association between HIF-1α expression level and several clinical characteristics of STAD patients, by incorporating clinical and pathological data in the Kaplan-Meier Plotter, based on the Kaplan-Meier survival analysis. As shown in Figure 3, for OS, HIF-1α plays an unfavorable role in STAD patients with the following clinicopathological factors: male, stage 4, T2 stage, moderate differentiation, HER2 positive status, and surgery only groups. Regarding PFS, HIF-1α was shown to have detrimental effects in gastric cancer patients with stage 4, T2 stage, M0 stage, intestinal Lauren classification, moderate differentiation, and surgery only treatment.
Figure 3. Association of HIF-1α mRNA expression level with OS (n=592) and PFS (n=358) in stomach adenocarcinoma with multifaceted clinicopathological characteristics. Red squares represent the hazard ratios (HR); the horizontal dotted line indicates the corresponding 95% confidence intervals (CIs). OS, Overall survival; PFS, progression-free survival. *p<0.05; **p<0.01. ***p<0.001.
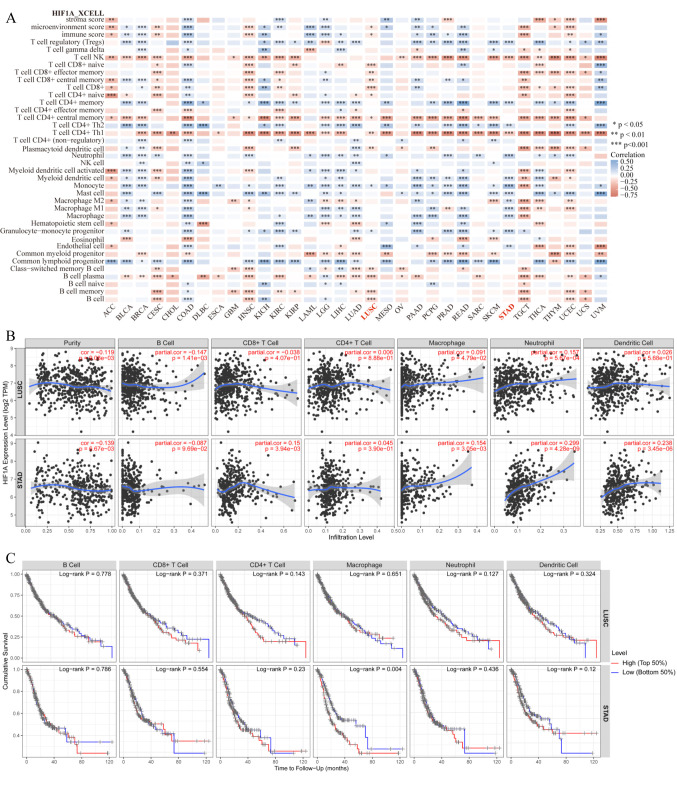
HIF-1α expression correlated with immune cell infiltration in tumor. To reliably assess the correlation between HIF-1α and tumor immunity, we used the latest xCell algorithm. As shown in Figure 4A, according to the results of the xCELL score, a significant negative interaction between the expression level of HIF-1α and the level of NK-T cell immune infiltration was observed in 23/33 cancer types and CD4+ Th1 T-cell immune infiltration in 27/33 cancer types. On the other hand, we observed a significant positive correlation between the levels of HIF-1α and CD4+ Th2 T cells in 18/33 types of tumor.
Figure 4. Correlation of HIF-1α expression with different immune infiltration levels in human carcinomas. Spearman correlation analysis heat map of multiple immune infiltrations and HIF-1α gene expression across diverse tumor tissues, where the horizontal axis represents different tumor tissues, the vertical axis represents different immune scores based on xCell algorithm, different colors represent correlation coefficients; negative values represent negative correlations, positive values represent positive correlation. The larger the correlation coefficient, the darker the color, *p<0.05, **p<0.01, ***p<0.001 (A). Different correlations between HIF-1α expression and the level of immune infiltration in stomach adenocarcinoma (STAD) or lung squamous cell carcinoma (LUSC) (B). Kaplan-Meier survival curve of multiple immune infiltrations in stomach adenocarcinoma (STAD) or lung squamous cell carcinoma (LUSC) (C).
According to the above results, elevated expression level of HIF-1α was a risk factor of poor prognosis in STAD, while high expression level of HIF-1α was a protective factor in LUSC. For STAD, the HIF-1α expression level was significantly positively correlated with the infiltration level of T cell CD4+ memory (r=0.192, p=0.0002), myeloid dendritic cell (r=0.178, p=0.0006), endothelial cell (r=0.163, p=0.0016), granulocyte-monocyte progenitor (r=0.253, p<0.001), macrophage (r=0.219, p<0.001), macrophage M1(r=0.192, p=0.0002), macrophage M2 (r=0.156, p=0.0024), mast cell (r=0.182, p=0.0004), monocyte (r=0.385, p<0.001), neutrophil (r=0.261, p<0.001), T cell CD4+ Th2 (r=0.165, p=0.0014) and T cell regulatory (Tregs) (r=0.212, p<0.001). In contrast, for LUSC, the expression level of HIF-1α was significantly negatively correlated to B cell (r=–0.155, p=0.0005), T cell CD4+ naive (r=–0.09, p=0.0436), T cell CD4+ central memory (r=–0.105, p=0.0192), T cell CD8+ naive (r=–0.175, p<0.001), T cell CD8+ (r=–0.211, p=<0.001), T cell CD8+ central memory (r=–0.134, p=0.0026), T cell CD8+ effector memory (r=–0.134, p=0.0027) and B cell memory (r=–0.181, p=<0.001).
We explored the relationship between HIF-1α expression and immune infiltration in STAD and LUSC based on the TIMER database. Consistent with the above results, the Gene module showed that HIF-1α expression was significantly associated with macrophage, neutrophil, and dendritic cell infiltration in STAD. In contrast, HIF-1α expression had no notable correlation with macrophage, neutrophil, and dendritic cell infiltration in LUSC (Figure 4B). Next, we further evaluated the relationship between immune infiltration and the clinical prognosis of patients with STAD and LUSC. As it was expected, high levels of macrophages were significantly associated with poor prognosis in patients with STAD (p=0.004). However, no significant correlation between tumor immune infiltration level and OS in patients with LUSC was observed (Figure 4C).
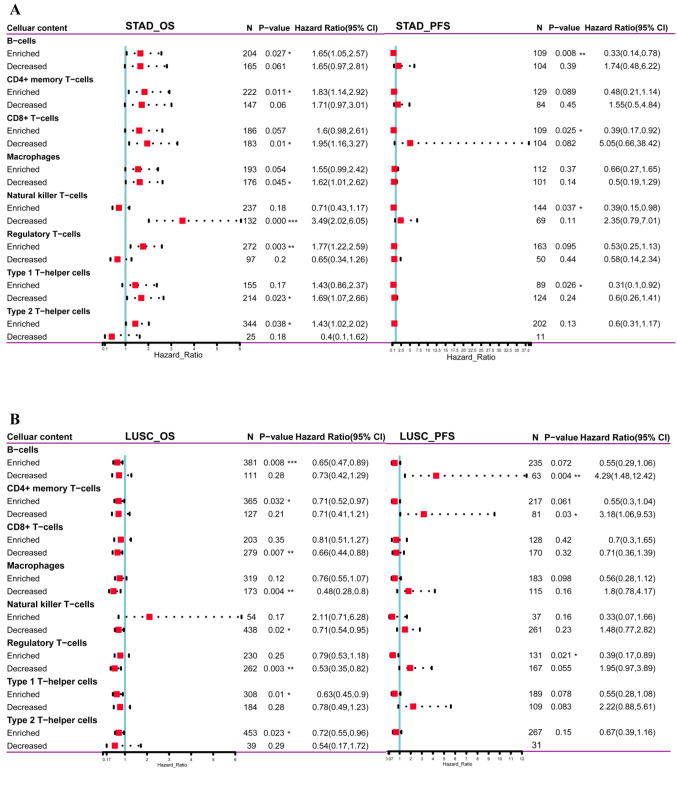
HIF-1α associated with immune infiltration predicted survival prognosis in STAD and LUSC. Furthermore, to explore the clinical relevance of tumor-infiltrating immune cells, we conducted Kaplan-Meier survival analysis for OS and PFS based on the immune-cell infiltration levels (immune cell types: B-cells, CD4+ memory T-cells, CD8+ T-cells, macrophages, natural killer T-cells, regulatory T-cells, type 1 T-helper cells, type 2 T-helper cells) in STAD and LUSC patients. HIF-1α gene expression was used as a covariate in the model. As shown in Figure 5A, HIF-1αhigh expression with B-cellsenriched, CD4+ memory T-cellsenriched, regulatory T-cellsenriched, type 2 T-helper cellsenriched was associated with shorter OS in STAD patients. In contrast, HIF-1αhigh expression combined with CD8+ T-cellsdecreased, natural killer T-cellsdecreased, type 1 T-helper cellsdecreased, related to poorer OS in STAD patients. In PFS analysis, HIF-1αlow expression with B-cellsenriched, CD8+ T-cellsenriched, natural killer T-cellsenriched, type 1 T-helper cellsenriched predicted a favorable outcome in STAD patients.
Figure 5. HIF-1α associated with immune infiltration predicted survival prognosis in STAD and LUSC based on the Kaplan-Meier plotter database. OS and PFS survival analysis of HIF-1α expression combined with immune cell (B-cells, CD4+ memory T-cells, CD8+ T-cells, macrophages, natural killer T-cells, regulatory T-cells, type 1 T-helper cells, type 2 T-helper cells) infiltration level in STAD patients (A). OS and PFS survival analysis of HIF-1α expression combined with immune cell (B-cells, CD4+ memory T-cells, CD8+ T-cells, macrophages, natural killer T-cells, regulatory T-cells, type 1 T-helper cells, type 2 T-helper cells) infiltration level in LUSC patients (B). Red squares represent the hazard ratios (HR); horizontal dotted line indicates the corresponding 95% confidence intervals (CIs). STAD, stomach adenocarcinoma; OS, overall survival; PFS, progression-free survival. *p<0.05; **p<0.01; ***p<0.001.
In LUSC patients (Figure 5B), HIF-1αhigh expression with B-cellsenriched, CD4+ memory T-cellsenriched, type 1 T-helper cells enriched, type 2 T-helper cells enriched, CD8+ T-cellsdecreased, macrophagesdecreased, natural killer T-cellsdecreased, regulatory T-cellsdecreased showed better OS, compared to those with low HIF-1α expression. In addition, HIF-1αhigh expression with B-cellsdecreased, CD4+ memory T-cellsdecreased was significantly associated with poorer PFS, compared to HIF-1αlow expression. While HIF-1αhigh expression with regulatory T-cellsenriched presented better PFS, compared to HIF-1αlow expression patients. The above results suggest that HIF-1α may affect the prognosis of cancer patients by participating in the regulation of immune cell infiltration.
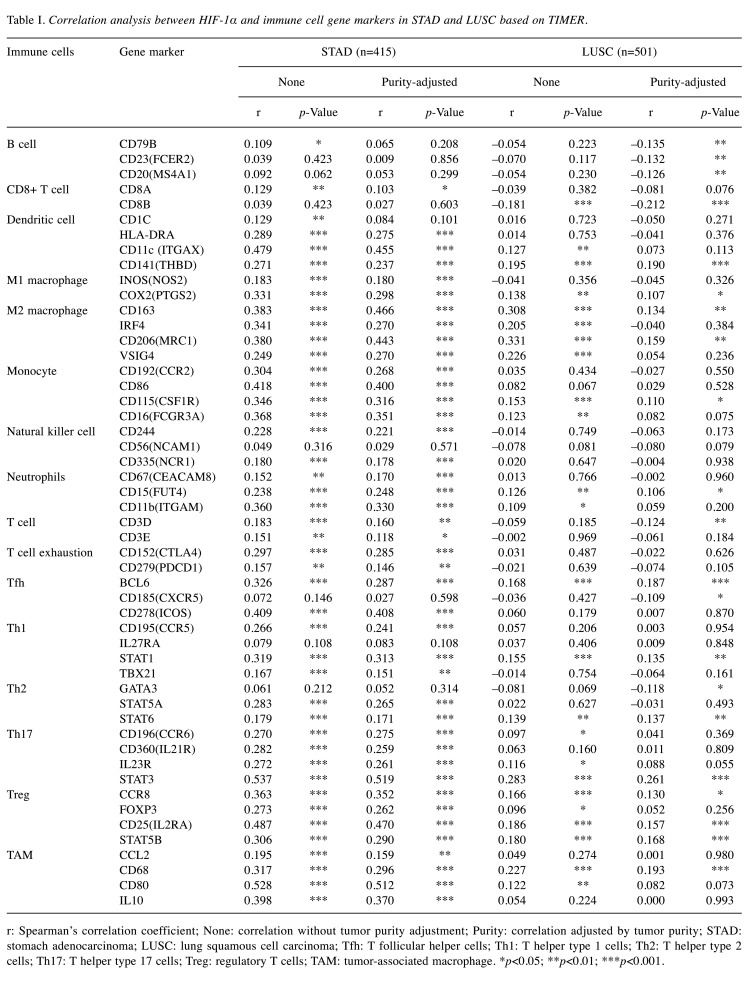
The relationship between HIF-1α and tumor immune markers. Τo further explore the potential relationship between HIF-1α and infiltrating immune cells in STAD and LUSC, we studied the correlation between HIF-1α expression and several immune cell gene markers based on the TIMER2 online public database. Specifically, we evaluated the correlation between HIF-1α expression and the levels of 16 specific immune subpopulation cell markers, including B cell, CD8+ T cell, dendritic cell, M1 macrophage, M2 macrophage, monocyte, natural killer cell, neutrophils, T cell, T cell exhaustion, follicular T-helper (Tfh), Th1, Th2, Th17, Treg and tumor-associated macrophages (TAMs). As shown in Table I, after adjusting tumor purity, the expression level of HIF-1α was significantly associated with 42 out of 51 immune cell markers in STAD and 21 of the 51 immune cell markers in LUSC. More specifically, in STAD cases, HIF-1α expression showed a significant positive relationship with CD8+ T cell marker (CD8A), dendritic cell markers (HLA-DRA, ITGAX, THBD), M1 macrophage markers (NOS2, PTGS2), M2 macrophage markers (CD163, IRF4, MRC1, VSIG4), monocyte markers (CCR2, CD86, CSF1R, FCGR3A), natural killer cell markers (CD244, NCR1), neutrophils markers (CEACAM8, FUT4, ITGAM), T cell markers (CD3D, CD3E), T cell exhaustion markers (CTLA4, PDCD1), Tfh markers (BCL6, ICOS), Th1 markers (CCR5, STAT1, TBX21), Th2 markers (STAT5A, STAT6), Th17 markers (CCR6, IL21R, IL23R, STAT3), Treg markers (CCR8, FOXP3, IL2RA, STAT5B) and TAM markers (CCL2, CD68, CD80, IL10). On the other hand, in LUSC cases, HIF-1α expression was significantly associated with less tumor-infiltrating immune cell type markers, including dendritic cells, monocyte, natural killer cell, and neutrophil markers. Furthermore, the expression of HIF-1α in STAD and LUSC was also contrastingly related to the infiltration of helper T cells including Tfh, Th1, Th2, Th17, which are known to play an indispensable role in the adaptive immune response (14). High expression of HIF-1α was also related to the expression of T cell exhaustion markers CTAL4 and PDCD1 in STAD.
Table I. Correlation analysis between HIF-1α and immune cell gene markers in STAD and LUSC based on TIMER.
r: Spearman’s correlation coefficient; None: correlation without tumor purity adjustment; Purity: correlation adjusted by tumor purity; STAD: stomach adenocarcinoma; LUSC: lung squamous cell carcinoma; Tfh: T follicular helper cells; Th1: T helper type 1 cells; Th2: T helper type 2 cells; Th17: T helper type 17 cells; Treg: regulatory T cells; TAM: tumor-associated macrophage. *p<0.05; **p<0.01; ***p<0.001.
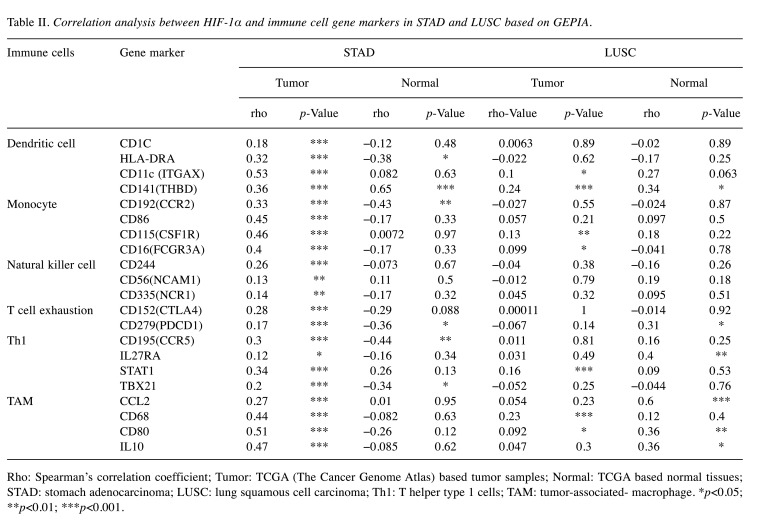
The correlation between HIF-1α and gene markers of dendritic cells, monocyte, natural killer cell, T cell exhaustion, Th1, TAM immune cells was further investigated in the GEPIA2 database. As shown in Table II, HIF-1α had a stronger correlation with the above immune cell-related markers in STAD than in LUSC. Therefore, these results strongly confirm our hypothesis that the correlation between the expression of HIF-1α and the level of immune cell infiltration may play a role in the differences in the prognosis of cancer patients.
Table II. Correlation analysis between HIF-1α and immune cell gene markers in STAD and LUSC based on GEPIA.
Rho: Spearman’s correlation coefficient; Tumor: TCGA (The Cancer Genome Atlas) based tumor samples; Normal: TCGA based normal tissues; STAD: stomach adenocarcinoma; LUSC: lung squamous cell carcinoma; Th1: T helper type 1 cells; TAM: tumor-associated- macrophage. *p<0.05; **p<0.01; ***p<0.001.
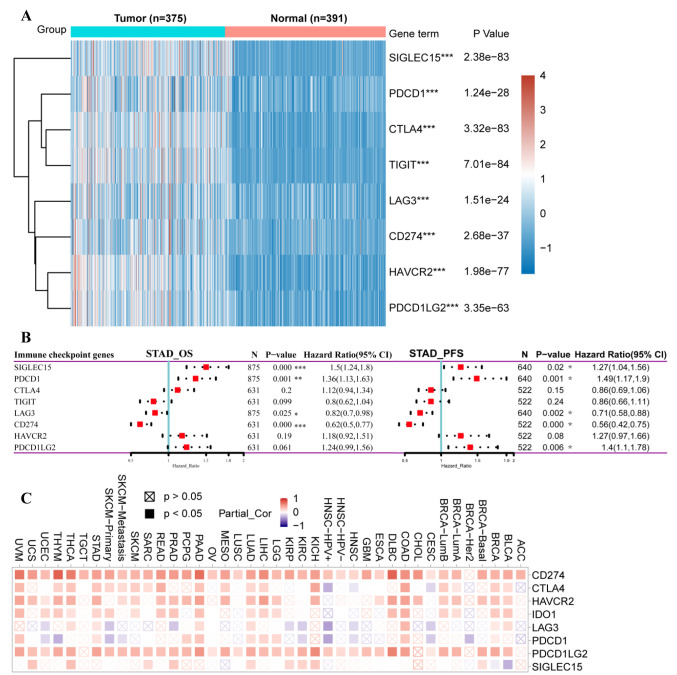
Immune checkpoint analysis. We initially evaluated the expression of selected immune checkpoint-related genes in STAD tumor tissues compared to normal samples from TCGA and GTEx. The results showed significant up-regulation of all immune checkpoint-related gene expressions in STAD than in normal tissues (Figure 6A). Then, we examined the prognostic significance of multiple immune checkpoint molecules in STAD based on Kaplan-Meier Plotter. In the OS analysis, 4 out of 8 immune checkpoint molecules were significantly related to the prognosis of STAD. Specifically, SIGLEC15 and PDCD1 played a detrimental role, while, LAG3 and CD274 were associated with a better prognosis in STAD patients. In the PFS analysis, beyond SIGLEC15 and PDCD1, the expression of PDCD1LG2 was also associated with a poorer prognosis in patients with gastric cancer. Similarly, the high expression of LAG3 and CD274 showed a protective effect (Figure 6B). Next, by using the TIMER2 database, we explored the relationship between HIF-1α expression and the above 8 immune checkpoint molecules across different types of cancers. As shown in Figure 6C, for STAD, the expression of HIF-1α is significantly positively associated with the expression of CD274 (r=0.502, p=2.20E-116), CTLA4 (r=0.313, p=7.18E-10), HAVCR2 (r=0.429, p=2.2E-116), LAG3 (r=0.182, p=0.0004029), PDCD1 (r=0.158, p=0.0021284), PDCD1LG2 (r=0.488, p=2.20E-116), TIGIT (r=0.22, p=1.84E-05). However, for LUSC, the expression of HIF-1α is found to be only linked with the expression of CD274 (r=0.199, p=7.85E-06), PDCD1LG2 (r=0.192, p=1.62E-05). The above results indicate that HIF-1α may affect the prognosis of cancer patients through differential interactions with the immune checkpoint molecular.
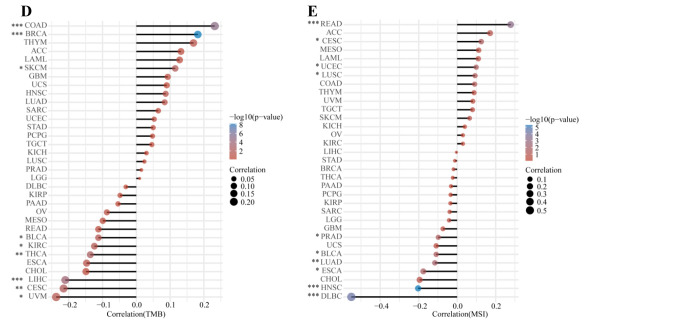
Figure 6. The correlation between HIF-1α expression and levels of immune checkpoint, TMB, and MSI gene expression. (A) Comparison of expression levels of immune checkpoint genes, including SIGLEC15, TIGIT, CD274, HAVCR2, PDCD1, CTLA4, LAG3, and PDCD1LG2 in STAD tumor (n=375) and normal tissues (n=391). (B) Kaplan Meier survival analysis of OS and PFS based on the immune checkpoint gene expression levels in STAD patients. (C) The relationship between HIF-1α expression and level of immune checkpoint genes across multiple human cancers based on TIMER2 database. Spearman correlation analysis of TMB (D), MSI (E) and HIF-1α gene expression. The horizontal axis in the figure represents the correlation coefficient between HIF-1α expression and TMB, MSI level, the ordinate is different tumor types, the size of the dot in the figure represents the value of the correlation coefficient, and the different colors represent the significance of the p-value (blue color represents small p-value). *p<0.05; **p<0.05; ***p<0.001. TMB, Tumor mutational burden; MSI, microsatellite instability; STAD, stomach adenocarcinoma; OS, overall survival; PFS, progression-free survival.
We comprehensively inspected the correlation between HIF-1α expression and TMB or MSI level in 33 types of cancers. Our results demonstrated that increased HIF-1α expression was significantly associated with TMB in COAD, BRAC, and SKCM. While, decreased expression of HIF-1α was significantly related to TMB in BLCA, KIRC, THCA, LIHC, CESC, and UVM (Figure 6D). Meanwhile, a significant relationship between HIF-1α expression and MSI was found in READ, CESC, UCEC, and LUSC. In comparison, a negative correlation between HIF-1α expression and MSI was observed in PRAD, BLCA, LUAD, ESCA, HNSC, and DLBC (Figure 6E).
Discussion
As a critical constituent of the tumor microenvironment, hypoxia is ubiquitous in most solid tumors, leads to local and systemic cancer progression, and is involved in treatment resistance and poor prognosis (4). Hypoxia is related to local vascular infiltration, distant metastasis, hyposensitivity to radiotherapy, resistance to multiple anti-tumor drugs, and ultimately leads to poor prognosis in many cancer patients (15). Interestingly, cancer cells can grow under reduced oxygen supply through a series of intracellular adaptive biochemical reactions. For example, under in vitro experimental conditions, in glioblastoma cells exposed to a hypoxic environment for a long time, the level of glycolysis was observed to be significantly up-regulated, confirming that the metabolic pathways of tumor cells can be adapted to changes in the external microenvironment (16). HIF-1α is one of the core transcriptional regulators involved in the adaptive metabolic response of tumors to hypoxia (17). It is reported that as a subunit of hypoxia-inducible factor-1 (HIF1), HIF-1α is widely involved in tumor progression, including breast (18), colorectal (19), esophageal (20), glioblastoma (21), kidney (22), liver (23), lung (24), gastric (25) and pancreatic (26) cancer. However, in the pathogenesis of certain tumor progression, whether HIF-1α plays a role by activating specific shared signaling pathways is still unclear. Even in different tumors, HIF-1α plays a double-edged sword role, suggesting that the impact of HIF-1α on tumors is heterogeneous. Therefore, this strongly prompted us to comprehensively examine the HIF-1α gene in a total of 33 different tumors based on the TCGA database.
First, we observed that HIF-1α is highly expressed in most solid tumors, compared to the corresponding normal tissues, confirming that the expression of HIF-1α is up-regulated in a hypoxic tumor environment. Nevertheless, the high expression of the HIF-1α gene and its effect on survival and prognosis are not consistent in different tumors. We employed the Kaplan-Meier Plotter database to perform survival analysis based on the HIF-1α mRNA expression in different tumors. Our research suggested that HIF-1α may play a detrimental role in the bladder, breast, cervical, kidney, liver, and gastric cancer. However, HIF-1α appeared to play a protective role in lung squamous cell cancer, ovarian serous cystadenocarcinoma, and cutaneous skin melanoma. Furthermore, for gastric cancer, elevated HIF-1α expression was associated with a poorer OS outcome, as well as with male gender, stage 4, T2 stage, and HER2 positive status. Although our study provides a broad view of the relationship between HIF-1α and the survival prognosis of cancer patients, future studies still need to explore the underlying detailed downstream mechanisms.
Consistently with our study, previous research has demonstrated that the positive expression of HIF-1α was observed at the invasive tumor edge in 90% of human gastric cancer samples (27). In vivo experiments also proved that the migration and the invasion ability of HIF-1α knock-out gastric cells were significantly reduced, suggesting that HIF-1α may act a pivotal part in the local invasion of gastric cancer (27). These results indicate that HIF-1α may be a valuable biomarker for the prognosis of STAD. A previous study has shown that HIF-1α is generally highly expressed in non-small cell lung cancer (NSCLC) (27). This HIF-1α expression pattern was shown to be related to micro tumor angiogenesis and poor prognosis. The researchers further confirmed a strong correlation between high expression of HIF-1α and expression of vascular endothelial growth factor (VEGF) (24). LUSC is a common clinical subtype of NSCLC. Because of different histopathological subtypes (lung adenocarcinoma and squamous cell carcinoma), this variability leads to different lung cancer patients’ responses to chemotherapy and survival prognosis. This has been supported by a previous study, which demonstrated that the expression of HIF-1α is significantly different among different subtypes of lung cancer. The typical nuclear expression of HIF-1α was elevated considerably in squamous cell carcinoma, compared to adenocarcinoma. More strikingly, their analysis showed that in adenocarcinoma rather than squamous cell carcinoma, there was a significant association between HIF-1α expression status and tumor T stage (28). This study found the correlation between low HIF-1α expression and poor OS, suggesting a protective role of HIF-1α in LUSC.
Another core finding of the present study is that HIF-1α expression was associated with different degrees of immune infiltration in pan-cancer. In STAD, we found that HIF-1α expression positively associated with the infiltration level of Tregs, CD4+ memory T cells, Th2, dendritic cells, monocytes, macrophages, M1 macrophages, M2 macrophages and endothelial cells. In addition, we performed tumor purity correction analysis to improve the sensitivity of immune infiltration analysis. We found that HIF-1α expression was slightly negatively correlated with tumor purity, partly because hypoxia is one of the essential components of the tumor microenvironment. After adjusting tumor purity, HIF-1α expression was still strongly correlated with the level of macrophage, neutrophil, and dendritic cell infiltration. We further showed that macrophage infiltration was significantly related to the prognosis of gastric cancer.
Due to the characteristics of suppressing effector T cells and suppressing immune-mediated inflammation, it is undeniable that the infiltration of Treg cells participates in the formation of tumor immunosuppressive microenvironment, which is currently one of the main obstacles to tumor immunotherapy (29,30). Hypoxia can reprogram the biological and physicochemical properties of Tregs, leading to a significant secretion of immunosuppressive cytokines and mediating the suppression of anti-tumor immune response (31). Macrophages not only defend against invading pathogens from the external environment but also participate in maintaining homeostasis. In addition, macrophages may have specific functions depending on the resident tissue and heterogeneous gene expression profile. The abnormal activation of macrophages is associated with chronic inflammations, autoimmune diseases, and dramatic tumor progression (32). In this study, we have observed that the level of macrophage infiltration in gastric cancer was associated with poor prognosis and HIF-1α expression. In addition, HIF-1α in STAD had a significant relation to macrophage M1 markers (INOS, COX2) and macrophage M2 markers (CD163, IRF4, and CD206), suggesting that the expression of HIF-1α may affect the prognosis of patients with gastric cancer by regulating the function of macrophages within the tumor microenvironment. A recent study proves the crucial role of HIF-1α in macrophage-mediated immune resistance in patients with gastric cancer, they demonstrated that the conventional anti-tumor drug 5-fluorouracil (5-FU) can up-regulate the expression of HIF-1α in gastric cancer cells, the abnormal activation of this HIF-1α signaling pathway further up-regulates the expression of high mobility group box 1 (HMGB1) protein, thereby specifically recruiting macrophage M2 (33). Dendritic cells are a heterogeneous cell population that plays a vital role in innate and adaptive immune responses. They act as classical antigen-presenting cells and produce specific effector cytokines to regulate T cell activation. In addition, clinical-grade exosome preparations derived from dendritic cells have been applied to immunotherapy clinical trials for NSCLC cancer patients (34). In this study, we also found that HIF-1α positively correlated with the infiltration of dendritic cells in STAD. More specifically. after adjusting the purity of the tumor, HIF-1α expression was positively associated with dendritic cell markers, including HLA-DRA and CD11c, in STAD.
Checkpoint blocking immunotherapy has been approved for the treatment of various malignant tumors, mainly anti-PD-1 and anti-CTLA4 monoclonal antibody therapies. Beyond PD-1 and CTAL4, exploring other specific immune checkpoint molecules is becoming a hot research topic. In recent pre-clinical trials, some novel immune checkpoint indicators including T-cell immunoglobulin and immunoreceptor tyrosine-based inhibitory motif domain (TIGIT) (35), lymphocyte-activation gene 3 (LAG3) (36), hepatitis A virus cellular receptor2 (HAVCR2) (37) and sialic acid-binding immunoglobulin-like lectin 15 (SIGLEC15) (38) have been identified. In this research, we demonstrated the expression of multi-immune checkpoint genes, such as SIGLEC15, TIGIT, CD274, HAVCR2, PDCD1, CTLA4, LAG3, and PDCD1LG2, was significantly over-expressed in STAD tissues than in normal tissues. In addition, SIGLEC15 and PDCD1 expressions were significantly associated with poor OS and PFS in STAD patients. SIGLEC15 is becoming a novel immunotherapy target independent of anti-PD-1/PD-L1 immune checkpoints. The preliminary results of the phase I clinical trial showed that the anti-SIGLEC15 monoclonal antibody, NC318, had achieved encouraging results in a variety of tumors, including non-small cell lung cancer (39). Targeting Siglec-15 is paving the way for future immunotherapy, especially for those cancer patients who have no expected response to PD-1/PD-L1 treatment (39). High levels of PD-L1 are expressed in various types of cancer. Abnormal activation of PD-1/PD-L1 signaling dominates tumor evasion from T cell immunity (40). Although the clinical application of PD-1/PD-L1 immunotherapy is still far from reaching everyone’s expectations, this new type of therapy has shown encouraging anti-cancer effects. However, there are still many problems to be solved in applying this new type of therapy. For example, PD-1/PD-L1 immunotherapy works better in specific cancer treatments and the efficiency is only 20-40% for most cancers (41). Therefore, a deeper understanding of the PD-L1 regulatory mechanism may offer more excellent benefits to cancer patients. Previous research has shown that HIF-1α can up-regulate the mRNA expression level of PDCD1LG2 by directly binding to the hypoxia response element (HRE) in the PD-L1 proximal promoter region. It was also confirmed that the specific blocking of PD-L1 by monoclonal antibodies under hypoxic conditions eliminated the MDSC-mediated T cell suppression effect (42). In our study, the expression of immune checkpoint molecules, including PDCD1 and PDCD1LG2, were significantly increased in the HIF-1α high expression group compared to the low expression group, in STAD. Therefore, the combination of PD-L1 blockade and HIF-1α inhibition may provide novel ideas for future gastric cancer immunotherapy.
Studying the modulation of immunotherapy by the tumor microenvironment can help us discover the mechanisms and reasons for the poor response of certain malignancies to immunotherapy, and thus improve the efficacy of this treatment immunotherapy. The hypoxic microenvironment mediates tumor resistance to conventional chemotherapy and radiotherapy and plays a critical role in immunotherapy resistance. The hypoxic acidic microenvironment, which is unique to solid tumors, negatively regulates the activation and response of the immune response and affects the efficacy of tumor immunotherapy (43). Investigating the regulatory mechanism of hypoxic acidic microenvironment on immune effector cells and interfering with its inhibitory effect on immune response may be a new approach to improve the effectiveness of immunotherapy.
Conclusion
In summary, our pan-cancer analysis of HIF-1α showed the statistical correlation between HIF-1α expression and clinical prognosis, immune cell infiltration, and immune checkpoints across multiple carcinomas. HIF-1α may serve as an effective cancer prognostic biomarker related to immune infiltration. Importantly, simultaneous HIF-1α suppression and immune checkpoint blockade may become a novel approach for immunotherapy of patients with gastric cancer shortly.
Conflicts of Interest
The Authors declare that they have no competing interests.
Authors’ Contributions
TK and LR designed this study. TK extracted the information from the databases. TK analyzed the data. LQ supervised the entire study. TK and LR wrote the manuscript. All authors revised the manuscript.
Acknowledgements
We sincerely thank the author’s forever lover Dr. Wan for her psychological counseling during the author’s writing.
Data Availability Statements
Publicly available datasets were analyzed in this study. These data can be found here: https://portal.gdc.cancer.gov/ https://cistrome.shinyapps.io/timer/ http://timer.cistrome.org/ http://gepia.cancer-pku.cn/index.html http://gepia2.cancer-pku.cn/#index https://kmplot.com/analysis/index.php?p=background https://string-db.org/
References
- 1.Taylor CT, Pouyssegur J. Oxygen, hypoxia, and stress. Ann NY Acad Sci. 2007;1113:87–94. doi: 10.1196/annals.1391.004. [DOI] [PubMed] [Google Scholar]
- 2.Wigerup C, Påhlman S, Bexell D. Therapeutic targeting of hypoxia and hypoxia-inducible factors in cancer. Pharmacol Ther. 2016;164:152–169. doi: 10.1016/j.pharmthera.2016.04.009. [DOI] [PubMed] [Google Scholar]
- 3.Schito L, Semenza GL. Hypoxia-inducible factors: master regulators of cancer progression. Trends Cancer. 2016;2(12):758–770. doi: 10.1016/j.trecan.2016.10.016. [DOI] [PubMed] [Google Scholar]
- 4.Jing X, Yang F, Shao C, Wei K, Xie M, Shen H, Shu Y. Role of hypoxia in cancer therapy by regulating the tumor microenvironment. Mol Cancer. 2019;18(1):157. doi: 10.1186/s12943-019-1089-9. [DOI] [PMC free article] [PubMed] [Google Scholar]
- 5.Majmundar AJ, Wong WJ, Simon MC. Hypoxia-inducible factors and the response to hypoxic stress. Mol Cell. 2010;40(2):294–309. doi: 10.1016/j.molcel.2010.09.022. [DOI] [PMC free article] [PubMed] [Google Scholar]
- 6.Zhong H, De Marzo AM, Laughner E, Lim M, Hilton DA, Zagzag D, Buechler P, Isaacs WB, Semenza GL, Simons JW. Overexpression of hypoxia-inducible factor 1alpha in common human cancers and their metastases. Cancer Res. 1999;59(22):5830–5835. [PubMed] [Google Scholar]
- 7.Boso D, Rampazzo E, Zanon C, Bresolin S, Maule F, Porcù E, Cani A, Della Puppa A, Trentin L, Basso G, Persano L. HIF-1α/Wnt signaling-dependent control of gene transcription regulates neuronal differentiation of glioblastoma stem cells. Theranostics. 2019;9(17):4860–4877. doi: 10.7150/thno.35882. [DOI] [PMC free article] [PubMed] [Google Scholar]
- 8.Kimura S, Kitadai Y, Tanaka S, Kuwai T, Hihara J, Yoshida K, Toge T, Chayama K. Expression of hypoxia-inducible factor (HIF)-1alpha is associated with vascular endothelial growth factor expression and tumour angiogenesis in human oesophageal squamous cell carcinoma. Eur J Cancer. 2004;40(12):1904–1912. doi: 10.1016/j.ejca.2004.04.035. [DOI] [PubMed] [Google Scholar]
- 9.Daniel SK, Sullivan KM, Labadie KP, Pillarisetty VG. Hypoxia as a barrier to immunotherapy in pancreatic adenocarcinoma. Clin Transl Med. 2019;8(1):10. doi: 10.1186/s40169-019-0226-9. [DOI] [PMC free article] [PubMed] [Google Scholar]
- 10.Cramer T, Yamanishi Y, Clausen BE, Förster I, Pawlinski R, Mackman N, Haase VH, Jaenisch R, Corr M, Nizet V, Firestein GS, Gerber HP, Ferrara N, Johnson RS. HIF-1alpha is essential for myeloid cell-mediated inflammation. Cell. 2003;112(5):645–657. doi: 10.1016/s0092-8674(03)00154-5. [DOI] [PMC free article] [PubMed] [Google Scholar]
- 11.Wang X, Luo G, Zhang K, Cao J, Huang C, Jiang T, Liu B, Su L, Qiu Z. Hypoxic Tumor-Derived Exosomal miR-301a Mediates M2 Macrophage Polarization via PTEN/PI3Kγ to Promote Pancreatic Cancer Metastasis. Cancer Res. 2018;78(16):4586–4598. doi: 10.1158/0008-5472.CAN-17-3841. [DOI] [PubMed] [Google Scholar]
- 12.Topalian SL, Taube JM, Anders RA, Pardoll DM. Mechanism-driven biomarkers to guide immune checkpoint blockade in cancer therapy. Nat Rev Cancer. 2016;16(5):275–287. doi: 10.1038/nrc.2016.36. [DOI] [PMC free article] [PubMed] [Google Scholar]
- 13.Nagy Á, Munkácsy G, Győrffy B. Pancancer survival analysis of cancer hallmark genes. Sci Rep. 2021;11(1):6047. doi: 10.1038/s41598-021-84787-5. [DOI] [PMC free article] [PubMed] [Google Scholar]
- 14.Vinuesa CG, Linterman MA, Yu D, MacLennan IC. Follicular Helper T Cells. Annu Rev Immunol. 2016;34:335–368. doi: 10.1146/annurev-immunol-041015-055605. [DOI] [PubMed] [Google Scholar]
- 15.Vaupel P, Mayer A, Höckel M. Tumor hypoxia and malignant progression. Methods Enzymol. 2004;381:335–354. doi: 10.1016/S0076-6879(04)81023-1. [DOI] [PubMed] [Google Scholar]
- 16.Talasila KM, Røsland GV, Hagland HR, Eskilsson E, Flønes IH, Fritah S, Azuaje F, Atai N, Harter PN, Mittelbronn M, Andersen M, Joseph JV, Hossain JA, Vallar L, Noorden CJ, Niclou SP, Thorsen F, Tronstad KJ, Tzoulis C, Bjerkvig R, Miletic H. The angiogenic switch leads to a metabolic shift in human glioblastoma. Neuro Oncol. 2017;19(3):383–393. doi: 10.1093/neuonc/now175. [DOI] [PMC free article] [PubMed] [Google Scholar]
- 17.Semenza GL. Targeting HIF-1 for cancer therapy. Nat Rev Cancer. 2003;3(10):721–732. doi: 10.1038/nrc1187. [DOI] [PubMed] [Google Scholar]
- 18.Chen X, Iliopoulos D, Zhang Q, Tang Q, Greenblatt MB, Hatziapostolou M, Lim E, Tam WL, Ni M, Chen Y, Mai J, Shen H, Hu DZ, Adoro S, Hu B, Song M, Tan C, Landis MD, Ferrari M, Shin SJ, Brown M, Chang JC, Liu XS, Glimcher LH. XBP1 promotes triple-negative breast cancer by controlling the HIF1α pathway. Nature. 2014;508(7494):103–107. doi: 10.1038/nature13119. [DOI] [PMC free article] [PubMed] [Google Scholar]
- 19.Tang YA, Chen YF, Bao Y, Mahara S, Yatim SMJM, Oguz G, Lee PL, Feng M, Cai Y, Tan EY, Fong SS, Yang ZH, Lan P, Wu XJ, Yu Q. Hypoxic tumor microenvironment activates GLI2 via HIF-1α and TGF-β2 to promote chemoresistance in colorectal cancer. Proc Natl Acad Sci U S A. 2018;115(26):E5990–E5999. doi: 10.1073/pnas.1801348115. [DOI] [PMC free article] [PubMed] [Google Scholar]
- 20.Ma S, Lu CC, Yang LY, Wang JJ, Wang BS, Cai HQ, Hao JJ, Xu X, Cai Y, Zhang Y, Wang MR. ANXA2 promotes esophageal cancer progression by activating MYC-HIF1A-VEGF axis. J Exp Clin Cancer Res. 2018;37(1):183. doi: 10.1186/s13046-018-0851-y. [DOI] [PMC free article] [PubMed] [Google Scholar]
- 21.Miska J, Lee-Chang C, Rashidi A, Muroski ME, Chang AL, Lopez-Rosas A, Zhang P, Panek WK, Cordero A, Han Y, Ahmed AU, Chandel NS, Lesniak MS. HIF-1α is a metabolic switch between glycolytic-driven migration and oxidative phosphorylation-driven immunosuppression of tregs in glioblastoma. Cell Rep. 2019;27(1):226–237.e4. doi: 10.1016/j.celrep.2019.03.029. [DOI] [PMC free article] [PubMed] [Google Scholar]
- 22.Kondo Y, Hamada J, Kobayashi C, Nakamura R, Suzuki Y, Kimata R, Nishimura T, Kitagawa T, Kunimoto M, Imura N, Hara S. Over expression of hypoxia-inducible factor-1alpha in renal and bladder cancer cells increases tumorigenic potency. J Urol. 2005;173(5):1762–1766. doi: 10.1097/01.ju.0000154343.35444.09. [DOI] [PubMed] [Google Scholar]
- 23.Song Z, Liu T, Chen J, Ge C, Zhao F, Zhu M, Chen T, Cui Y, Tian H, Yao M, Li J, Li H. HIF-1α-induced RIT1 promotes liver cancer growth and metastasis and its deficiency increases sensitivity to sorafenib. Cancer Lett. 2019;460:96–107. doi: 10.1016/j.canlet.2019.06.016. [DOI] [PubMed] [Google Scholar]
- 24.Giatromanolaki A, Koukourakis MI, Sivridis E, Turley H, Talks K, Pezzella F, Gatter KC, Harris AL. Relation of hypoxia inducible factor 1 alpha and 2 alpha in operable non-small cell lung cancer to angiogenic/molecular profile of tumours and survival. Br J Cancer. 2001;85(6):881–890. doi: 10.1054/bjoc.2001.2018. [DOI] [PMC free article] [PubMed] [Google Scholar]
- 25.Song IS, Wang AG, Yoon SY, Kim JM, Kim JH, Lee DS, Kim NS. Regulation of glucose metabolism-related genes and VEGF by HIF-1alpha and HIF-1beta, but not HIF-2alpha, in gastric cancer. Exp Mol Med. 2009;41(1):51–58. doi: 10.3858/emm.2009.41.1.007. [DOI] [PMC free article] [PubMed] [Google Scholar]
- 26.Hoffmann AC, Mori R, Vallbohmer D, Brabender J, Klein E, Drebber U, Baldus SE, Cooc J, Azuma M, Metzger R, Hoelscher AH, Danenberg KD, Prenzel KL, Danenberg PV. High expression of HIF1a is a predictor of clinical outcome in patients with pancreatic ductal adenocarcinomas and correlated to PDGFA, VEGF, and bFGF. Neoplasia. 2008;10(7):674–679. doi: 10.1593/neo.08292. [DOI] [PMC free article] [PubMed] [Google Scholar]
- 27.Rohwer N, Lobitz S, Daskalow K, Jöns T, Vieth M, Schlag PM, Kemmner W, Wiedenmann B, Cramer T, Höcker M. HIF-1alpha determines the metastatic potential of gastric cancer cells. Br J Cancer. 2009;100(5):772–781. doi: 10.1038/sj.bjc.6604919. [DOI] [PMC free article] [PubMed] [Google Scholar]
- 28.Karetsi E, Ioannou MG, Kerenidi T, Minas M, Molyvdas PA, Gourgoulianis KI, Paraskeva E. Differential expression of hypoxia-inducible factor 1α in non-small cell lung cancer and small cell lung cancer. Clinics (Sao Paulo) 2012;67(12):1373–1378. doi: 10.6061/clinics/2012(12)05. [DOI] [PMC free article] [PubMed] [Google Scholar]
- 29.Barbi J, Pardoll D, Pan F. Treg functional stability and its responsiveness to the microenvironment. Immunol Rev. 2014;259(1):115–139. doi: 10.1111/imr.12172. [DOI] [PMC free article] [PubMed] [Google Scholar]
- 30.Knochelmann HM, Dwyer CJ, Bailey SR, Amaya SM, Elston DM, Mazza-McCrann JM, Paulos CM. When worlds collide: Th17 and Treg cells in cancer and autoimmunity. Cell Mol Immunol. 2018;15(5):458–469. doi: 10.1038/s41423-018-0004-4. [DOI] [PMC free article] [PubMed] [Google Scholar]
- 31.Wang YA, Li XL, Mo YZ, Fan CM, Tang L, Xiong F, Guo C, Xiang B, Zhou M, Ma J, Huang X, Wu X, Li Y, Li GY, Zeng ZY, Xiong W. Effects of tumor metabolic microenvironment on regulatory T cells. Mol Cancer. 2018;17(1):168. doi: 10.1186/s12943-018-0913-y. [DOI] [PMC free article] [PubMed] [Google Scholar]
- 32.Vitale I, Manic G, Coussens LM, Kroemer G, Galluzzi L. Macrophages and metabolism in the tumor microenvironment. Cell Metab. 2019;30(1):36–50. doi: 10.1016/j.cmet.2019.06.001. [DOI] [PubMed] [Google Scholar]
- 33.Yu S, Li Q, Yu Y, Cui Y, Li W, Liu T, Liu F. Activated HIF1α of tumor cells promotes chemoresistance development via recruiting GDF15-producing tumor-associated macrophages in gastric cancer. Cancer Immunol Immunother. 2020;69(10):1973–1987. doi: 10.1007/s00262-020-02598-5. [DOI] [PMC free article] [PubMed] [Google Scholar]
- 34.Besse B, Charrier M, Lapierre V, Dansin E, Lantz O, Planchard D, Le Chevalier T, Livartoski A, Barlesi F, Laplanche A, Ploix S, Vimond N, Peguillet I, Théry C, Lacroix L, Zoernig I, Dhodapkar K, Dhodapkar M, Viaud S, Soria JC, Reiners KS, Pogge von Strandmann E, Vély F, Rusakiewicz S, Eggermont A, Pitt JM, Zitvogel L, Chaput N. Dendritic cell-derived exosomes as maintenance immunotherapy after first line chemotherapy in NSCLC. Oncoimmunology. 2015;5(4):e1071008. doi: 10.1080/2162402X.2015.1071008. [DOI] [PMC free article] [PubMed] [Google Scholar]
- 35.Fathi M, Pustokhina I, Kuznetsov SV, Khayrullin M, Hojjat-Farsangi M, Karpisheh V, Jalili A, Jadidi-Niaragh F. T-cell immunoglobulin and ITIM domain, as a potential immune checkpoint target for immunotherapy of colorectal cancer. IUBMB Life. 2021;73(5):726–738. doi: 10.1002/iub.2461. [DOI] [PubMed] [Google Scholar]
- 36.Ruffo E, Wu RC, Bruno TC, Workman CJ, Vignali DAA. Lymphocyte-activation gene 3 (LAG3): The next immune checkpoint receptor. Semin Immunol. 2019;42:101305. doi: 10.1016/j.smim.2019.101305. [DOI] [PMC free article] [PubMed] [Google Scholar]
- 37.Das M, Zhu C, Kuchroo VK. Tim-3 and its role in regulating anti-tumor immunity. Immunol Rev. 2017;276(1):97–111. doi: 10.1111/imr.12520. [DOI] [PMC free article] [PubMed] [Google Scholar]
- 38.Wang J, Sun J, Liu LN, Flies DB, Nie X, Toki M, Zhang J, Song C, Zarr M, Zhou X, Han X, Archer KA, O’Neill T, Herbst RS, Boto AN, Sanmamed MF, Langermann S, Rimm DL, Chen L. Siglec-15 as an immune suppressor and potential target for normalization cancer immunotherapy. Nat Med. 2019;25(4):656–666. doi: 10.1038/s41591-019-0374-x. [DOI] [PMC free article] [PubMed] [Google Scholar]
- 39.Siglec-15 An attractive immunotherapy target. Cancer Discov. 2020;10(1):7–8. doi: 10.1158/2159-8290.CD-NB2019-136. [DOI] [PubMed] [Google Scholar]
- 40.Cha JH, Chan LC, Li CW, Hsu JL, Hung MC. Mechanisms controlling PD-L1 expression in cancer. Mol Cell. 2019;76(3):359–370. doi: 10.1016/j.molcel.2019.09.030. [DOI] [PMC free article] [PubMed] [Google Scholar]
- 41.Lei Q, Wang D, Sun K, Wang L, Zhang Y. Resistance mechanisms of anti-PD1/PDL1 therapy in solid tumors. Front Cell Dev Biol. 2020;8:672. doi: 10.3389/fcell.2020.00672. [DOI] [PMC free article] [PubMed] [Google Scholar]
- 42.Noman MZ, Desantis G, Janji B, Hasmim M, Karray S, Dessen P, Bronte V, Chouaib S. PD-L1 is a novel direct target of HIF-1α, and its blockade under hypoxia enhanced MDSC-mediated T cell activation. J Exp Med. 2014;211(5):781–790. doi: 10.1084/jem.20131916. [DOI] [PMC free article] [PubMed] [Google Scholar]
- 43.Graham K, Unger E. Overcoming tumor hypoxia as a barrier to radiotherapy, chemotherapy and immunotherapy in cancer treatment. Int J Nanomedicine. 2018;13:6049–6058. doi: 10.2147/IJN.S140462. [DOI] [PMC free article] [PubMed] [Google Scholar]
Associated Data
This section collects any data citations, data availability statements, or supplementary materials included in this article.
Data Availability Statement
Publicly available datasets were analyzed in this study. These data can be found here: https://portal.gdc.cancer.gov/ https://cistrome.shinyapps.io/timer/ http://timer.cistrome.org/ http://gepia.cancer-pku.cn/index.html http://gepia2.cancer-pku.cn/#index https://kmplot.com/analysis/index.php?p=background https://string-db.org/


