

Abstract
Aim
To assess the potential of supervised machine‐learning techniques to identify clinical variables for predicting short‐term and long‐term glycated haemoglobin (HbA1c) response after insulin treatment initiation in patients with type 2 diabetes mellitus (T2DM).
Materials and methods
We included patients with T2DM from the Groningen Initiative to Analyse Type 2 diabetes Treatment (GIANTT) database who started insulin treatment between 2007 and 2013 and had a minimum follow‐up of 2 years. Short‐ and long‐term responses at 6 (±2) and 24 (±2) months after insulin initiation, respectively, were assessed. Patients were defined as good responders if they had a decrease in HbA1c ≥ 5 mmol/mol or reached the recommended level of HbA1c ≤ 53 mmol/mol. Twenty‐four baseline clinical variables were used for the analysis and an elastic net regularization technique was used for variable selection. The performance of three traditional machine‐learning algorithms was compared for the prediction of short‐ and long‐term responses and the area under the receiver‐operating characteristic curve (AUC) was used to assess the performance of the prediction models.
Results
The elastic net regularization‐based generalized linear model, which included baseline HbA1c and estimated glomerular filtration rate, correctly classified short‐ and long‐term HbA1c response after treatment initiation, with AUCs of 0.80 (95% CI 0.78–0.83) and 0.81 (95% CI 0.79–0.84), respectively, and outperformed the other machine‐learning algorithms. Using baseline HbA1c alone, an AUC = 0.71 (95% CI 0.65–0.73) and 0.72 (95% CI 0.66–0.75) was obtained for predicting short‐term and long‐term response, respectively.
Conclusions
Machine‐learning algorithm performed well in the prediction of an individual's short‐term and long‐term HbA1c response using baseline clinical variables.
Keywords: cohort study, database research, insulin therapy, observational study, primary care, type 2 diabetes
1. INTRODUCTION
When oral therapies fail to control blood glucose levels or cause severe side effects in patients with type 2 diabetes mellitus (T2DM), insulin therapy is recommended.1 Approximately 15% to 24% of patients with T2DM receive insulin treatment.2, 3, 4 Large variability in response to insulin treatment is seen, resulting partly from differences in demographic, genetic, clinical and psychosocial characteristics.5, 6, 7, 8, 9, 10, 11 Notably, suboptimal blood glucose levels could lead to higher risks of cardiovascular complications and mortality.12
In clinical settings, identification of variables that can predict a patient's individual response to insulin could help tailor treatment. Previous studies have established prediction models for glycated haemoglobin (HbA1c) response to insulin using univariate and multivariate analysis of several demographic and clinical variables.6, 7, 8, 9, 13 Amongst others, age, body mass index (BMI) and baseline HbA1c appeared to influence HbA1c response after insulin treatment initiation. Prediction models based on such traditional regression analyses, however, have limited utility for clinical decision‐making because they do not personalize the prediction to the individual. Similarly, studies that identify clinical characteristics of patients that are associated with distinct HbA1c trajectories in patients with T2DM over the course of insulin treatment via unsupervised clustering algorithms cannot sufficiently guide clinical decision‐making.14, 15, 16, 17, 18 Such studies lead to inconsistent groupings of patients, suggesting that cluster analysis driven by outcome patterns is not helpful in predicting HbA1c responses using clinical variables at baseline. There is a need for a more individualized approach to support clinical decision‐making and to guide personalized treatment for patients with T2DM in need of additional treatment.
Over the last few decades, machine‐learning algorithms have been actively used for developing clinical decision support systems.19, 20 Machine‐learning algorithms can automatically identify important clinical variables to predict a clinical outcome at individual patient level. In the present study, our primary aims were to assess the performance of supervised machine‐learning‐based clinical decision support tools to predict short‐ and long‐term HbA1c response after insulin initiation in patients with T2DM and to identify clinical variables that can influence a patient's HbA1c response. The proposed supervised learning approach in this study provides a quantitative probability measure of HbA1c response for an individual patient. Our secondary aim was to identify and characterize subgroups of patients with different HbA1c responses after insulin initiation using the predictions made for individuals by machine‐learning algorithms.
2. MATERIALS AND METHODS
2.1. Data source
Data were collected from the Groningen Initiative to Analyse Type 2 diabetes Treatment (GIANTT) database (https://www.giantt.nl).21 This longitudinal database contains routinely collected data of patients with T2DM extracted from the electronic medical records of general practices in the northern Netherlands.22 The dynamic nature of the database allows the inclusion of newly diagnosed patients or patients with T2DM newly registered in a participating general practice, for example, after moving into the area. Patients were excluded when they moved out of the area, were no longer treated in primary care or died. The GIANTT database includes prescription data, medical history, results of routine laboratory tests and physical examinations from >50 000 patients diagnosed with T2DM. Medical history contains diagnoses, as documented in the electronic medical records by means of the International Classification of Primary Care or short text descriptions that were manually coded. The GIANTT data collection and mapping procedures have been validated,22 and used in more than 40 previous studies.
2.2. Population inclusion criteria
Details of patient inclusion and exclusion criteria were published in a previous study using the same dataset.18 In short, for the present study, patients were eligible for inclusion if all of the following criteria applied: (a) they were prescribed insulin for the first time between January 1, 2007 and December 31, 2013; (b) they had an HbA1c measurement at insulin initiation and at 6‐ (±2) and 24‐ (±2) month follow‐up; (c) they had at least one HbA1c measurement within 365 days preceding insulin initiation; and (d) they had at least one insulin prescription within 365 days before each follow‐up HbA1c measurement to ensure no discontinuation in the follow‐up period.
2.3. 3 baseline clinical variables
We used a set of 24 baseline clinical variables previously identified as possibly relevant and available in the GIANTT database.18 This included continuous variables (age, HbA1c, total cholesterol, triglycerides, HDL cholesterol, LDL cholesterol, systolic blood pressure [SBP], albumin‐to‐creatinine ratio [ACR], estimated glomerular filtration rate [eGFR], BMI) and categorical variables (sex, diabetes duration [≥2 years], micro/macro‐albuminuria, smoking status, metformin use, sulphonylurea use, acarbose use, thiazolidine use, dipeptidyl peptidase‐4 [DPP‐4] inhibitor use, repaglinide use, history of cardiovascular disease, peripheral vascular disease, malignancy, and psychological conditions). Full details on these variables have been described elsewhere18 and are also provided in File S1.
2.4. Patient outcome
The primary outcome measure for this study was decrease in HbA1c level after insulin treatment initiation in the short term (6 ± 2 months) and long term (24 ± 2 months). Patients were identified as good responders if there was a reduction in HbA1c of at least 5 mmol/mol compared to baseline or if they reached an HbA1c level of ≤53 mmol/mol. If the reduction was <5 mmol/mol or HbA1c failed to reach the level of 53 mmol/mol, patients were defined as poor responders. The HbA1c level of 53 mmol/mol was the lowest recommended target level for patients with T2DM in the Netherlands at the time of the study.1
2.5. Statistical analysis and cross‐validation
2.5.1. Missing data
First, missing variables (excluding HbA1c as this was used in defining the outcome) in the raw baseline data were imputed using a multiple imputation by chained equations algorithm23 (triglyceride: 3%; total cholesterol: 3.7%; LDL cholesterol: 3.1%; SBP: 24%; ACR: 14%; eGFR: 1.43%; BMI: 29%). Using imputed clinical variables, we used an elastic net regularization technique24 for important variable selection, and trained machine‐learning algorithms to predict the probability of HbA1c response after insulin treatment initiation. It should be noted that several variables were correlated; for example, “total cholesterol” and “triglycerides, HDL cholesterol and LDL‐cholesterol,” and “ACR” and “micro−/macroalbuminuria.” The elastic net regularization technique is ideal for this application where data consist of multiple highly correlated variables. The elastic net regularization technique will assign large weight to the variable that has more discriminative ability to distinguish between two groups.
2.5.2. HbA1c response prediction system
Figure 1 shows the architecture of the proposed HbA1c response prediction system. We compared the performance of three commonly used traditional machine‐learning algorithms: (a) an elastic net regularization‐based generalized linear model,24 (b) a support vector machine25 and (c) random forests26 to predict HbA1c responses. We evaluated the prediction performance of the machine‐learning models using a leave‐one‐subject‐out (LOSO) cross‐validation technique, that is, we divided the data into N folds. In each fold, we used data from N‐1 subjects for training the prediction model and the remaining unseen left‐out data for testing. In each fold, variables in the training set were standardized (by subtracting the mean and dividing by the standard deviation), and the testing set predictors were standardized with respect to the mean and standard deviation of the training set before using them for classification. Since the training set contained an unequal number of sample points from the two groups (responder and non‐responder), this created a group imbalance problem which could severely bias the performance of the model. For this reason, we created a balanced training set (in every iteration) by selecting random samples from each group corresponding to the length of the smallest group (which varies during each iteration). We further divided this LOSO cross‐validation into inner and outer validation. Inner cross‐validation was performed on the training set to estimate optimal model parameters and discriminant predictors using a feature selection method. Outer cross‐validation was performed on the training set to estimate model performance. Details are provided in the next sections.
Figure 1.
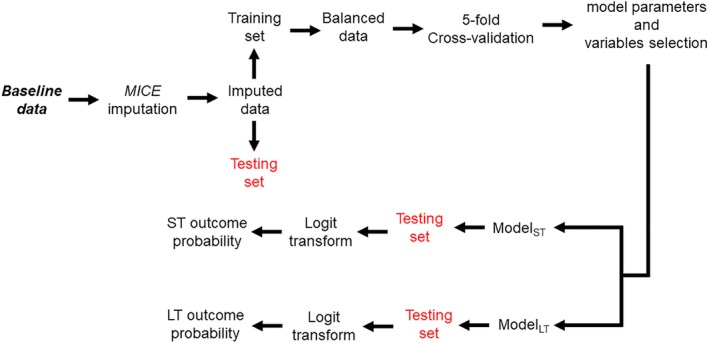
Architecture of the proposed supervised machine learning based HbA1c response prediction system. LT, long‐term; MICE, multiple imputation by chained equations; ST, short‐term
2.5.3. Inner cross‐validation for training the classifier model
The elastic net regularization algorithm requires tuning of the so‐called hyperparameters, α = ridge coefficient, and λ = amount of regularization, before testing on the testing set. While α controls the number of variables to be included in the analysis, λ adjusts the amount of coefficient shrinkage (or variable weights). The weights (or relative importance) of individual variables provided by elastic net regularization during training were used for selecting important predictors (variable selection). In each internal cross‐validation loop, we optimized the number of predictors and hyperparameters (using grid search) to be included in the final model. We used fivefold cross‐validation on the training set (ie, using 80% training set) to obtain these parameters. The optimal set of predictors and parameters that provided maximum average area under the receiver‐operating characteristic curve (AUC) over the fivefold training set was used to train the final prediction model on the whole training set.
2.5.4. Outer cross‐validation for testing the prediction model
The final trained prediction model with optimal parameters in the internal cross‐validation loop was used to obtain the probability of good HbA1c response on the testing data. We then obtained the average performance across N‐folds to evaluate the model performance. Thus, by training the prediction model using only the training set (inner cross‐validation) and testing it on the independent testing set (outer cross‐validation), the proposed method using LOSO cross‐validation provides nearly unbiased estimates on new testing data.27
Two separate prediction models were developed to predict short‐term and long‐term HbA1c response for a given patient. The predicted output by each model was converted to posterior probabilities via logit transformation, resulting in two probability scores assigned for each patient. To identify subgroups of patients predicted by the model with different HbA1c responses after insulin initiation, we stratified the entire population by the median probability output of the short‐term as well as the long‐term model, resulting in four subgroups. Baseline characteristics were described for each subgroup and ANOVA, followed by post hoc testing with the Tukey honest significant difference test to assess differences in these characteristics between the groups. The Kruskal–Wallis test was used for non‐normally distributed variables. All tests were two‐sided with an α value = .05. There was no a priori power analysis to guide sample size in data collection.
2.6. Performance metric
We used the AUC as the performance metric to evaluate the performance of the proposed system. This metric provides an estimate of how well the model can differentiate between two groups (good responders vs poor responders). The higher the AUC, the better the model performance: AUC = 1 indicated the best performance and AUC = 0.5 corresponded to random performance. An AUC ≥0.8 was considered good performance. We compared the AUC of different models with a prediction model including only the baseline HbA1c. All of the coding and analyses were performed using the MATLAB 2018a scripting language (Natick, Massachusetts). All results are reported as mean (±95% CI) unless stated otherwise. Bootstrapping with 1000 samples was used to estimate the 95% CI.
3. RESULTS
In total, data from 1188 patients satisfying all inclusion and exclusion criteria were used in this study (Figure 2). The majority of patients (3341 patients) were excluded because their follow‐up period was too short. The patients had a mean age of 66 years, 54% were women, and 86% had a diabetes duration of ≥2 years (Table 1).
Figure 2.
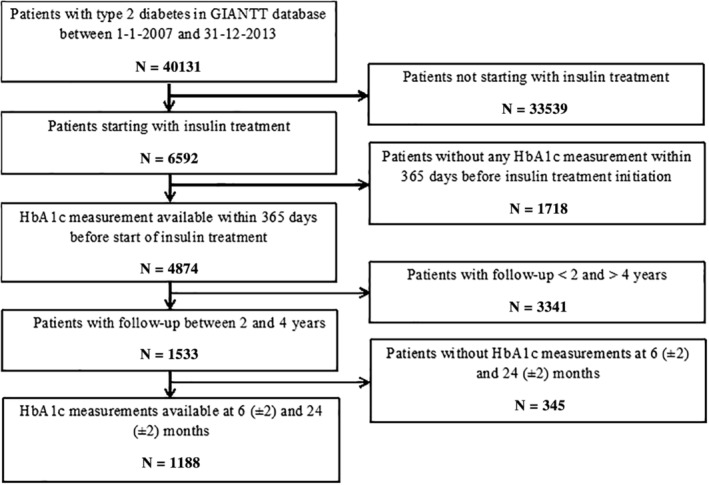
Flow chart illustrating patient inclusion and exclusion criteria used in this study to select patients for the final analysis. GIANTT, Groningen initiative to analyse type 2 diabetes treatment; HbA1c, glycated haemoglobin
Table 1.
Groupwise comparison of baseline characteristics of patients
| Clinical variables | All | Group 1 | Group 2 | Group 3 | Group 4 |
|---|---|---|---|---|---|
| Total number of patients, n (%) | 1188 (100) | 558 (47) | 36 (3) | 558 (47) | 36 (3) |
| Agea, years | 66.10 (12.1) | 65.2(12.5) | 56.1(10) | 67.4(11.6) | 69.6(11.1) |
| Women, % | 639 (54) | 290 (52) | 18 (50) | 309 (55.4) | 22 (61.1) |
| DMD, n (%) | 1026 (86.4) | 460 (82.4) | 32 (88.9) | 501 (89.8) | 33 (91.6) |
| HbA1ca, mmol/Mol | 64.7 (16.4) | 76.1 (17.2) | 61.8 (0.9) | 57.4 (2.1) | 62.2 (1.6) |
| Total cholesterol*, mmol/L | 4.4 (1.0) | 4.4(1.0) | 4.2 (1.3) | 4.4 (1.1) | 4.6 (1.2) |
| Triglycerides, mmol/L | 1.9 (1.1) | 1.9 (1.1) | 1.6 (0.7) | 1.9 (1.1) | 2.1 (1.2) |
| HDL cholesterol, mmol/L | 1.2 (0.3) | 1.2 (0.3) | 1.0 (0.3) | 1.2 (0.3) | 1.3 (0.4) |
| LDL cholesterol, mmol/L | 2.4 (0.9) | 2.5(0.9) | 2.3(1.0) | 2.4(1.0) | 2.4(0.9) |
| SBPa, mmHg | 142 (19.4) | 141.6 (20.4) | 134.5 (14.9) | 141.1 (18.5) | 153.3 (19.7) |
| ACR, μg/mg | 5.3 (16.1) | 4.2 (12.2) | 3.2 (7.8) | 6.8 (22.0) | 3.6 (8.6) |
| eGFRa, mL/min/1.73 m2 | 73.4 (22.2) | 76.6 (21.3) | 92.4 (15.6) | 69.5 (22.3) | 63.3 (20.7) |
| BMI, kg/m2 | 30.6 (5.4) | 30.8(5.4) | 30.2(5.7) | 30.1(5.2) | 35.0(9.4) |
| Micro/macroalbuminuria, n (%) | 248 (21) | 117 (21) | 5 (13.9) | 112 (20.1) | 9 (25) |
| Smoker, n (%)* | 147 (12.4) | 69 (12.4) | 9 (25) | 67 (12) | 2 (5.6) |
| Metformin, n (%) | 773 (65.1) | 390 (69.9) | 20 (55.6) | 347 (62.2) | 16 (44.4) |
| Sulphonylureas, n (%) | 769 (64.7) | 371 (66.5) | 22 (61.1) | 350 (62.7) | 26 (72.2) |
| Acarbose, n (%) | 3 (0.3) | 1 (0.2) | 0 (0) | 2 (0.4) | 0 (0) |
| Thiazolidines, n (%) | 113 (9.5) | 27 (4.8) | 0 (0) | 70 (12.5) | 16 (44.4) |
| DPP‐4 inhibitors, n (%) | 57 (4.8) | 34 (6.1) | 2 (5.6) | 21 (3.8) | 0 (0) |
| Other GLDs, n (%) | 3 (0.2) | 2 (0.4) | 0 (0) | 0 (0) | 1 (2.8) |
| CV morbidity, n (%) | 279 (23.5) | 122 (21.9) | 3 (8.3) | 149 (26.7) | 5 (13.9) |
| Peripheral vascular morbidity, n (%) | 161(13.5) | 68 (12.2) | 1 (2.8) | 84 (15.1) | 8 (22.2) |
| Malignancy, n (%) | 117 (9.8) | 46 (8.2) | 3 (8.3) | 66 (11.8) | 2 (5.6) |
| Psychological conditions, n(%) | 83 (7) | 48 (8.6) | 1 (2.8) | 30 (5.4) | 4 (11.1) |
Note: Group 1, short‐term and long‐term responders; Group 2, short‐term responders; Group 3, no change in response; Group 4, long‐term responders.
Note: Values are reported as mean (±SD) unless stated otherwise.
Abbreviations: BMI, body mass index; CV, cardiovascular, albumin‐creatinine ratio; DMD, diabetes mellitus duration (≥2 years); DPP‐4, dipeptidyl peptidase‐4; eGFR, estimated glomerular filtration rate; SBP, systolic blood pressure; T2DM, type 2 diabetes mellitus.
Significant differences (P < .05).
3.1. HbA1c response prediction
The elastic net regularization‐based generalized linear model identified short‐ and long‐term HbA1c responders with an AUC = 0.80 (95% CI 0.78–0.83) and 0.81 (95% CI 0.79–0.84), sensitivity = 0.81 (95% CI 0.75–0.86) and 0.81 (95% CI 0.76–0.88), specificity = 0.67 (95% CI 0.61–0.78) and 0.65 (95% CI 0.60–0.78), respectively (see File S1 for additional metrics). The performance of the generalized linear model outperformed the other two machine‐learning algorithms (support vector machine: AUC = 0.75 [95% CI 0.71–0.78] and 0.77 [95% CI 0.73–0.79] and random forests: AUC = 0.76 [95% CI 0.68–0.78] and 0.79 [95% CI 0.69–0.81]) in predicting short‐term and long‐term responses, respectively. Using baseline HbA1c alone, we obtained an AUC = 0.71 (95% CI 0.65–0.73) and 0.72 (95% CI 0.66–0.75) for predicting short‐ and long‐term response, respectively.
3.2. Important predictive variables
Different variables identified by the elastic net regularization to predict short‐term and long‐term responders are shown in Figure 3. The following variables were selected as important for short‐term prediction (reported as %, where K= total number of times a given variable was selected in different iterations): baseline HbA1c (100%); thiazolidine use (100%); eGFR (99.7%); and HDL cholesterol (98.3%). For long‐term outcome prediction, baseline HbA1c (100%), smoking status (98.9%) and eGFR (86.5%) were selected as important predictors.
Figure 3.
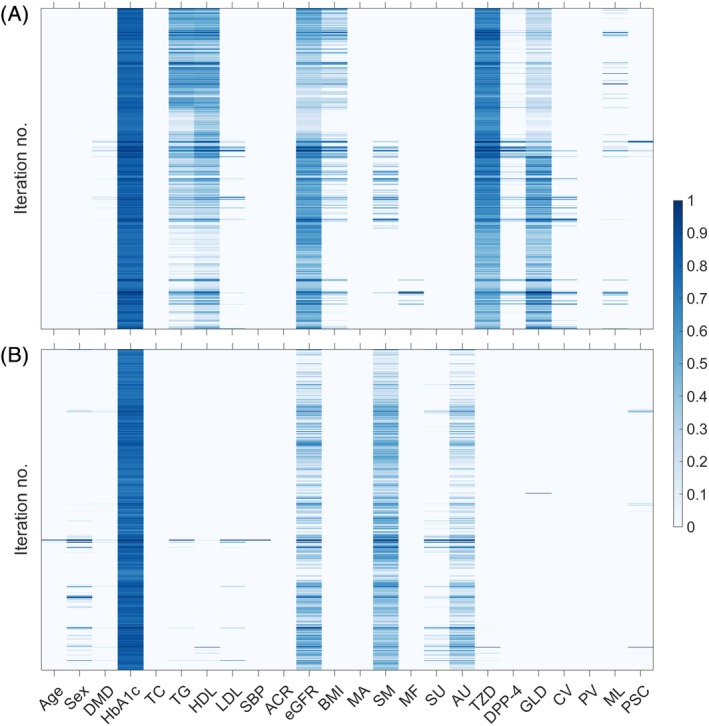
Heatmap illustrating the of set of clinical variables selected (in columns) by the elastic net regularization techniques across different leave one out iterations (in rows) for A, short‐term and B, long‐term HbA1c response prediction, respectively. The colour bar indicates the weightage assigned by elastic net to discriminate between responders and non‐responders. Higher intensity in the colormap indicates variables that are more robustly informative (selected more consistently across different iterations of model training). ACR, albumin‐to‐creatinine ratio; AU, acarbose use; BMI, body mass index; CV, history of cardiovascular disease; DMD, type 2 diabetes melitus duration (≥2 years); DPP‐4, dipeptidyl‐peptidase‐4‐inhibitors use; eGFR, estimated glomerular filtration rate, GLD, other oral glucose‐lowering drugs use;HbA1c, glycated haemoglobin; HDL, HDL cholesterol; MA, micro/macro‐albuminuria; MU, metformin use; ML, malignancy; PSC, psychological conditions PV, peripheral vascular disease; SBP, systolic blood pressure; TC, total cholesterol; TG, triglycerides; LDL, LDL cholesterol; SM, smoking status; SU, sulphonylurea use; TZD, thiazolidines use
3.3. Subgroups of distinct HbA1c responders
Figure 4 shows the mean trajectory (with 95% CI) of HbA1c values over 24 months after insulin treatment initiation for each subgroup with different short‐ and long‐term HbA1c responses predicted by the elastic net regularization‐based generalized linear model. At baseline, age, HbA1c level, total cholesterol, SBP, eGFR and smoking status were significantly different among the four groups (Table 1). Group 1 (short‐ and long‐term responders), which included 558 (47%) of the 1188 patients, had relatively high HbA1c at baseline when compared to the other groups. Patients in this group responded substantially to the insulin treatment within 6 months and maintained sufficient response until 24 months. Group 2 (short‐term responders), which included 36 patients (3%), was younger, with relatively low initial HbA1c, low total cholesterol, low SBP, and high eGFR levels and more smokers at baseline. Patients in this group responded sufficiently to insulin treatment within 6 months but did not show sufficient response (Δ HbA1c < 5 mmol/mol) after 6 months. Group 3 (no change in response) included 558 (47%) patients and had the lowest HbA1c levels at baseline. Patients in this subgroup did not show a sufficient decrease in HbA1c throughout the 24 months of insulin treatment. Group 4 (long‐term responders), which included 36 (3.8%) patients, was older, with higher total cholesterol, higher SBP, and lower eGFR levels compared with the other groups. After insulin treatment initiation, patients in this group did not show a sufficient initial decrease in HbA1c but showed better response after 6 months.
Figure 4.
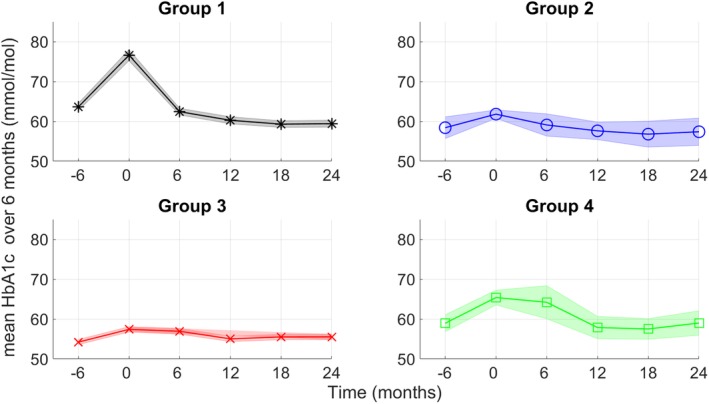
Comparison of glycated haemoglobin (HbA1c; mmol/Mol) levels in four groups against time predicted by the elastic net regularization‐based generalized linear model. The graph shows mean values with 95% confidence interval. The time axis is divided into 6‐month intervals. Here group 1, short‐ and long‐term responders; group 2, short‐term responders; group 3, no change in response; group 4, long‐term responders. To obtain distinct subgroups of patients, we obtained a median probability outputs of the generalized linear model. HbA1c, glycated haemoglobin
4. DISCUSSION
We developed a novel supervised machine‐learning framework to predict short‐term and long‐term HbA1c response in patients with T2DM after insulin treatment initiation using multiple demographic and baseline clinical variables. The proposed system based on an elastic net regularization‐based generalized linear model correctly classified short‐ and long‐term insulin treatment responders with good performance (AUC ≥0.80). Baseline HbA1c, eGFR, smoking and use of specific oral glucose‐regulating drugs were identified as the most important factors. In addition, subgroups with different predicted short‐ and long‐term responses differed in age, baseline HbA1c, eGFR, total cholesterol and SBP levels.
Several previous studies have looked at variables for predicting HbA1c response in patients with T2DM initiating metformin or sulphonylurea derivatives (detailed analysis and description of these studies can be found in the review article by Martono et al13). In these studies, baseline HbA1c, age, BMI and duration of diabetes were found to be important predictors of HbA1c response. Consistent with these findings, the present study showed that baseline HbA1c is important for predicting both short‐ and long‐term HbA1c response after insulin initiation. We identified a substantial group of patients who already had relatively low HbA1c levels at insulin initiation which remained stable over time. Although these patients did not reach target HbA1c levels and did not show sufficient response as defined in the present study, they seem relatively well treated. It is possible that these patients switched to insulin to reduce the adverse effects of oral treatment. We also identified a substantial group of patients with elevated HbA1c levels at baseline who responded rapidly to the treatment and remained stable during the course of the treatment. We observed that smoking status had a significant effect on the prediction performance of the long‐term HbA1c response. The small group of younger patients with sufficient short‐term response without further long‐term improvements included a higher percentage of smokers. It might be that smoking status is a proxy for being less adherent to treatment,28, 29 but it can also be associated with insulin resistance.30 Finally, the use of thiazolidines or repaglinide at baseline was predictive of short‐term response. These were mostly used by patients in the smaller group of older patients which showed poor short‐term but a good long‐term response. It is likely that these patients had switched from thiazolidines or repaglinide to insulin, and may have been on too‐low insulin dosing schemes in the first months of treatment. It could also be that use of these drugs is a proxy for clinical complexity.
Prior studies conducted in the Netherlands17, 18 have looked at identifying distinct trajectories of HbA1c response over time after insulin treatment initiation using an unsupervised latent class growth modelling algorithm.31 A study by Mast et al17 identified four different subgroups on a database obtained from a centrally organized care system. The majority of patients (89%) had stable HbA1c trajectories over time after insulin treatment initiation. This group was similar in age and baseline HbA1c levels to group 3 in the present study, showing stable HbA1c levels. A recent study by Sidorenkov et al,18 using the same GIANTT data as used in the present study, identified three distinct subgroups, where the majority of patients (84%) showed a short‐term response followed by stable HbA1c trajectories. This group was also similar in age and baseline HbA1c levels to group 3 in the present study.
To the best of our knowledge, this is the first study using a supervised machine‐learning technique to predict short‐ and long‐term HbA1c response in patients with T2DM based on a clinical outcome definition. The proposed supervised machine‐learning framework may lead to clinical tools which provide a probability estimate of patient response to insulin treatment at baseline (before initiation) using clinical data available from the medical record. It is important to note that the model does not assume causality. The clinical utility of the proposed method is multifold. It provides clinicians with the ability to integrate multiple variables to predict both short‐term and long‐term HbA1c response. Identifying patients who are likely to respond to insulin only in the long term may assist clinicians to monitor and uptitrate insulin dosage earlier in these patients. Similarly, identifying patients who are likely to respond only in the short term may require closer monitoring of patient adherence as well as the need for uptitration. This provides the first step towards a more personalized treatment where insulin treatment decisions are supported by machine‐learning algorithms based on individual patient predictors. A clinician can integrate such clinical data‐based predictions with additional information about patient preferences or risks for adverse events when making decisions about insulin initiation.
Despite promising results (AUC ≥0.8), the present HbA1c response prediction system is not yet ready for clinical use. A strength of the present study is the use of LOSO cross‐validation (mimicking a real clinical scenario) to develop the proposed patient response prediction system and subgroup identification. This provides a nearly unbiased estimate of the generalization error on new patient testing data. Several limitations need to be addressed in future work before deployment of the HbA1c response prediction system. First, the majority of patients in the present study were of western European ethnicity (2% non‐Europeans) and the results might not be generalizable to the general population. Second, we look at HbA1c response after insulin initiation using observational data, while the response may be attributable to other factors, such as insulin dosing and regimen, other medication changes, medication adherence, and lifestyle (eg, physical activity and diet). We had no data available to report on these factors. Third, we developed two separate models for short‐ and long‐term prediction because of the limited dataset. A substantial number of patients in the GIANTT database were excluded from the analyses because they had insufficient follow‐up or lacked an HbA1c measurement before insulin initiation. This is a consequence of using medical record data from a dynamic cohort. This can have an impact on prediction performance, although it is difficult to say to what extent. Validation of the proposed model on another dataset is therefore necessary to confirm the findings. In the future, we plan to develop a single multi‐label machine‐learning model using a large dataset from several sources. This should also include more recent data, because the use of newer agents, such as glucagon‐like peptide‐1 receptor agonists in combination with insulin may have increased. For now, our results provide important proof‐of‐concept results to guide future investigations leveraging the potential of machine learning in predicting drug response.
In conclusion, we show that a supervised machine‐learning algorithm performed well in predicting short‐ and long‐term HbA1c response after insulin initiation in patients with T2DM. This provides the first step towards guided personalized treatment where insulin treatment decisions are supported by machine‐learning‐based predictions using individual patient clinical variables.
CONFLICT OF INTEREST
The authors have no conflicts of interest.
Supporting information
Table S1 Summary of model performances [reported as mean (±95% confidence interval)] using elastic net regularization based generalized linear model to predict short‐term and long‐term HbA1c response outcome prediction. Bootstrapping with 1000 samplings was used to estimate the 95% CI. Abbreviations: PPV = positive prediction value, NPV = negative prediction value.
ACKNOWLEDGMENTS
This study was funded by the Department of clinical Pharmacy and Pharmacology, University Medical Center Groningen, University of Groningen, The Netherlands. The funders had no role in study design, data collection, and analysis, decision to publish, or preparation of the manuscript.
Nagaraj SB, Sidorenkov G, van Boven JFM, Denig P. Predicting short‐ and long‐term glycated haemoglobin response after insulin initiation in patients with type 2 diabetes mellitus using machine‐learning algorithms. Diabetes Obes Metab. 2019;21:2704–2711. 10.1111/dom.13860
Peer Review The peer review history for this article is available at https://publons.com/publon/10.1111/dom.13860.
Funding information This study was funded by the Department of clinical Pharmacy and Pharmacology, University Medical Center Groningen, University of Groningen
REFERENCES
- 1. Rutten G, Grauw WD, Nijpels G, et al. NHG‐Standaard Diabetes mellitus type 2 (derde herziening). Huisarts Wet. 2013;56:512‐525. [Google Scholar]
- 2. Lee SJ, Stijacic‐Cenzer I, Barnhart C, McClymont K, Steinman MA. Changing patterns of glucose‐lowering medication use in VA nursing home residents with diabetes, 2005 to 2011. J Am Med Dir Assoc. 2015;16(10):898.e9‐898.e14. [DOI] [PMC free article] [PubMed] [Google Scholar]
- 3. Sharma M, Nazareth I, Petersen I. Trends in incidence, prevalence and prescribing in type 2 diabetes mellitus between 2000 and 2013 in primary care: a retrospective cohort study. BMJ Open. 2016;6(1):e010210. [DOI] [PMC free article] [PubMed] [Google Scholar]
- 4. van HKJ, Drion I, Kleefstra N, et al. A prospective observational study of quality of diabetes care in a shared care setting: trends and age differences (ZODIAC‐19). BMJ Open. 2012;2(4):e001387. [DOI] [PMC free article] [PubMed] [Google Scholar]
- 5. Cantrell RA, Alatorre CI, Davis EJ, et al. A review of treatment response in type 2 diabetes: assessing the role of patient heterogeneity. Diabetes Obes Metab. 2010;12(10):845‐857. [DOI] [PubMed] [Google Scholar]
- 6. Hardin DS, Rohwer RD, Curtis BH, et al. Understanding heterogeneity in response to antidiabetes treatment: a post hoc analysis using SIDES, a subgroup identification algorithm. J Diabetes Sci Technol. 2013;7(2):420‐430. [DOI] [PMC free article] [PubMed] [Google Scholar]
- 7. Home PD, Shen C, Hasan MI, Latif ZA, Chen J‐W, González Gálvez G. Predictive and explanatory factors of change in HbA1c in a 24‐week observational study of 66,726 people with type 2 diabetes starting insulin analogs. Diabetes Care. 2014;37(5):1237‐1245. [DOI] [PubMed] [Google Scholar]
- 8. Cummings MH, Cao D, Hadjiyianni I, Ilag LL, Tan MH. Characteristics of insulin‐Naïve people with type 2 diabetes who successfully respond to insulin glargine U100 after 24 weeks of treatment: a meta‐analysis of individual participant data from 3 randomized clinical trials. Clin Diabetes Endocrinol. 2018;4:10. [DOI] [PMC free article] [PubMed] [Google Scholar]
- 9. Scheen AJ, Schmitt H, Jiang HH, Ivanyi T. Factors associated with reaching or not reaching target HbA1c after initiation of basal or premixed insulin in patients with type 2 diabetes. Diabetes Metab. 2017;43(1):69‐78. [DOI] [PubMed] [Google Scholar]
- 10. Jablonski KA, McAteer JB, de Bakker PIW, et al. Common variants in 40 genes assessed for diabetes incidence and response to metformin and lifestyle intervention in the diabetes prevention program. Diabetes. 2010;59(10):2672‐2681. [DOI] [PMC free article] [PubMed] [Google Scholar]
- 11. Goswami S, Yee SW, Stocker S, et al. Genetic variants in transcription factors are associated with the pharmacokinetics and pharmacodynamics of metformin. Clin Pharmacol Ther. 2014;96(3):370‐379. [DOI] [PMC free article] [PubMed] [Google Scholar]
- 12. Lee M‐Y, Hsiao P‐J, Huang Y‐T, et al. Greater HbA1c variability is associated with increased cardiovascular events in type 2 diabetes patients with preserved renal function, but not in moderate to advanced chronic kidney disease. PLoS One. 2017;12(6):e0178319. [DOI] [PMC free article] [PubMed] [Google Scholar]
- 13. Martono DP, Lub R, Lambers Heerspink HJ, Hak E, Wilffert B, Denig P. Predictors of response in initial users of metformin and sulphonylurea derivatives: a systematic review. Diabet Med. 2015;32(7):853‐864. [DOI] [PubMed] [Google Scholar]
- 14. Walraven I, Mast MR, Hoekstra T, et al. Distinct HbA1c trajectories in a type 2 diabetes cohort. Acta Diabetol. 2015;52(2):267‐275. [DOI] [PubMed] [Google Scholar]
- 15. Karpati T, Leventer‐Roberts M, Feldman B, Cohen‐Stavi C, Raz I, Balicer R. Patient clusters based on HbA1c trajectories: a step toward individualized medicine in type 2 diabetes. PLoS One. 2018;13(11):e0207096. [DOI] [PMC free article] [PubMed] [Google Scholar]
- 16. Hertroijs DF, Elissen AM, Brouwers MC, et al. A risk score including body mass index, glycated haemoglobin and triglycerides predicts future glycaemic control in people with type 2 diabetes. Diabetes Obes Metab. 2018;20(3):681‐688. [DOI] [PMC free article] [PubMed] [Google Scholar]
- 17. Mast MR, Walraven I, Hoekstra T, et al. Effectiveness of insulin therapy in people with type 2 diabetes in the Hoorn diabetes care system. Diabet Med. 2016;33(6):794‐802. [DOI] [PubMed] [Google Scholar]
- 18. Sidorenkov G, van BJF, Hoekstra T, Nijpels G, Hoogenberg K, Denig P. HbA1c response after insulin initiation in patients with type 2 diabetes mellitus in real life practice: identifying distinct subgroups. Diabetes Obes Metab. 2018;20(8):1957‐1964. [DOI] [PMC free article] [PubMed] [Google Scholar]
- 19. Contreras I, Vehi J. Artificial intelligence for diabetes management and decision support: literature review. J Med Internet Res. 2018;20(5):e10775. [DOI] [PMC free article] [PubMed] [Google Scholar]
- 20. Kavakiotis I, Tsave O, Salifoglou A, Maglaveras N, Vlahavas I, Chouvarda I. Machine learning and data mining methods in diabetes research. Comput Struct Biotechnol J. 2017;15:104‐116. [DOI] [PMC free article] [PubMed] [Google Scholar]
- 21. GIANTT Database . Publications on National and International Level. https://www.giantt.nl/nl/what-is-giantt/publications/. Accessed February, 2018.
- 22. Voorham J, Denig P. Computerized extraction of information on the quality of diabetes care from free text in electronic patient records of general practitioners. J Am Med Inform Assoc. 2007;14(3):349‐354. [DOI] [PMC free article] [PubMed] [Google Scholar]
- 23. White IR, Royston P, Wood AM. Multiple imputation using chained equations: issues and guidance for practice. Stat Med. 2011;30(4):377‐399. [DOI] [PubMed] [Google Scholar]
- 24. Zou H, Hastie T. Regularization and variable selection via the elastic net. J R Stat Soc Ser B Stat Methodol. 2005;67(2):301‐320. [Google Scholar]
- 25. Cortes C, Vapnik V. Support‐vector networks. Mach Learn. 1995;20(3):273‐297. [Google Scholar]
- 26. Breiman L. Random forests. Mach Learn. 2001;45(1):5‐32. [Google Scholar]
- 27. Vapnik V. Estimation of Dependences Based on Empirical Data: Springer Series in Statistics (Springer Series in Statistics). Secaucus, NJ: Springer‐Verlag New York, Inc.; 1982. [Google Scholar]
- 28. Sherman BW, Lynch WD. The association of smoking with medical treatment adherence in the workforce of a large employer. Patient Prefer Adherence. 2014;8:477‐486. [DOI] [PMC free article] [PubMed] [Google Scholar]
- 29. Aggarwal B, Mosca L. Lifestyle and psychosocial risk factors predict non‐adherence to medication. Ann Behav Med. 2010;40(2):228‐233. [DOI] [PMC free article] [PubMed] [Google Scholar]
- 30. Bergman BC, Perreault L, Hunerdosse D, et al. Novel and reversible mechanisms of smoking‐induced insulin resistance in humans. Diabetes. 2012;61(12):3156‐3166. [DOI] [PMC free article] [PubMed] [Google Scholar]
- 31. Andruff H, Carraro N, Thompson A, Gaudreau P, Louvet B. Latent class growth modelling: a tutorial. Tutorials Quant Methods Psychol. 2009;5(1):11‐24. [Google Scholar]
Associated Data
This section collects any data citations, data availability statements, or supplementary materials included in this article.
Supplementary Materials
Table S1 Summary of model performances [reported as mean (±95% confidence interval)] using elastic net regularization based generalized linear model to predict short‐term and long‐term HbA1c response outcome prediction. Bootstrapping with 1000 samplings was used to estimate the 95% CI. Abbreviations: PPV = positive prediction value, NPV = negative prediction value.