Abstract
At fast chemical synapses the rapid release of neurotransmitter that occurs within a few milliseconds of an action potential is followed by a more sustained elevation of release probability, known as delayed release. Here we characterize the role of calcium in delayed release and test the hypothesis that facilitation and delayed release share a common mechanism. Synapses between cerebellar granule cells and their postsynaptic targets, stellate cells and Purkinje cells, were studied in rat brain slices. Presynaptic calcium transients were measured with calcium-sensitive fluorophores, and delayed release was detected with whole-cell recordings. Calcium influx, presynaptic calcium dynamics, and the number of stimulus pulses were altered to assess their effect on delayed release and facilitation. Following single stimuli, delayed release can be separated into two components: one lasting for tens of milliseconds that is steeply calcium-dependent, the other lasting for hundreds of milliseconds that is driven by low levels of calcium with a nearly linear calcium dependence. The amplitude, calcium dependence, and magnitude of delayed release do not correspond to those of facilitation, indicating that these processes are not simple reflections of a shared mechanism. The steep calcium dependence of delayed release, combined with the large calcium transients observed in these presynaptic terminals, suggests that for physiological conditions delayed release provides a way for cells to influence their postsynaptic targets long after their own action potential activity has subsided.
Keywords: delayed release, asynchronous release, calcium, stellate cell, granule cell, facilitation
Action potential invasion of a fast chemical synapse provokes a rapid, brief increase in the rate of quantal release of neurotransmitter. At many types of synapses this period of “phasic” release is followed by a much smaller but longer-lived (tens of milliseconds to seconds) elevation of quantal release rate called “delayed” release (Barrett and Stevens, 1972;Rahamimoff and Yaari, 1973; Zengel and Magleby, 1981; Zucker and Lara-Estrella, 1983; Cohen and Van der Kloot, 1986; Goda and Stevens, 1994; Van der Kloot and Molgo, 1994). Understanding the mechanism responsible for delayed release (DR) may provide insight into the links between presynaptic calcium, the time course of probability of release, and various forms of use-dependent synaptic enhancement.
Paired-pulse facilitation (PPF), a form of synaptic enhancement that lasts for hundreds of milliseconds after single action potentials (Zucker, 1996), shares several features with DR, leading to the hypothesis that they share a common underlying mechanism (Rahamimoff and Yaari, 1973; Van der Kloot and Molgo, 1994). In support of this hypothesis, facilitation and DR have been found to have similar time courses at many synapses (Zengel and Magleby, 1981; Van Der Kloot and Molgo, 1993; Goda and Stevens, 1994), and both phenomena are dependent on residual presynaptic calcium (Van Der Kloot and Molgo, 1993; Kamiya and Zucker, 1994; Atluri and Regehr, 1996; Cummings et al., 1996). The mechanistic link between DR and facilitation is, however, controversial (Zucker and Lara-Estrella, 1983; Van der Kloot and Molgo, 1994).
Another important issue is the calcium dependence of DR. High concentrations of calcium chelators in presynaptic terminals can eliminate DR (Van Der Kloot and Molgo, 1993; Cummings et al., 1996). Furthermore, there is evidence that elevations in presynaptic calcium levels increase miniature EPSC (mEPSC) frequency. For example, at the crayfish neuromuscular junction, elevations in presynaptic calcium produced by either sustained high-frequency stimulation or by calcium ionophores increase mEPSC frequency (Delaney and Tank, 1994; Ravin et al., 1997). The dependence of DR on intracellular calcium is not known for synapses in the mammalian CNS, where it only recently has become possible to measure presynaptic calcium levels.
Here we study the relationships between presynaptic calcium, facilitation, and DR for synapses from cerebellar granule cells onto stellate cells and Purkinje cells. In the cerebellar cortex, granule cell axons rise from the granular to the molecular layer, bifurcate, and run for several millimeters in either direction as so-called “parallel fibers” (Palay and Chan-Palay, 1974). Parallel fibers make en passant glutamatergic synapses with both Purkinje cells and small inhibitory interneurons, called stellate cells. Each of these types of synapses has its own advantages: we already have studied the role of calcium in facilitation at the synapse onto Purkinje cells (Atluri and Regehr, 1996), whereas the stellate cell synapse is better suited for detection of DR.
At both of these synapses we found that, after single stimuli, delayed release can be separated into two components: a rapid component that lasts for tens of milliseconds and a more sustained component that lasts for hundreds of milliseconds. Although DR and facilitation are both calcium-dependent, the amplitudes and time courses of these components do not correspond to those of facilitation. A comparison of presynaptic calcium levels and DR indicates that the rapid component of DR is steeply calcium-dependent, whereas the sustained component is driven by low levels of calcium with a nearly linear calcium dependence. A simple model that incorporates a calcium-driven process with slow kinetics is proposed to account for the calcium dependence of DR.
Portions of this study have been published in abstract form (Atluri and Regehr, 1997).
MATERIALS AND METHODS
Transverse cerebellar slices (300 μm thick) were cut from 13- to 17-d-old Sprague Dawley rats, as described previously (Llano et al., 1991; Atluri and Regehr, 1996). Experiments were conducted at 23 ± 0.5°C, unless otherwise indicated. The control external solution (2 ml/min flow rate) consisted of (in mm): 125 NaCl, 2.5 KCl, 2 CaCl2, 1 MgCl2, 26 NaHCO3, 1.25 NaH2PO4, 25 glucose, 0.02 bicuculline, and 0.05d,l-2-amino-5-phosphonovalerate bubbled with 95% O2/5% CO2. The low-calcium external solution contained 1 mm CaCl2 and 2 mm MgCl2.
For EGTA-AM application experiments a 100 mm stock solution of EGTA-AM in DMSO was aliquoted and frozen. Immediately before use, the aliquots were diluted in external saline to final EGTA-AM concentrations consisting of 100, 20, 5, or 1 μm and DMSO concentrations (by percentage) of 0.1, 0.02, 0.005, and 0.001. EGTA-AM bath applications were 15 min long, with flow rates of 2 ml/min.
Detecting presynaptic calcium transients. Granule cell axons, known as parallel fibers, and presynaptic terminals were labeled by local application of a solution containing the membrane-permeant forms of calcium indicators, as described previously (Regehr and Tank, 1991; Regehr and Atluri, 1995). The loading time was 8–10 min for magnesium green-AM (Molecular Probes) (Zhao et al., 1996). Experiments commenced 2 hr after dye loading. Parallel fiber tracts were stimulated extracellularly with an electrode placed in the molecular layer near the fill site. Fluorescence changes were measured in a 150-μm-diameter spot 400–700 μm away from the stimulus site. The filter set used for magnesium green was a 450–490 nm excitation, an FT510 dichroic, and an LP520 emission filter (Zeiss, Oberkochen, Germany). Fluorescence was detected with a photodiode.
Measuring synaptic currents. Whole-cell recordings of stellate cells (Barbour et al., 1994; Sabatini and Regehr, 1996) were obtained by using 2.0–3.0 MΩ glass pipettes containing an internal solution of (in mm): 35 CsF, 100 CsCl, 10 EGTA, 10 HEPES, 0.1 D600, pH 7.3 with CsOH. Recordings of Purkinje cells used 1.0–2.0 MΩ glass pipettes, with an internal solution of (in mm): 110 Cs2SO4, 10 EGTA, 4 CaCl2, 1.5 MgCl2, 5.5 MgSO4, 4 Na2-ATP, 0.1 D600, 5 QX-314, and 10 HEPES, pH 7.3 with CsOH (Chen and Regehr, 1997). Stellate cells were voltage-clamped at −40 mV and Purkinje cells at −70 mV. The access resistance and leak current of stellate (from 0 to −20 pA) and Purkinje (from 0 to −200 pA) cells were monitored continuously.
Parallel fibers were stimulated extracellularly with a glass microelectrode placed in the molecular layer several hundred microns from the recording electrode. Stimulation rates were once per 7.5 sec or twice per 15 sec for delayed release and paired-pulse facilitation, respectively. These stimulation rates were chosen to allow for the comparison of PPF with our previous study (Atluri and Regehr, 1996). For all of our experimental conditions, by 2000 msec after the conditioning pulse the PPF decayed to <10% (data not shown) from a maximum of ∼480% in 1 mm Ca and 190% in 2 mm Ca. The fast decay phase of the resulting EPSC was well approximated by an exponential with a time constant of 1.5–3 msec for stellate cells and 5–7 msec for Purkinje cells.
Measuring delayed release and facilitation. The first 10 msec of the EPSC, which is composed of many superimposed mEPSCs, was not analyzed. Stellate cell DR was quantified by constructing peristimulus time histograms (bin width, 2 msec) of the occurrence of mEPSCs. For summarizing data taken from several cells, it was necessary to normalize for the number of stimulated fibers. After subtraction of the prestimulus spontaneous mEPSC rate, histograms from each cell were normalized by the number of events from 10 to 1000 msec and then averaged together. For experiments in which cells were studied before and after EGTA-AM or low calcium bath application, the postapplication histogram was normalized by using values from the preapplication histogram, preserving their relative amplitudes.
Facilitation was computed for each Δt in two ways, as 100 (A2 − A1)/A1 and asA2 − A1, where A1 andA2 were the integrated areas of the conditioning and test EPSCs, respectively. These integrations were performed over a 20 msec window. For Δt < 30 msec, the waveform of the conditioning EPSC was subtracted from the superimposed test EPSC before integration of the test EPSC waveform.
Experimental conditions were optimized for the detection of facilitation and delayed release in the 10–1000 msec after stimulation. Small stimulus intensities were used in the study of facilitation to avoid series resistance artifacts. Larger stimulus intensities generally were used to study delayed release to evoke sufficient events in the 10–1000 msec range. There was no systematic difference in the time course or relative amplitude of delayed release on the basis of stimulus intensities. For large stimulus intensities it was generally possible to detect all of the events 10 msec after stimulation. However, it was not possible to detect all of the events immediately after stimulation. For this reason, differences in the time courses of EPSCs, such as those shown in Figures 3A and4A, are best studied with much smaller stimulus intensities than those used in this study (C. Chen, P. Atluri, W. Regehr, unpublished observations).
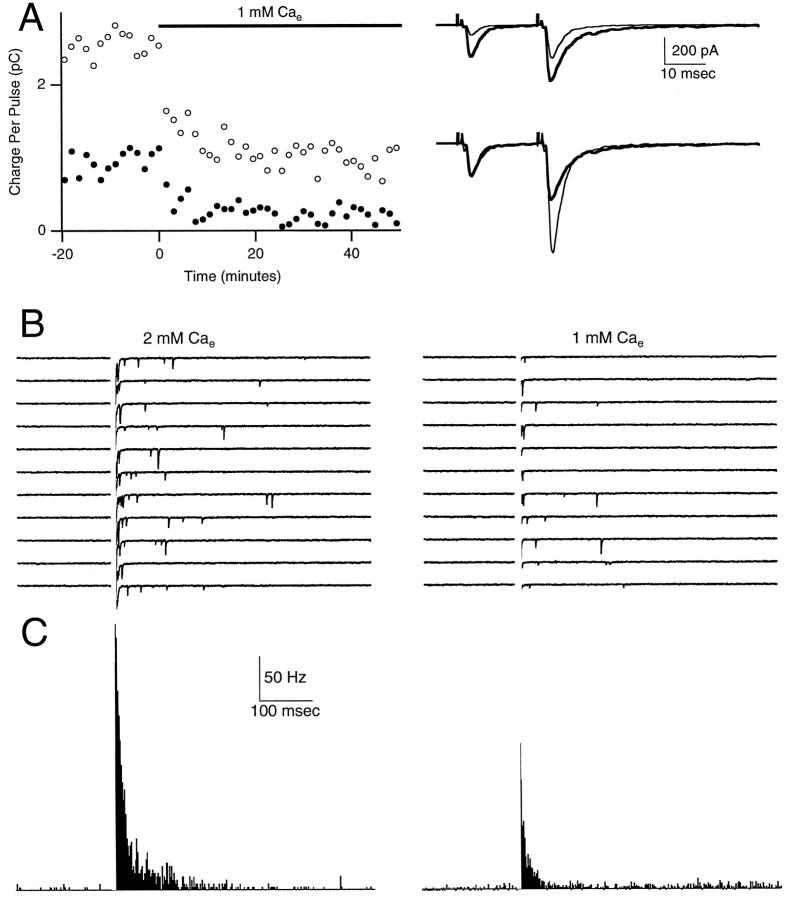
Fig. 3.
Differential effect of external calcium concentration on facilitation and delayed release. Synaptic currents were recorded in 2 mm Ca (control) and during bath application of 1 mm Ca. Each double-pulse facilitation trial (A) was followed by 10 single-pulse delayed release trials (B). A, Areas of conditioning (filled circles) and test (open circles) EPSCs are plotted (left panel) during bath application of 1 mmexternal calcium. The right panel shows traces that are averages of 14 trials for control (thick line) and low calcium (thin line) on the same vertical scale (top panel) or that are normalized (bottom panel) to the peak of the first EPSC. There was a slight decrease in the duration of the facilitated EPSC in 1 mmCae as compared with 2 mm Cae (see Materials and Methods). B, Ten successive traces, each offset vertically by 100 pA, in control (left panel) and low (right panel) calcium. C, Histograms of mEPSCs in control (left panel) and in low calcium (right panel). In B and C the times from 0 to 10 msec have been blanked for clarity.
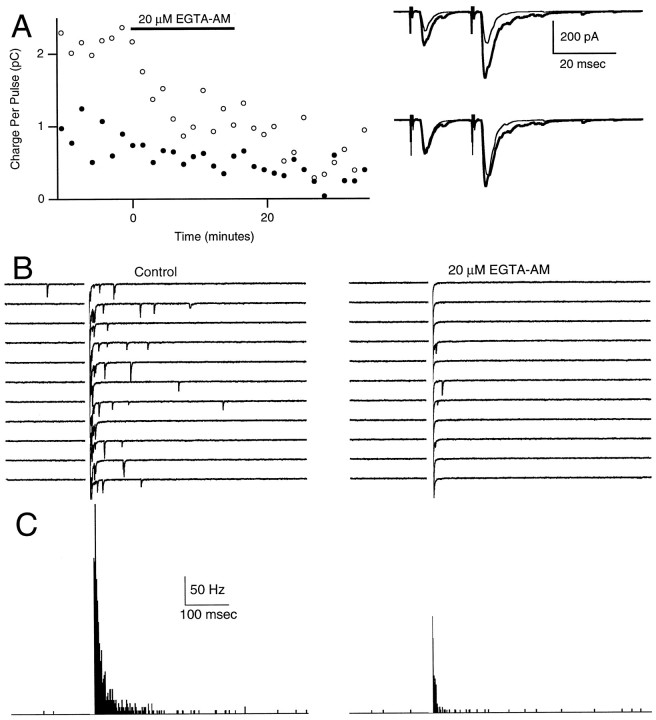
Fig. 4.
Differential effect of 20 μm EGTA-AM on facilitation and delayed release. Double-pulse facilitation trials (A) were interspersed among single-pulse delayed release trials (B). A, Areas of conditioning (filled circles) and test (open circles) EPSCs are plotted (left panel) during a 15 min bath application of 20 μm EGTA-AM. The right panel shows control (thick) and postapplication (thin) traces that are averages of 7 and 13 trials, respectively. The top traces are on the same scale; the bottom tracesare normalized to the peak of the first EPSC. EGTA-AM decreased the duration of the facilitated EPSC (see Materials and Methods).B, Ten successive trials before (left panel) and after (right panel) treatment with EGTA-AM. C, Histograms of mEPSCs before (left panel) and after (right panel) EGTA-AM treatment. In B andC the times from 0 to 10 msec have been blanked for clarity.
Conditions of high release probability were avoided for two reasons. First, we wished to avoid saturation of release. From previous studies we know that, at this synapse, release is well approximated by a power law, with n = 2.5 for external calcium concentration (Cae) levels up to 2 mm (Mintz et al., 1995), but that saturation is apparent when Cae is >2.5 mm. Similarly, two-pulse DR experiments (see Fig. 8) were conducted in 1 mm Cae to avoid saturation of release. Second, for conditions of high release probability, such as for three pulses in 2 mm Cae and for all experiments in higher Cae, the shape of the stellate cell EPSC becomes prolonged; with sufficient numbers of pulses it can depart from a single exponential decay, developing a plateau phase that can last for hundreds of milliseconds (P. Atluri, B. Sabatini, A. Carter, and W. Regehr, unpublished observations). This component reversed at ∼0 mV and was completely blocked by either 6-cyano-7-nitroquinoxaline-2,3-dione or GYKI. It is likely a consequence of spillover of neurotransmitter release. In the experiments that were used in this work, such a component was not present.
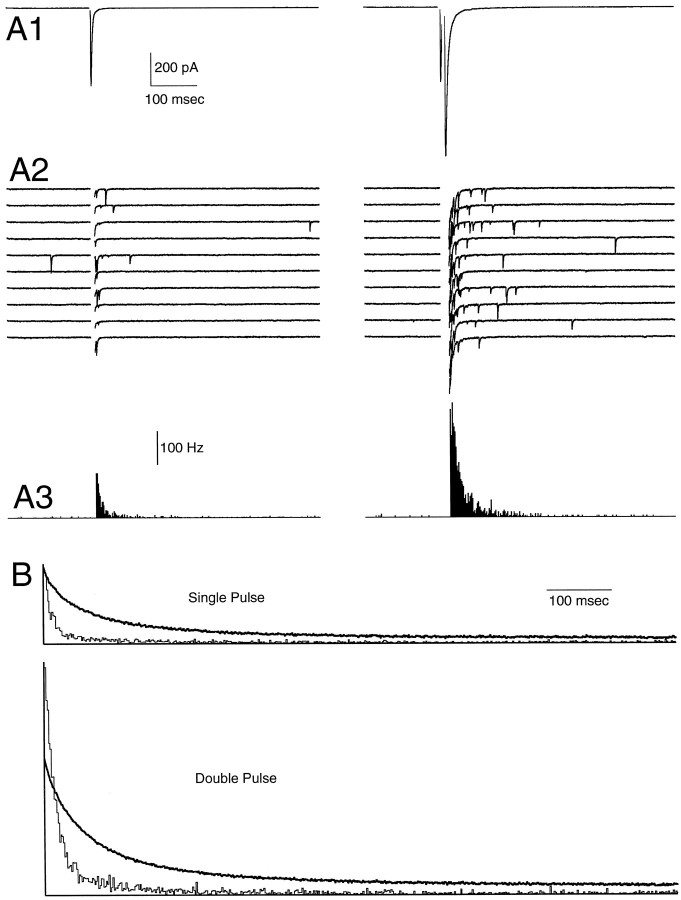
Fig. 8.
The effect of the number of stimulus pulses on presynaptic Ca transients and delayed release in 1 mmexternal Ca. Shown are phasic EPSCs (A1), delayed mEPSCs (A2) in 10 consecutive trials, and mEPSC histograms (A3) for single-pulse (left panels) or double-pulse (right panels) stimuli. Times from 0 to 10 msec (left panels) or from 0 to 20 msec (right panels) are blanked for clarity (A2,A3). B, Normalized average calcium transients (top traces) and delayed release histograms after single (top panel) or double (bottom panel) pulses.
For practical reasons the experiments were not conducted in conditions of extremely low release probability. As a consequence of the steep calcium dependence of the first component of delayed release, we found that, in 0.5 mm Cae, it was difficult to obtain a sufficient number of events. We also performed a number of experiments with BAPTA-AM, but these too were not suitable for quantitative analysis. The strategy was to use this fast buffer to reduce the size and slow the calcium transient and then to test the effect on delayed release. Our model for DR predicted a large reduction in the number of events and a slowing of the decay of delayed release. Qualitatively, this appeared to be the case. However, although BAPTA-AM had the desired action on the calcium transient, there was variability in the magnitude of this effect. Combined with the steep calcium dependence of delayed release, this variability in the calcium transient amplitude led to a much higher variability in the magnitude of delayed release after loading with BAPTA-AM.
Data acquisition and analysis. Outputs of the photodiode and Axopatch 200A were filtered at 500 and 2 kHz, respectively, with a model 900C9L8L eight-pole Bessel filter (Frequency Devices, Haverhill, MA) and digitized with a 16-bit D/A converter (Instrutech, Great Neck, NY), Pulse Control software (Herrington and Bookman, 1995), and an Apple Macintosh Centris 650 computer. Analysis was done on- and off-line with Igor Pro software (WaveMetrics, Lake Oswego, OR). Exponential fits to facilitation were performed with Δtbetween 10 and 1000 msec. The amplitude of facilitation was calculated from this fit for Δt = 10 msec. Double-exponential fits to calcium measurements and to delayed release histograms (see Table 1) were performed between 10 and 1000 msec poststimulus, except as noted.
Table 1.
Calcium and delayed release curves
| Condition | Calcium | Delayed release | ||||||||||
|---|---|---|---|---|---|---|---|---|---|---|---|---|
| A | B | τ1 | C | τ2 | n | A | B | τ1 | C | τ2 | n | |
| Control1-a | 0.088 | 0.33 | 189 | 0.58 | 44 | 20 | 0.003 | 0.14 | 78 | 0.86 | 11 | 28 |
| 1 μmEGTA-AM1-a | 0.064 | 0.19 | 163 | 0.65 | 33 | 5 | 0.002 | 0.07 | 64 | 0.64 | 8 | 4 |
| 5 μmEGTA-AM | 0.063 | 0.17 | 97 | 0.56 | 16 | 7 | 0.004 | 0.13 | 15 | 0.42 | 4 | 4 |
| 20 μmEGTA-AM1-a | 0.064 | 0.29 | 36 | 0.32 | 10 | 5 | 0.002 | 0.19 | 5 | 0.02 | 1 | 3 |
| 100 μmEGTA-AMa,b | 0.019 | 0.11 | 3 | — | — | 5 | — | — | — | — | — | 3 |
| 1 mm Cae, 1 pulse | 0.040 | 0.26 | 176 | 0.33 | 37 | 10 | 0.003 | 0.06 | 57 | 0.26 | 8 | 13 |
| 1 mm Cae, 2 pulses | 0.080 | 0.39 | 193 | 0.67 | 46 | 5 | 0.002 | 0.06 | 147 | 0.77 | 17 | 5 |
Calcium (ΔF/F) and delayed release curves from various experimental conditions were fit to an equation of the form: A + B · e−t/τ1 + C · e− t/τ2, with constant coefficients A, B, and C and with slow and fast time constants τ1 and τ2, respectively. Normalization was relative to control conditions at 10 msec poststimulus. Time is measured in milliseconds.
These calcium curves are from Atluri and Regehr (1996).
Wash-in of 100 μm EGTA-AM greatly decreased both presynaptic calcium and delayed release; the calcium curve was very small and was fit to a single-exponential equation, whereas the delayed release curve was essentially flat and so was not fit.
RESULTS
Delayed release at the granule to Purkinje cell and granule to stellate cell synapses
Synaptic currents produced by single-pulse stimulation of parallel fibers were recorded from both Purkinje cells and stellate cells. Figure 1A1 shows the average EPSC measured in a Purkinje cell, and 10 sequential trials from this experiment are shown in Figure 1A2. Corresponding recordings from a stellate cell are shown in Figure 1,B1 and B2. As shown in Figure1B3, the time course of release probability elevation could be quantified by constructing a peristimulus time histogram of mEPSC occurrence for the granule cell to stellate cell synapse.
Fig. 1.
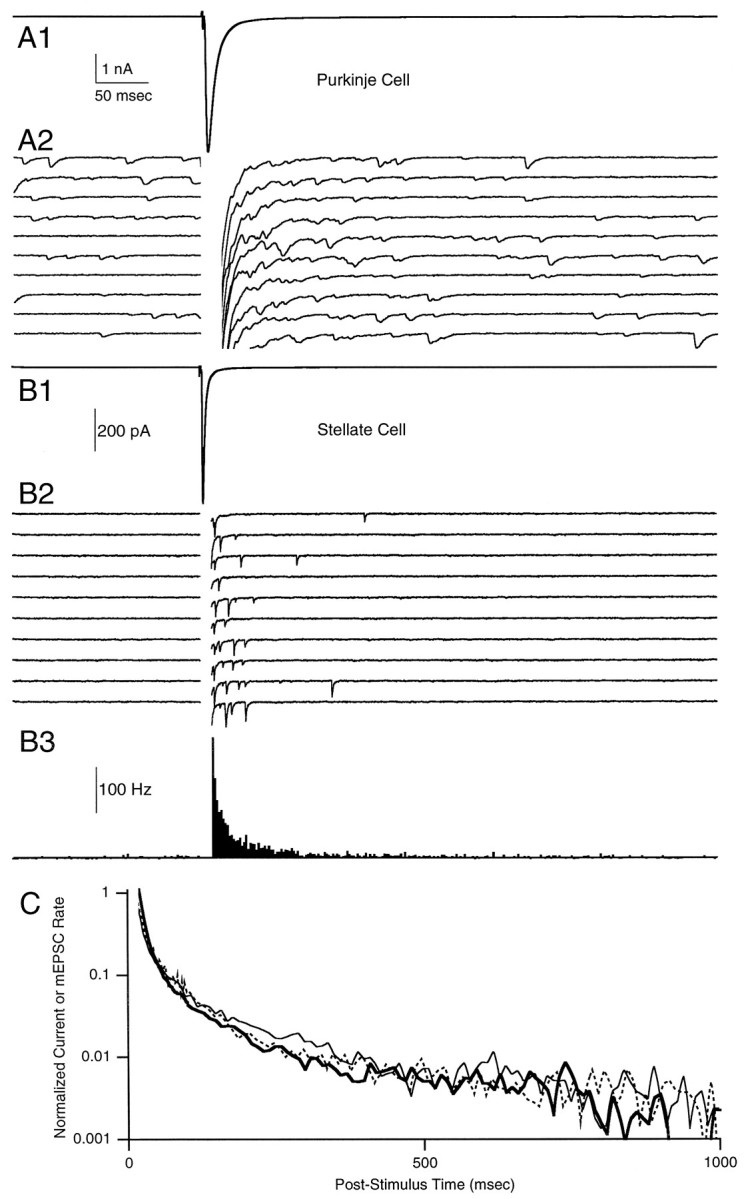
Comparisons of phasic and delayed release at the granule cell to Purkinje (A) and granule cell to stellate (B) cell synapses evoked by 0.133 Hz electrical stimulation of the parallel fibers. Shown are phasic EPSCs (A1, B1) and 10 consecutive trials showing delayed mEPSCs (A2, B2). These trials are blanked from 0 to 20 msec (A2) or from 0 to 10 msec (B2) for clarity and are offset vertically by 200 and 100 pA, respectively. The peristimulus time histogram (B3) of the stellate cell mEPSCs is blanked from 0 to 10 msec. C, Semilogarithmic plot of normalized representative Purkinje (thick line) and stellate (thin line) cell EPSCs (same traces asA1 and B1) and stellate cell mEPSC histogram (dashed line). Traces in A1 andB1 are averaged from 197 and 392 trials, respectively. With an approximation of the decays of synaptic currents with single exponentials, the time constants of decay for the average mEPSC and evoked EPSC are 6.4 and 7.8 msec for the Purkinje cell inA and 0.8 and 2.3 msec for the stellate cell inB. The synaptic current measured in A is somewhat slowed, because large stimulus strengths were used to accentuate the delayed release of neurotransmitter. The spontaneous mEPSC frequency was 9.9 Hz for the Purkinje cell in Aand 0.03 Hz for the stellate cell in B.
A comparison of Figure 1, A and B, reveals some obvious differences in the synaptic currents recorded in these two cell types. The time courses of mEPSCs and evoked EPSCs are both much faster in stellate cells than in Purkinje cells. This is consistent with previous findings at these synapses and is thought to reflect the prolonged presence of glutamate at the granule cell to Purkinje cell synapses (Barbour et al., 1994). In addition, spontaneous mEPSC frequencies are much higher in Purkinje cells than in stellate cells, likely reflecting the relative number of synapses onto these two cell types.
Despite these differences the timing of transmission from parallel fibers onto these two postsynaptic targets is remarkably similar. At both types of synapses the mEPSC frequency is elevated transiently after the phasic EPSC, reflecting an increase in the probability of release. Figure 1C, which compares the time courses of the normalized average Purkinje and stellate cell EPSCs (Fig.1A1,B1) and the normalized average stellate cell mEPSC histogram (Fig. 1B3), also suggests that delayed release is quantitatively similar in these two types of cells. The rationale for using the EPSC as a measure of the time course of delayed release [a similar approach has been used previously (Goda and Stevens, 1994)] requires that (1) mEPSCs be short-lived as compared with the time course of release probability, (2) mEPSCs summate linearly, and (3) no other currents contribute to the synaptic current. The good agreement between the stellate cell histogram and EPSC shows that, for our conditions, stellate cell EPSCs are accurate measures of the neurotransmitter release probability time course. Also, the agreement between Purkinje and stellate cell EPSCs strongly suggests that the granule cell presynaptic terminals that synapse on Purkinje and stellate cells have very similar time courses of release probability.
Because asynchrony of release can occur on rapid time scales (Katz and Miledi, 1964; Diamond and Jahr, 1995; Isaacson and Walmsley, 1995), identifying the transition between phasic and delayed release is difficult. An operational distinction derives from the observation of multiple components in the decay of release rate and from the differential effects of pharmacological agents and gene knock-outs (Miledi, 1966; Zengel and Magleby, 1980; Geppert et al., 1994). Here, we study the quantal release of neurotransmitter in the 10 msec to 1 sec after stimulation of the presynaptic terminal. Although Figure1C suggests that average EPSCs can provide a good measure of the time course of delayed release in this time period, we feel that the detection of individual events is more reliable. The ease with which the very rapid mEPSCs can be discriminated, combined with the low spontaneous mEPSC frequency, makes stellate cells ideal for the detection of individual mEPSCs and for studies of delayed release. Thus, for the remainder of the paper, we focus primarily on the detection of individual mEPSCs and the study of delayed release and facilitation in stellate cells.
Facilitation at the granule cell to stellate cell synapse
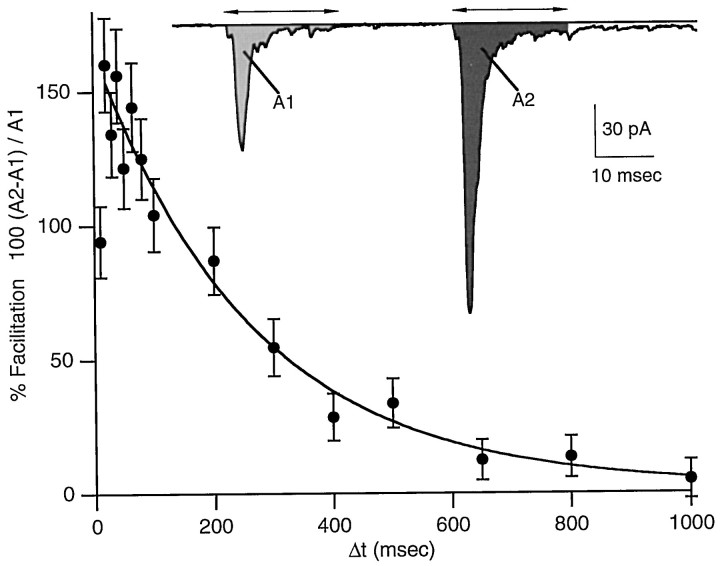
The granule to stellate cell synapse demonstrates robust paired-pulse facilitation (Fig. 2). The inset of Figure 2 shows two EPSCs produced by stimulus pulses separated by 40 msec. The second EPSC is much larger than the first, reflecting an enhancement of the probability of glutamate release from granule cell presynaptic terminals. This enhancement in evoked release probability is transient, as shown in the main panel of Figure 2. In this cell the peak amplitude of PPF was ∼160%, and PPF decayed monoexponentially with a time constant of 265 msec. For a series of such experiments (n = 6), the amplitude of PPF was 181 ± 32% and the time constant of decay was 227 ± 27 msec, which is similar to that described previously at the granule cell to Purkinje cell synapse [amplitude, 153 ± 11%; tau, 203 ± 18 msec; n = 15 (Atluri and Regehr, 1996)].
Fig. 2.
Paired-pulse facilitation at the granule to stellate cell synapse. The percentage of facilitation of integrated EPSC areas, 100 (A2 −A1)/A1, is plotted as a function of interstimulus interval. Each point is the mean PPF ± SEM; n = 10. The smooth curve is a monoexponential fit, omitting the first data point.Inset, Synaptic currents evoked by extracellular stimulation of the parallel fibers with pulses separated by 40 msec. The shaded areas labeled A1 andA2 illustrate the integration times that were used to calculate the charge per pulse.
A comparison of DR and PPF is a special case of the more general problem of the relationship between mEPSC frequency and evoked EPSC amplitude at some time. We define DR as the frequency of mEPSCs, which, within an experiment, is proportional to the probability of release,pr. PPF was computed in two ways:A2 − A1 and the more traditional measure, 100 (A2 − A1)/A1. If we assume that the number of release sites, n, is fixed, then the values of A1 and A2 are proportional top(0) and p(Δt), the probabilities of evoked release in the instant before and at time Δt after the conditioning pulse, respectively. A2 −A1 is a measure proportional to the absolutechange in evoked release probability, Δp =p(Δt) − p(0), whereas the traditional measure of PPF is proportional to the relativechange in evoked release probability, Δp/p(0). As such, we feel that A2 − A1 is better suited for comparison to DR, although we also report the more traditional measure of facilitation.
Manipulations of presynaptic calcium transients have differential effects on facilitation and delayed release
A comparison of delayed release (see Fig.1B) and facilitation (Fig. 2) at the granule cell to stellate cell synapse suggested that these synaptic phenomena have different time courses. This prompted us to explore further the calcium dependence of these phenomena.
We tested the effects on DR of lowering Cae and altering presynaptic calcium transients with EGTA, both of which have been shown to affect facilitation (Atluri and Regehr, 1996). We took two approaches to compare facilitation and delayed release. First, in some experiments such as those shown in Figures3 and 4, facilitation and delayed release were both monitored. In such experiments paired-pulse facilitation was monitored for a single interpulse interval (Δt = 20 msec), using small stimuli that would allow for an accurate determination of the magnitude of facilitation. These trials were separated by 10 trials that used single stimuli of a higher intensity to examine delayed release (see Materials and Methods for more details). Second, a series of experiments was conducted in which facilitation was measured for a series of interpulse intervals for the same experimental conditions as in Figures 3 and 4; these curves are summarized in Figure5, where they are compared with the delayed release histograms. Because it took many trials to obtain facilitation curves and delayed release histograms, it was generally not practical to obtain both sets of data for a cell in both experimental conditions.
Fig. 5.
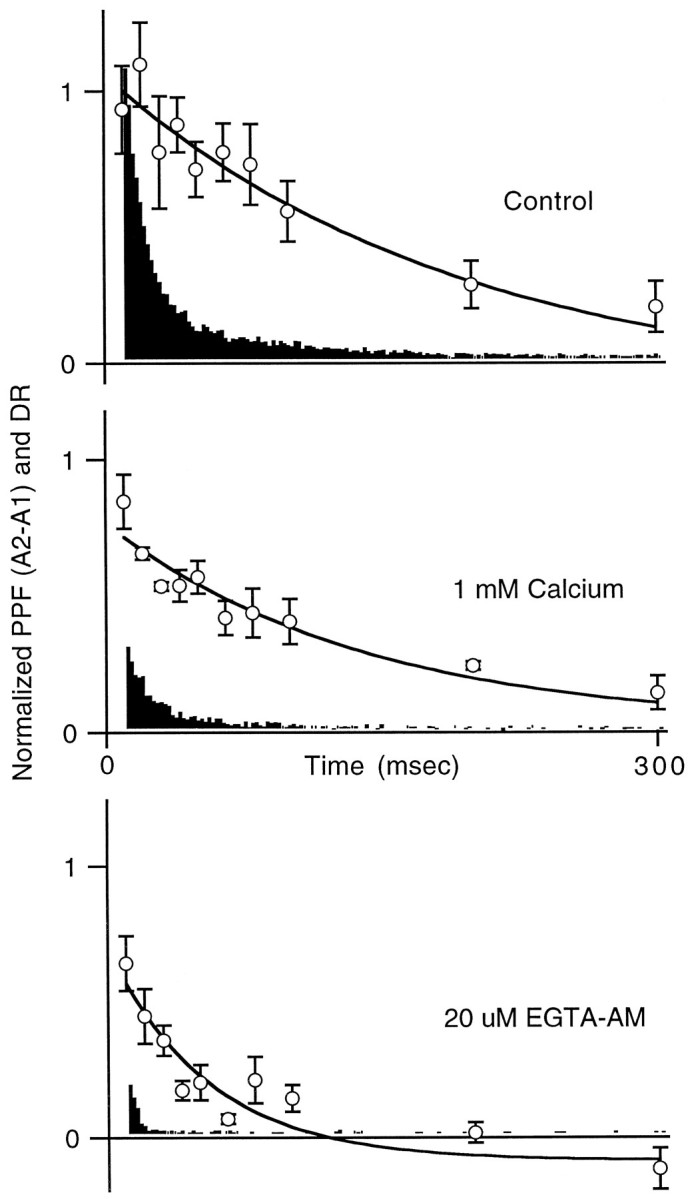
Summary of the effect of low calcium and 20 μm EGTA-AM on facilitation and delayed release. The average time course, from 0 to 300 msec, of A2 −A1 facilitation (open circles) and delayed release are plotted together for control (top), low calcium (middle), and 20 μmEGTA-AM-treated slices (bottom). Delayed release histograms for low calcium and for 20 μm EGTA-AM first were normalized by the associated pretreatment histograms from each cell and then were averaged together.
In Figure 3, Cae was lowered from 2 to 1 mmwhile both facilitation and delayed release were monitored. Reducing Cae decreased the peaks and areas of EPSCs evoked by conditioning pulses and the test pulses. Facilitation, defined as (A2 − A1)/A1 orA2 − A1, increased by 111% ordecreased by 48%, respectively. There was an even greater decrease in delayed release, as shown in the raw traces of Figure3B and in the histograms of Figure 3C. In this experiment the amplitude of delayed release at 20 msec poststimulus was decreased by ∼68%, but the time course of delayed release was not altered significantly. [The experiment shown here is unusual in that the spontaneous mEPSC rate was higher in 1 mm Ca. In a series of such experiments (n = 7) the spontaneous mEPSC rate decreased from 3.4 ± 1.4 Hz in 2 mm Ca to 1.6 ± 0.6 Hz in 1 mm Ca.]
Another way of manipulating presynaptic calcium transients is to load parallel fibers with EGTA (Atluri and Regehr, 1996; Feller et al., 1996). The introduction of this slow but high-affinity calcium buffer has small effects on the amplitude of the calcium transients but greatly speeds the decay of residual calcium, [Ca]i. The introduction of EGTA does not alter significantly the resting calcium level (which is set by the balance of influx vs efflux; see Tank et al., 1995). By the use of a membrane-permeant form of EGTA (EGTA-AM), it is possible to introduce high concentrations of EGTA into presynaptic terminals (free EGTA levels in the presynaptic terminals can be much higher than the extracellular concentration of EGTA-AM). Application of the membrane-permeant calcium chelator EGTA-AM has been shown to alter the time courses of presynaptic calcium transients in parallel fibers in a dose-dependent manner (Atluri and Regehr, 1996). High concentrations of EGTA-AM also have been shown to eliminate delayed release at other synapses (Cummings et al., 1996). In Figure 4, facilitation and delayed release were measured before and after the application of 20 μm EGTA-AM. EGTA-AM slightly decreased the amplitudes of both the conditioning and the test pulses, and reduced (A2 − A1)/A1facilitation by 39%, A2 − A1 facilitation by 71%, and the amplitude of delayed release (at 20 msec) by 96% (Fig. 4B,C).
From Figures 3 and 4 it is apparent that manipulations of calcium entry and calcium dynamics had differential effects on facilitation and DR. The traditional measure of facilitation, (A2 −A1)/A1, tended to overemphasize these differences, but they remained even when A2 −A1 facilitation was used. Figure 5 summarizes the results of a series of experiments measuring facilitation and delayed release in control conditions (top panel), in low external calcium (middle panel), and after treatment with 20 μm EGTA-AM (bottom panel). Each panel shows a normalized plot of A2 −A1 facilitation and delayed release. In all cases the time courses of decay of facilitation (control, 223 msec; 1 mmCa, 141 msec; EGTA, 55 msec) are slower than those of delayed release (see Table 1), suggesting that the two processes are not identical.
The calcium dependence of delayed release from granule cell presynaptic terminals
The manipulations of presynaptic calcium levels that are presented in Figures 3 and 4 established the importance of presynaptic calcium to delayed release at this synapse. To study directly how delayed release depends on presynaptic residual free calcium concentration in parallel fibers ([Ca]i), we measured [Ca]i(Regehr and Atluri, 1995; Atluri and Regehr, 1996). Several manipulations were used to alter the [Ca]i transient evoked by single stimuli: (1) external calcium levels (Cae) were reduced, (2) presynaptic Ca buffering was altered, and (3) the number of action potentials was increased. During these manipulations we monitored the amplitudes and time courses of [Ca]i and delayed release.
We used the low-affinity calcium-sensitive indicator magnesium green (Zhao et al., 1996) and previously described methods to measure [Ca]i (Regehr and Atluri, 1995). The normalized change in the fluorescence of magnesium green (ΔF/F) is directly proportional to changes in [Ca]i and can be used to measure the time course of presynaptic calcium transients and to detect changes in calcium entry. Although these methods do not provide a reliable measure of the brief, highly localized calcium signals that drive phasic release (Fogelson and Zucker, 1985; Simon and Llinás, 1985;Roberts, 1993), they are well suited to measuring [Ca]ion a time scale relevant to delayed release. After an action potential, calcium-binding proteins rapidly chelate Ca as it spatially equilibrates by diffusion throughout the terminal. Provided that the kinetics of Ca-binding proteins are rapid and that the presynaptic boutons are small, spatial and chemical equilibration can occur within several milliseconds (Connor and Nikolakopoulou, 1982; Sala and Hernandez-Cruz, 1990; Roberts, 1994; Sabatini and Regehr, 1998). After equilibration, average nerve terminal free Ca levels are tens to hundreds of nanomolars above resting levels and may be detected by fluorescent dyes. Then Ca is extruded from the terminal and returns to resting levels over a period of hundreds of milliseconds.
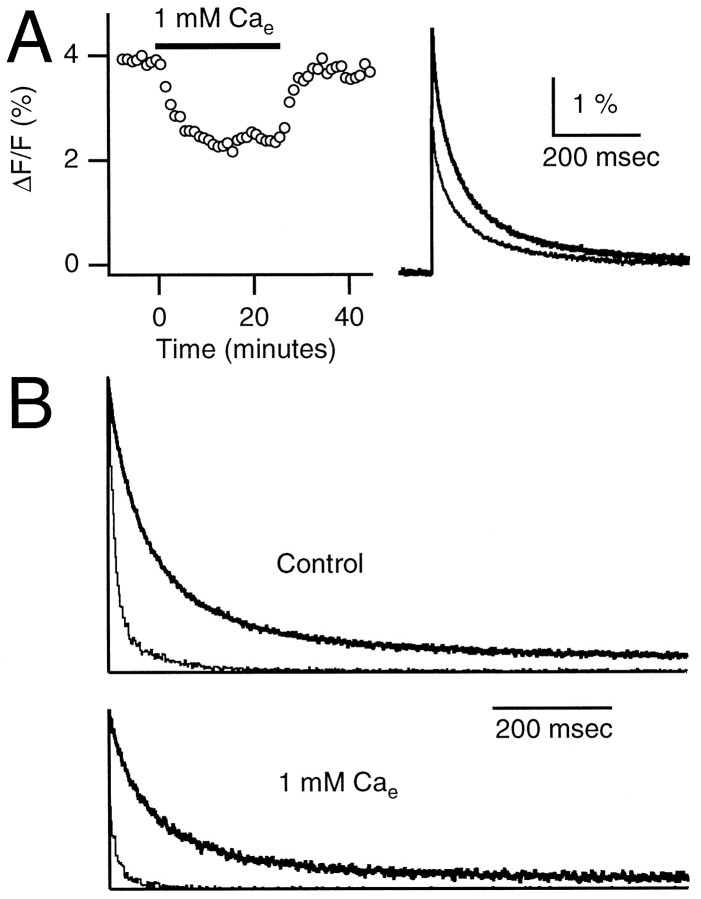
Lowering external calcium decreases the size of the ΔF/F signal, as shown in a representative experiment in Figure6A. The left panel shows the reversible effect of lowering Cae from 2 to 1 mm on peak ΔF/F transients. The right panel shows ΔF/F transients before and during the 1 mm Cae bath application. In this experiment the peak decreased by 40%, although the time course remained unchanged.
Fig. 6.
The effect of external Ca concentration on presynaptic Ca transients and delayed release. Fluorescence (ΔF/F) transients were monitored in granule cell presynaptic terminals by the low-affinity Ca dye magnesium green. A, Circles (left panel) represent peaks of fluorescence transients during a change in the bath solution from 2 mm Cae(right panel, top trace) to 1 mm Cae (right panel, bottom trace). B, Normalized average calcium transients (thick traces) and delayed release histograms (thin traces) are shown in 2 mmCae (top panel) and 1 mmCae (bottom panel), respectively.
Figure 6B compares the average time courses of [Ca]i and delayed release for control conditions (top panel) and in low calcium (bottom panel). In both conditions [Ca]i and delayed release could be approximated by double-exponential decays, and in both control and low calcium the early and late components of release probability both decayed much more rapidly than did [Ca]i (see Table 1). Lowering external Ca decreased the amplitudes of [Ca]i and delayed release by 38 and 75%, respectively (measured at 20 msec), without significantly altering their time courses.
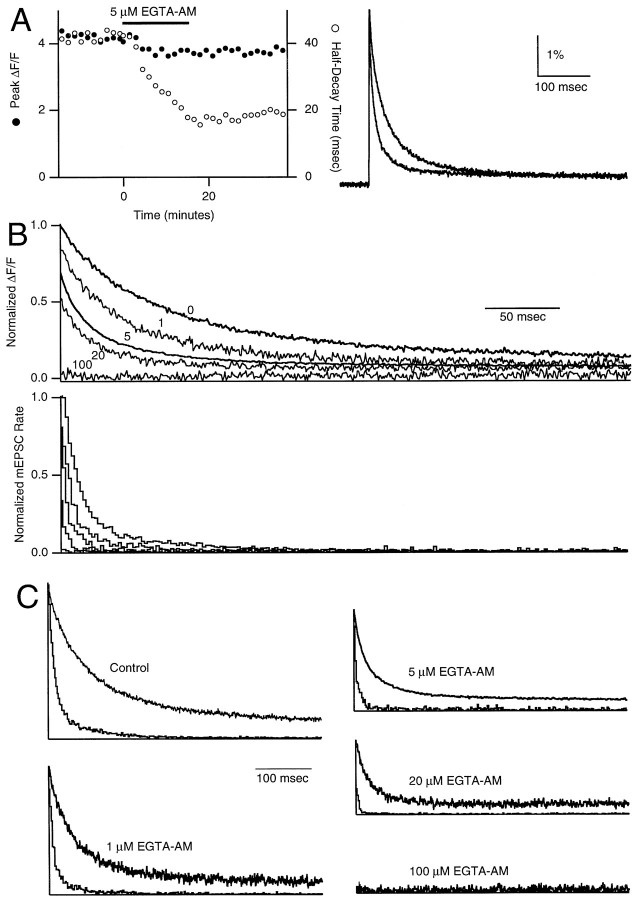
We took advantage of the effects of EGTA on the calcium transient to examine the relationship between the time course of [Ca]iand that of neurotransmitter release probability. In Figure7A, we show a representative experiment in which 5 μm EGTA-AM was applied to a slice for 15 min. EGTA decreased the peak of the ΔF/Ftransient by 11% and decreased its half-decay time from 40 to 17 msec. Treatment with different concentrations of EGTA-AM led to a dose-dependent speeding of decay times [Fig. 7B, top panel; 0, 1, 20, and 100 μm traces replotted from Atluri and Regehr (1996)]. Release probability histograms after EGTA-AM treatment revealed a diminution of both the amplitude and duration of delayed release. A direct comparison of calcium and delayed release for various EGTA-AM concentrations showed that in all cases the release probability declined more rapidly than does calcium (Fig.7C, Table 1). The introduction of very high concentrations of EGTA (in the 100 μm EGTA-AM experiments) eliminated delayed release.
Fig. 7.
The effect of EGTA-AM concentration on presynaptic Ca transients and delayed release. Fluorescence (ΔF/F) transients were monitored as in Figure 6. A, Filled and open circles (left panel) represent peaks and half-decay times, respectively, of fluorescence transients before (right panel, top trace) and after (right panel, bottom trace) a 15 min application of 5 μm EGTA-AM. B, Application of 0, 1, 5, 20, or 100 μm EGTA-AM causes a dose-dependent diminution and acceleration of normalized average presynaptic Ca transients (top panel) and delayed release histograms (bottom panel).C, Comparison of normalized average calcium transients (top traces) and delayed release histograms from 0, 1 5, 20, and 100 μm EGTA-AM experiments.
We also examined the effect of the number of stimuli on the delayed release of neurotransmitter. We measured delayed release or magnesium green fluorescence after a single stimulus and after two stimuli separated by 10 msec. These experiments were performed in 1 mm Cae to lower the initial probability of release sufficiently to reduce the depression of transmitter release after a double stimulus, which could complicate the interpretation of such experiments if they were performed in 2 mmCae. Figure8A shows a representative experiment. There is clear facilitation of phasic transmitter release in response to the second of two stimulus pulses, as shown in Figure 8A1. In addition, after two pulses there is a large increase in DR (compare Fig. 8A2with A3). In this experiment there was a 185% increase in the total number of events (from 20 to 1000 msec after the final pulse) for the double-pulse trials as compared with the single-pulse trials. The time course of delayed release was significantly slower after two pulses than after a single pulse, whereas the time course of calcium was only slightly slower after two pulses than after a single pulse (see Table 1). As shown in Figure 8B, DR decays more rapidly than does calcium after either single or double pulses. However, increasing the pulse number has a much larger effect on the 20 msec amplitude of delayed release (which increased by 369%) than on the 20 msec amplitude of calcium (which increased by 88%).
Modeling delayed release
We investigated several approaches to modeling the calcium dependence of delayed release. Initially, DR was assumed to be a function of the calcium, [Ca]i, that was present in the presynaptic terminal,
| Equation 1 |
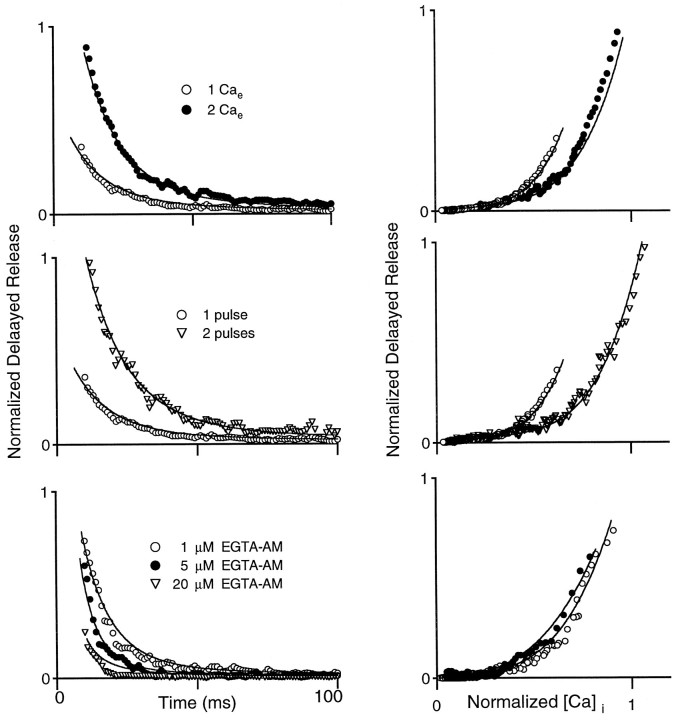
where A, B, and n are constants. This equation has been shown previously to describe the relationship between calcium and the frequency of quantal release of neurotransmitter at the crayfish neuromuscular junction (Delaney and Tank, 1994; Ravin et al., 1997). We found that, for each of the experimental conditions in this study, Equation 1 could provide a good approximation to the observed delayed release (data not shown). However, if delayed release is a function of intracellular calcium levels, a single set of parameters should describe the relationship between calcium and delayed release for all of the conditions (Figs.6-8). This is not the case. As illustrated in Figure9, curves relating DR to internal calcium levels measured in 1 mm Cae (open circles) and 2 mm Cae (filled circles) do not superimpose. For A = 0.08, B = 1.0, andn = 3.5, this model overpredicts delayed release for 2 mm Cae and underpredicts delayed release for 1 mm Cae (Fig. 9A). Furthermore, no single set of parameters provides a good description of delayed release for the different external calcium conditions. The reason for this is apparent in Figure 9B, in which the delayed release is plotted as a function of the calcium concentration for 1 and 2 mm Cae. Although for low [Ca]ithese curves superimpose, for high [Ca]i they deviate markedly. Models that assume delayed release to be a function of calcium that is present in the terminals at that instant predict that all curves relating delayed release and calcium should superimpose; such models cannot account for the relationship between delayed release and calcium in Figure 9B. In Figure10 we also plot DR as a function of [Ca]i for experiments varying external Ca (top panels), pulse number (middle panels), or EGTA-AM treatment (bottom panels). These DR versus Ca curves do not superimpose, and the differences are pronounced in experiments with one and two pulses (middle panels).
Fig. 9.
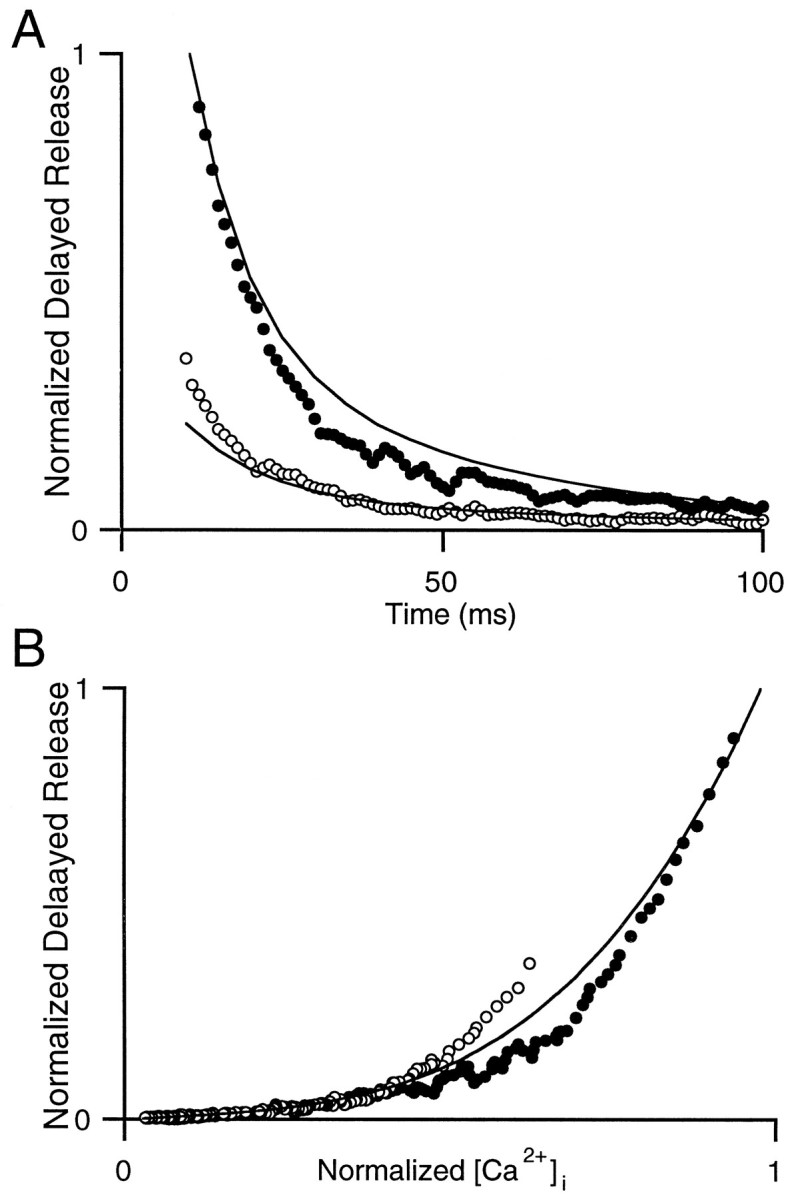
Steady-state models relating calcium to delayed release are inadequate. A, Normalized delayed release versus time in the presence of 1 mm Cae(open circles) and 2 mm Cae(filled circles). Solid lines were computed by using Equation 1, with A = 0.08,B = 1.0, and n = 3.5, and calcium transients were measured experimentally (normalized to the calcium value at 10 msec in control conditions). B, Delayed release versus normalized [Ca]i for 1 mm Cae (open circles) and 2 mm Cae (filled circles). The solid line is the computed delayed release versus the normalized calcium transient from A. The curves that were calculated for 1 and 2 mm Caeoverlap.
Fig. 10.
Summary plots of delayed release versus presynaptic calcium levels after parallel fiber stimulation. Shown is normalized delayed release as a function of time (left panels) and as a function of calcium concentration (right panels) in 1 and 2 mm Cae(top), for one and two pulses in 1 mmCae (middle), and after loading with 1, 5, and 20 μm EGTA-AM (bottom). Graphs to theright correspond to graphs on the left, and the same symbols are used. In the bottom right graphthe 20 μm EGTA-AM graph was not included for clarity.Solid curves are computed according to Equation 2, as described in Results.
On the basis of what is known about the timing of transmitter release and the role of calcium in use-dependent processes (Stanley, 1986;Yamada and Zucker, 1992; Regehr et al., 1994; Atluri and Regehr, 1996;Bertram et al., 1996), it is not surprising that the assumption of calcium instantaneously affecting the rate of delayed release appears to be an oversimplification. The most straightforward way to account for the relationship between calcium and DR for different experimental conditions (Figs. 9B, 10) is to include the time dependence of a calcium-driven process:
| Equation 2 |
with A, B, τ, and nconstants. As in Equation 1, delayed release is made up of two components. However, the second component is now both time-dependent and calcium-dependent. The term represents the remnant of a process with slow kinetics that is driven by high local calcium levels immediately after action potential invasion of the presynaptic terminals. The calcium-dependent term, [Ca]in, corresponds to multiple calcium ions binding to sites that respond rapidly to changes in calcium levels and that must all be occupied for release to occur. Although this model posits two additive components of delayed release, it is not known whether they rely on distinct molecular mechanisms or whether they share some of the same molecular machinery.
As shown in Figure 10, fits based on this simple scheme provide a good description of the relationship between calcium and the rate of delayed release for a variety of experimental conditions. The symbols in Figure10 show the normalized delayed release as a function of time (left) or as a function of normalized calcium concentration (right) after stimulation by one or two pulses in a variety of experimental conditions. The lines are values of DR calculated with Equation 2, using the calcium transient measured for the corresponding experimental conditions (normalized to the value measured in control conditions at 10 msec in 2 mm Cae). The same parameters were used for all simulations (A = 0.1,B = 1.25, τ = 28 msec; n = 2.5). Thus it is possible to relate [Ca]i and delayed release with a simple model that incorporates the time dependence of release.
Delayed release at higher temperatures
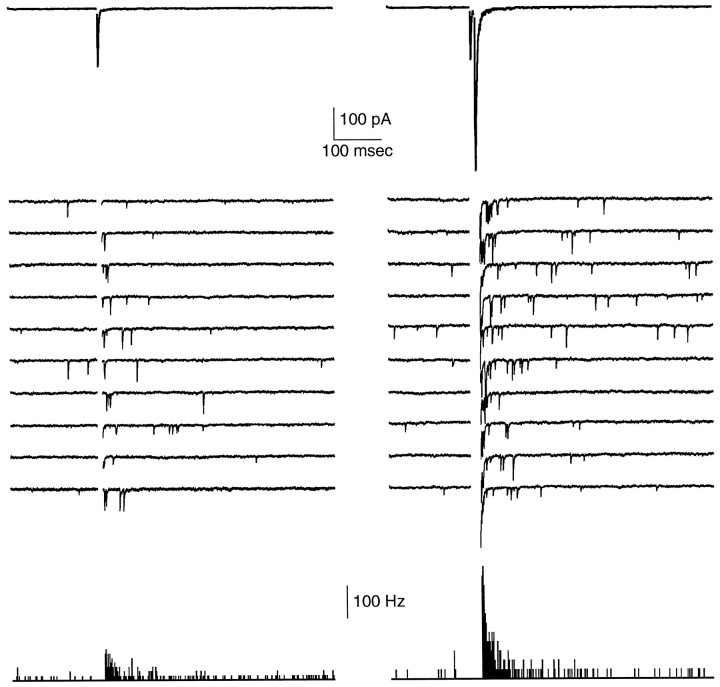
Experiments described thus far have been directed toward characterizing the properties of delayed release at this synapse and in particular the role of calcium in delayed release. These studies were performed at 23°C, owing to the ease of experimentation at room temperature. We also investigated the properties of delayed release at closer to physiological temperatures. As shown in Figure11, delayed release at 33°C was qualitatively similar to that observed at 23°C, although it was somewhat shorter-lived. As at room temperature there was a large increase in the magnitude of delayed release for two pulses compared with that produced by a single pulse. Although these experiments were still performed at lower than physiological temperatures, on the basis of the temperature dependence of the magnitude and time course of delayed release it is reasonable to assume that delayed release of neurotransmitter from cerebellar granule cell terminals is also prominent at physiological temperatures.
Fig. 11.
Delayed release of neurotransmitter that follows one (left panel) and two (right panel) pulses at 33°C. Shown are phasic EPSCs (top), delayed mEPSCs (middle) in 10 consecutive trials, and mEPSC histograms (bottom). For delayed release trials and for mEPSC histograms the times from 0 to 10 msec (right) or from 0 to 20 msec (left) have been blanked for clarity.
DISCUSSION
Comparison of facilitation and delayed release
We tested the hypothesis that facilitation and delayed release share a common underlying mechanism. Both components of DR decayed more rapidly than did facilitation (see Figs. 1, 2, 5). Previous studies of other synapses have reported similar mismatches between the decay of quantal event frequency and the decay of peak release amplitude; in all cases the quantal event frequency decayed more rapidly than did the enhancement of evoked release (Zucker and Lara-Estrella, 1983; Van der Kloot and Molgo, 1994). We also found that DR and PPF differed in their responses to manipulations of presynaptic calcium influx (see Figs. 3,5) and of calcium decay kinetics (see Figs. 4, 5). DR is more sensitive to external calcium concentration than is facilitation. Accelerating the decay of [Ca]i with EGTA-AM (see Appendix of Atluri and Regehr, 1996) sped the decays of both DR and PPF (see Figs. 4, 5), but the initial amplitude of PPF was decreased only slightly, whereas that of DR was markedly reduced. Together, these findings suggest that facilitation and DR are not simple reflections of a common underlying mechanism at granule cell presynaptic terminals.
Calcium dependence of delayed release
A number of manipulations of presynaptic calcium transients provided insight into the [Ca]i dependence of DR. Treatment with high concentrations of EGTA-AM virtually eliminated DR, confirming the calcium dependence of this process (Cummings et al., 1996). Lower concentrations of EGTA-AM sped the decay of both [Ca]i and DR in a dose-dependent manner (see Fig. 7). Even modest concentrations of EGTA-AM, which did not affect the amplitude of calcium significantly at early times, had a profound impact on DR. Furthermore, DR was highly sensitive to manipulations of external calcium concentration, suggesting that the bulk of DR was a consequence of calcium ions acting cooperatively (see Fig. 6).
When DR was plotted as a function of [Ca]i, it appeared to consist of two components, one linearly related to [Ca]i and the other more steeply dependent on [Ca]i (see Fig. 10). Steady-state models in which the frequency of DR was a function of the instantaneous free Ca concentration could not account for the relationship between [Ca]i and DR for all of the conditions of our experiments. This deviation indicates that DR is not solely a function of instantaneous Ca levels.
Incorporating kinetics into the model of DR, as in Equation 2, recognizes that calcium-dependent processes do not necessarily reflect instantaneous calcium levels. This has been shown previously for calcium-driven phasic release (Katz and Miledi, 1964) and for calcium-driven synaptic plasticity (Regehr et al., 1994; Atluri and Regehr, 1996; Zucker, 1996), so it is reasonable to think that time-dependent processes also would influence DR. The simple model we used to relate [Ca]i and DR consists of two components that can be thought of as corresponding to calcium-binding sites with different kinetics and affinities, much like those introduced in previous models of synaptic transmission (Yamada and Zucker, 1992;Bertram et al., 1996). According to such models, release is proportional to the occupancy of multiple binding sites with different properties. Undoubtedly, many other schemes also could relate [Ca]i and DR in our experiments, but this extremely simple model is useful in that it illustrates the ability of a model that incorporates kinetics to relate [Ca]i and DR. In addition, it is clear that the high-power law relationship relating the DR and calcium curves for nonsteady-state conditions must be interpreted with caution.
Our findings help to explain the properties of DR at various synapses, which to a large extent may reflect the calcium dynamics of different types of presynaptic terminals. The magnitude of DR that we observe for one or two pulses applied at high frequency is remarkable. This may reflect the large residual calcium transients that are present in these tiny presynaptic terminals. At many other synapses DR is not so prominent after such a small number of pulses. For example, in crayfish, in which little DR is observed after single stimuli, it is thought that single action potentials increase [Ca]i by tens of nanomolars (Tank et al., 1995). In contrast, single action potentials increase [Ca]i by several hundred nanomolars in granule cell presynaptic terminals (Regehr and Atluri, 1995).
Implications for molecular mechanisms of delayed release
It has been suggested previously that two kinetic components of delayed release at hippocampal synapses might reflect distinct mechanisms involving different molecules (Geppert et al., 1994; Goda and Stevens, 1994). Our observation that two components of DR differ in their calcium dependence supports this hypothesis and constrains the properties of the molecular mechanisms. On the basis of our findings we predict that the binding of a single calcium ion to a binding site triggers one component of DR. We also predict that there is a component of release that is driven by the cooperative binding of multiple calcium ions and that multiple types of binding sites are likely to be involved. This component of DR has many properties in common with phasic release, and it likely involves many of the same molecules, including synaptotagmin I (Geppert et al., 1994). Our findings also suggest that different molecules may be involved in DR and facilitation. It is difficult, however, to eliminate the possibility that the same molecules are involved, yet they have differential effects on spontaneous and evoked release. The calcium dependence of the processes observed here should be helpful in future studies to determine which of the many candidate molecules (Broadie et al., 1995;Zucker, 1996; Wu and Bellen, 1997; Deitcher et al., 1998) are involved in facilitation and in the two components of DR.
Physiological significance of delayed release of neurotransmitter
Most investigations of delayed release have centered on the insight that this phenomenon can provide about synaptic transmission—there has been very little consideration given to the physiological importance of this phenomenon. This is not surprising in considering the DR after a single impulse, as in Figure 1, which shows that the vast majority of synaptic current occurs immediately after a single stimulation, and the sporadic DR of neurotransmitter appears to be insignificant by comparison. Normally, however, neurons do not fire single impulses widely separated in time. More typically, firing rates are tens of Hertz, and neurons often fire in high-frequency bursts (Livingstone et al., 1996; Lisman, 1997). The response to such a burst is revealing. In addition to the large, rapid component of release, two stimulus pulses at 100 Hz produce a barrage of miniature synaptic currents. Over four times as many mEPSCs are observed after two stimuli as are seen after a single stimulus. This sensitivity to pulse number continues for three stimuli, where the integrated synaptic currents for DR actually can be larger than the phasic component of release (P. Atluri and W. Regehr, unpublished observations). It seems likely that DR will influence firing of the postsynaptic cell for hundreds of milliseconds after a stimulus burst of the presynaptic inputs. This suggests the exciting possibility that DR may provide a synapse with a novel type of “short-term memory” that may have important physiological consequences.
Footnotes
This work was supported by National Institutes of Health Grant R01-NS32405-01. We thank A. Carter, C. Chen, J. Dittman, M. Friedman, A. Kreitzer, and B. Sabatini for comments on this manuscript.
Correspondence should be addressed to Dr. Wade Regehr, Department of Neurobiology, Harvard Medical School, 220 Longwood Avenue, Boston, MA 02115.
REFERENCES
- 1.Atluri PP, Regehr WG. Determinants of the time course of facilitation at the granule cell to Purkinje cell synapse. J Neurosci. 1996;16:5661–5671. doi: 10.1523/JNEUROSCI.16-18-05661.1996. [DOI] [PMC free article] [PubMed] [Google Scholar]
- 2.Atluri PP, Regehr WG. Differential calcium dependence of facilitation and asynchronous release at a cerebellar synapse. Soc Neurosci Abstr. 1997;23:467.11. [Google Scholar]
- 3.Barbour B, Keller BU, Llano I, Marty A. Prolonged presence of glutamate during excitatory synaptic transmission to cerebellar Purkinje cells. Neuron. 1994;12:1331–1343. doi: 10.1016/0896-6273(94)90448-0. [DOI] [PubMed] [Google Scholar]
- 4.Barrett EF, Stevens CF. The kinetics of transmitter release at the frog neuromuscular junction. J Physiol (Lond) 1972;227:691–708. doi: 10.1113/jphysiol.1972.sp010054. [DOI] [PMC free article] [PubMed] [Google Scholar]
- 5.Bertram R, Sherman A, Stanley EF. Single-domain/bound calcium hypothesis of transmitter release and facilitation. J Neurophysiol. 1996;75:1919–1931. doi: 10.1152/jn.1996.75.5.1919. [DOI] [PubMed] [Google Scholar]
- 6.Broadie K, Prokop A, Bellen HJ, O’Kane CJ, Schulze KL, Sweeney ST. Syntaxin and synaptobrevin function downstream of vesicle docking in Drosophila. Neuron. 1995;15:663–673. doi: 10.1016/0896-6273(95)90154-x. [DOI] [PubMed] [Google Scholar]
- 7.Chen C, Regehr WG. The mechanism of cAMP-mediated enhancement at a cerebellar synapse. J Neurosci. 1997;17:8687–8694. doi: 10.1523/JNEUROSCI.17-22-08687.1997. [DOI] [PMC free article] [PubMed] [Google Scholar]
- 8.Cohen IS, Van der Kloot W. Facilitation and delayed release at single frog neuromuscular junctions. J Neurosci. 1986;6:2366–2370. doi: 10.1523/JNEUROSCI.06-08-02366.1986. [DOI] [PMC free article] [PubMed] [Google Scholar]
- 9.Connor JA, Nikolakopoulou G. Calcium diffusion and buffering in nerve cytoplasm. Lect Math Life Sci. 1982;15:79–101. [Google Scholar]
- 10.Cummings DD, Wilcox KS, Dichter MA. Calcium-dependent paired-pulse facilitation of miniature EPSC frequency accompanies depression of EPSCs at hippocampal synapses in culture. J Neurosci. 1996;16:5312–5323. doi: 10.1523/JNEUROSCI.16-17-05312.1996. [DOI] [PMC free article] [PubMed] [Google Scholar]
- 11.Deitcher DL, Ueda A, Stewart BA, Burgess RW, Kidokoro Y, Schwarz TL. Distinct requirements for evoked and spontaneous release of neurotransmitter are revealed by mutations in the Drosophila gene neuronal-synaptobrevin. J Neurosci. 1998;18:2028–2039. doi: 10.1523/JNEUROSCI.18-06-02028.1998. [DOI] [PMC free article] [PubMed] [Google Scholar]
- 12.Delaney KR, Tank DW. A quantitative measurement of the dependence of short-term synaptic enhancement on presynaptic residual calcium. J Neurosci. 1994;14:5885–5902. doi: 10.1523/JNEUROSCI.14-10-05885.1994. [DOI] [PMC free article] [PubMed] [Google Scholar]
- 13.Diamond JS, Jahr CE. Asynchronous release of synaptic vesicles determines the time course of the AMPA receptor-mediated EPSC. Neuron. 1995;15:1097–1107. doi: 10.1016/0896-6273(95)90098-5. [DOI] [PubMed] [Google Scholar]
- 14.Feller MB, Delaney KR, Tank DW. Presynaptic calcium dynamics at the frog retinotectal synapse. J Neurophysiol. 1996;76:381–400. doi: 10.1152/jn.1996.76.1.381. [DOI] [PubMed] [Google Scholar]
- 15.Fogelson AL, Zucker RS. Presynaptic calcium diffusion from various arrays of single channels. Implications for transmitter release and synaptic facilitation. Biophys J. 1985;48:1003–1017. doi: 10.1016/S0006-3495(85)83863-7. [DOI] [PMC free article] [PubMed] [Google Scholar]
- 16.Geppert M, Goda Y, Hammer RE, Li C, Rosahl TW, Stevens CF, Sudhof TC. Synaptotagmin I: a major Ca2+ sensor for transmitter release at a central synapse. Cell. 1994;79:717–727. doi: 10.1016/0092-8674(94)90556-8. [DOI] [PubMed] [Google Scholar]
- 17.Goda Y, Stevens CF. Two components of transmitter release at a central synapse. Proc Natl Acad Sci USA. 1994;91:12942–12946. doi: 10.1073/pnas.91.26.12942. [DOI] [PMC free article] [PubMed] [Google Scholar]
- 18.Herrington J, Bookman RJ. Pulse control V4.5: IGOR XOPs for patch clamp data acquisition. University of Miami; Miami, FL: 1995. [Google Scholar]
- 19.Isaacson JS, Walmsley B. Counting quanta: direct measurements of transmitter release at a central synapse. Neuron. 1995;15:875–884. doi: 10.1016/0896-6273(95)90178-7. [DOI] [PubMed] [Google Scholar]
- 20.Kamiya H, Zucker RS. Residual Ca2+ and short-term synaptic plasticity. Nature. 1994;371:603–606. doi: 10.1038/371603a0. [DOI] [PubMed] [Google Scholar]
- 21.Katz B, Miledi R. The measurement of synaptic delay, and the time course of acetylcholine release at the neuromuscular junction. Proc R Soc Lond [Biol] 1964;161:483–495. doi: 10.1098/rspb.1965.0016. [DOI] [PubMed] [Google Scholar]
- 22.Lisman JE. Bursts as a unit of neural information: making unreliable synapses reliable. Trends Neurosci. 1997;20:38–43. doi: 10.1016/S0166-2236(96)10070-9. [DOI] [PubMed] [Google Scholar]
- 23.Livingstone MS, Freeman DC, Hubel DH. Visual responses in V1 of freely viewing monkeys. Cold Spring Harb Symp Quant Biol. 1996;61:27–37. [PubMed] [Google Scholar]
- 24.Llano I, Marty A, Armstrong CM, Konnerth A. Synaptic- and agonist-induced excitatory currents of Purkinje cells in rat cerebellar slices. J Physiol (Lond) 1991;434:183–213. doi: 10.1113/jphysiol.1991.sp018465. [DOI] [PMC free article] [PubMed] [Google Scholar]
- 25.Miledi R. Strontium as a substitute for calcium in the process of transmitter release at the neuromuscular junction. Nature. 1966;212:1233–1234. doi: 10.1038/2121233a0. [DOI] [PubMed] [Google Scholar]
- 26.Mintz IM, Sabatini BL, Regehr WG. Calcium control of transmitter release at a central synapse. Neuron. 1995;15:675–688. doi: 10.1016/0896-6273(95)90155-8. [DOI] [PubMed] [Google Scholar]
- 27.Palay SL, Chan-Palay V. Cerebellar cortex. Springer; New York: 1974. [Google Scholar]
- 28.Rahamimoff R, Yaari Y. Delayed release of transmitter at the frog neuromuscular junction. J Physiol (Lond) 1973;228:241–257. doi: 10.1113/jphysiol.1973.sp010084. [DOI] [PMC free article] [PubMed] [Google Scholar]
- 29.Ravin R, Spira ME, Parnas H, Parnas I. Simultaneous measurement of intracellular Ca2+ and asynchronous transmitter release from the same crayfish bouton. J Physiol (Lond) 1997;501:251–262. doi: 10.1111/j.1469-7793.1997.tb00001.x. [DOI] [PMC free article] [PubMed] [Google Scholar]
- 30.Regehr WG, Atluri PP. Calcium transients in cerebellar granule cell presynaptic terminals. Biophys J. 1995;68:2156–2170. doi: 10.1016/S0006-3495(95)80398-X. [DOI] [PMC free article] [PubMed] [Google Scholar]
- 31.Regehr WG, Tank DW. Selective fura-2 loading of presynaptic terminals and nerve cell processes by local perfusion in mammalian brain slice. J Neurosci Methods. 1991;37:111–119. doi: 10.1016/0165-0270(91)90121-f. [DOI] [PubMed] [Google Scholar]
- 32.Regehr WG, Delaney KR, Tank DW. The role of presynaptic calcium in short-term enhancement at the hippocampal mossy fiber synapse. J Neurosci. 1994;14:523–537. doi: 10.1523/JNEUROSCI.14-02-00523.1994. [DOI] [PMC free article] [PubMed] [Google Scholar]
- 33.Roberts WM. Spatial calcium buffering in saccular hair cells. Nature. 1993;363:74–76. doi: 10.1038/363074a0. [DOI] [PubMed] [Google Scholar]
- 34.Roberts WM. Localization of calcium signals by a mobile calcium buffer in frog saccular hair cells. J Neurosci. 1994;14:3246–3262. doi: 10.1523/JNEUROSCI.14-05-03246.1994. [DOI] [PMC free article] [PubMed] [Google Scholar]
- 35.Sabatini BL, Regehr WG. Timing of neurotransmission at fast synapses in the mammalian brain. Nature. 1996;384:170–172. doi: 10.1038/384170a0. [DOI] [PubMed] [Google Scholar]
- 36.Sabatini BL, Regehr WG. Optical measurement of presynaptic calcium currents. Biophys J. 1998;74:1549–1563. doi: 10.1016/S0006-3495(98)77867-1. [DOI] [PMC free article] [PubMed] [Google Scholar]
- 37.Sala F, Hernandez-Cruz A. Calcium diffusion modeling in a spherical neuron. Biophys J. 1990;57:313–324. doi: 10.1016/S0006-3495(90)82533-9. [DOI] [PMC free article] [PubMed] [Google Scholar]
- 38.Simon SM, Llinás RR. Compartmentalization of the submembrane calcium activity during calcium influx and its significance in transmitter release. Biophys J. 1985;48:485–498. doi: 10.1016/S0006-3495(85)83804-2. [DOI] [PMC free article] [PubMed] [Google Scholar]
- 39.Stanley EF. Decline in calcium cooperativity as the basis of facilitation at the squid giant synapse. J Neurosci. 1986;6:782–789. doi: 10.1523/JNEUROSCI.06-03-00782.1986. [DOI] [PMC free article] [PubMed] [Google Scholar]
- 40.Tank DW, Regehr WG, Delaney RK. A quantitative analysis of presynaptic calcium dynamics that contribute to short-term enhancement. J Neurosci. 1995;15:7940–7952. doi: 10.1523/JNEUROSCI.15-12-07940.1995. [DOI] [PMC free article] [PubMed] [Google Scholar]
- 41.Van Der Kloot W, Molgo J. Facilitation and delayed release at about 0°C at the frog neuromuscular junction: effects of calcium chelators, calcium transport inhibitors, and okadaic acid. J Neurophysiol. 1993;69:717–729. doi: 10.1152/jn.1993.69.3.717. [DOI] [PubMed] [Google Scholar]
- 42.Van der Kloot W, Molgo J. Quantal acetylcholine release at the vertebrate neuromuscular junction. Physiol Rev. 1994;74:899–991. doi: 10.1152/physrev.1994.74.4.899. [DOI] [PubMed] [Google Scholar]
- 43.Wu MN, Bellen HJ. Genetic dissection of synaptic transmission in Drosophila. Curr Opin Neurobiol. 1997;7:624–630. doi: 10.1016/s0959-4388(97)80081-5. [DOI] [PubMed] [Google Scholar]
- 44.Yamada WM, Zucker RS. Time course of transmitter release calculated from simulations of a calcium diffusion model. Biophys J. 1992;61:671–682. doi: 10.1016/S0006-3495(92)81872-6. [DOI] [PMC free article] [PubMed] [Google Scholar]
- 45.Zengel JE, Magleby KL. Differential effects of Ba2+, Sr2+, and Ca2+ on stimulation-induced changes in transmitter release at the frog neuromuscular junction. J Gen Physiol. 1980;76:175–211. doi: 10.1085/jgp.76.2.175. [DOI] [PMC free article] [PubMed] [Google Scholar]
- 46.Zengel JE, Magleby KL. Changes in miniature endplate potential frequency during repetitive nerve stimulation in the presence of Ca2+, Ba2+, and Sr2+ at the frog neuromuscular junction. J Gen Physiol. 1981;77:503–529. doi: 10.1085/jgp.77.5.503. [DOI] [PMC free article] [PubMed] [Google Scholar]
- 47.Zhao M, Hollingworth S, Baylor SM. Properties of tri- and tetracarboxylate Ca2+ indicators in frog skeletal muscle fibers. Biophys J. 1996;70:896–916. doi: 10.1016/S0006-3495(96)79633-9. [DOI] [PMC free article] [PubMed] [Google Scholar]
- 48.Zucker RS. Exocytosis: a molecular and physiological perspective. Neuron. 1996;17:1049–1055. doi: 10.1016/s0896-6273(00)80238-x. [DOI] [PubMed] [Google Scholar]
- 49.Zucker RS, Lara-Estrella LO. Post-tetanic decay of evoked and spontaneous transmitter release and a residual-calcium model of synaptic facilitation at crayfish neuromuscular junctions. J Gen Physiol. 1983;81:355–372. doi: 10.1085/jgp.81.3.355. [DOI] [PMC free article] [PubMed] [Google Scholar]


