Abstract
Genetic studies associate Parkinson’s disease with alleles of the major histocompatibility complex1–3. We find that a defined set of peptides derived from α-synuclein, a protein aggregated in Parkinson’s disease4, act as antigenic epitopes displayed by these alleles and drive helper and cytotoxic T cell responses in Parkinson’s disease patients. These responses may explain the association of Parkinson’s disease with alleles of the acquired immune system.
Abnormal processing of self-proteins can produce epitopes presented by major histocompatibility complex (MHC) proteins to be recognized by specific T cells that escaped tolerance during thymic selection 5. Such actions by the acquired immune system are implicated in autoimmune disorders including Type-1 diabetes (T1D). While not considered to possess autoimmune features, neurodegenerative diseases are characterized by altered protein processing. The major pathological features of Parkinson’s disease (PD), the most common neurodegenerative movement disorder, are the death of substantia nigra (SN) dopaminergic neurons, and the presence of intraneuronal aggregates known as Lewy bodies composed of α-synuclein (α-syn) 4. Activated microglia have been reported in PD SN for nearly a century 6 and cytokine profiles implicate activation of the innate immune system 7. More recent evidence suggests a role for the acquired immune system 7, including T cell infiltration to PD SN 8. Genome wide association studies associate PD with an immune haplotype 9 present in ~15% of the general population including the MHC class II gene alleles DRB5*01 and DRB1*15:01 1, and a polymorphism in a non-coding region that may increase MHC class II expression 2,3. We reported antigen presentation by MHC class I expression in SN dopamine neurons in adult human brain of PD patients and age matched controls. We further demonstrated that SN dopamine neurons express MHC class I upon activation by cytokines released from microglia activated by α-syn or neuromelanin, and that CD8+ T cells kill neurons that present the appropriate combination of MHC class I and peptide 10. Native 11,12 and modified (nitrated) synuclein-derived peptides 13 elicit T cell responses in rats and mice, and Standaert and coworkers recently demonstrated that SN neuronal death in a α-syn overexpression model is absent in MHC II null mice 14.
To address if PD is associated with T cell recognition of epitopes derived from α-syn presented by specific MHC alleles, we recruited 67 PD participants and 36 age-matched non-PD healthy controls (HC). Participants were 46–83 years of age (PD, median 66, range 46–83; HC, median 64, range 52–83) and 66% were male (PD 75%; HC 50%) (Supplemental Tables 1,2). While ~15% of HC carried DRB1*15:01/DRB5*01:01 alleles, ~1/3 of PD carried these alleles (difference between PD and HC, p=0.036 and 0.022 for DRB1*15:01/DRB5*01:01), indicating association of HLA DR allelic variants with PD in our cohort (Supplemental Table 3).
To determine whether α-syn derived peptides were recognized by T cells, we assayed responses to pools that each contained ~twenty 9–10aa peptides predicted to bind common HLA class I types 15, and 15aa peptides spanning the protein that could elicit HLA class II responses. PBMCs from PD and HC were stimulated for 14 days, and IFNγ and IL-5 responses were measured by dual color ELISPOT, enabling quantification of responsive cells. Positive pools were deconvoluted to identify the peptides eliciting cytokine responses. IFNγ was used as a representative cytokine to detect CD8+/HLA class I and CD4+ Th1/Class II T cells, and IL-5 as a representative cytokine secreted by CD4+ Th2/Class II T cells. Each pool was tested in an initial cohort in 19–25 randomly selected PD and 12 HC. The majority of PBMC responses to the 15aa peptides produced IL-5 (68% of total), indicating a prominent CD4+ Th2 phenotype, and the remainder of the responses were to IFNγ (32%). No cells producing both IL-5 and IFNγ were detected.
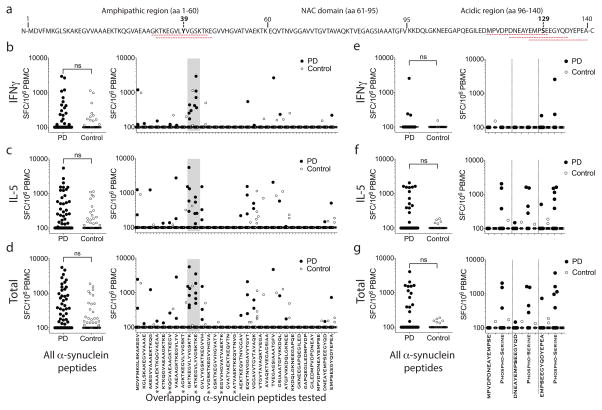
We identified two antigenic regions in α-syn, the first near the N terminus, composed of aa31GKTKEGVLYVGSKTK aa45 and aa32KTKEGVLYVGSKTKE aa46 (referred to as the Y39 region) (Fig 1a), which elicited an apparent Class II restricted IL-5 and IFNγ response (Fig 1b–d). Residue aa32 is a plasmin cleavage site 16 and chymotrypsin cleavage sites are at aa31/32 and aa45/46 17.
Figure 1. α-Syn autoimmune responses are directed against two regions.
a Sequence of α-syn. Antigenic regions are highlighted with dashed red lines with amino acids Y39 and S129 in bold. (b–d) Magnitude of responses expressed as (SFC/106 PBMC) per peptide/participant combination. Left panels; response to all overlapping native α-syn 15mer peptides in PD (n=733) and Control (n=372). Right panels indicate responses against specific 15mers. Grey shading indicates antigenic region containing Y39. (e–g). Magnitude of responses. Left panels; responses to all native and phosphorylated S129 α-syn 15mer peptides in PD (n=150) and Control (n=72). Right panels; responses against specific S129 peptides. Closed circles, PD (n=19, indicated by *, all other n=25); open circles, Control (n=12 participants). Two-tailed Mann Whitney, ns, not significant. (b,e) IFNγ, (c,f) IL-5, (d,g) total (IFNγ & IL-5) response. As many participants showed no response, many points are at the limit of resolution (100 SFC).
The second antigenic region was near the C terminus (aa116–140) (referred to as the S129 region) (Fig 1a), and required phosphorylation of amino acid residue S129. The three phosphorylated aaS129 epitopes (aa116MPVDPDNEAYEMPSEaa130, aa121DNEAYEMPSEEGYQDaa135, aa126EMPSEEGYQDYEPEAaa140) produced markedly higher IL-5 responses in PD than HC (p=0.02, Fisher’s exact test, 300 SFC threshold) (Fig 1e–g). Phosphorylated aaS129 residues are present at high levels in PD Lewy bodies 18, and PD Lewy bodies contain α-syn fragments with cleavage sites at approximately aa115, 119, 133, and 135 19, and include the fragment aa129SEEGYQDYEPEAaa140, which is contained within one of the aaS129 epitopes. Caspase-1 20 and neurosyn 21 can cleave α-syn at aa121, chymotrypsin and cathepsin can cleave at aa116, aa125/126, and aa135/136 17, proteasome may cleave at aa119/120 22, and calpain can cleave at aa122, with resulting fragments identified in PD brain 23.
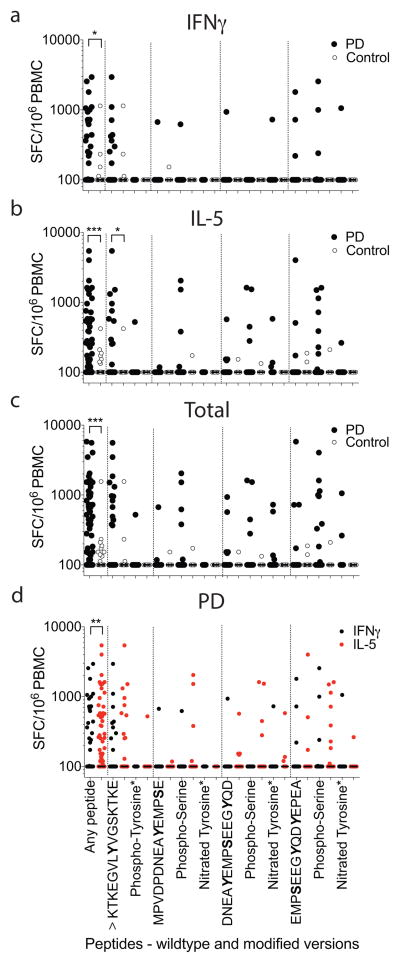
The immune responses to aa39 and aa129 region epitopes, including a second cohort of 19 PD and 12 HC assayed for response to additional phosphorylated and nitrated modifications (Extended Data Fig 1), were different between PD and HC for secretion of both IFNγ (two-tailed Mann-Whitney test, p<0.05) and IL-5 (two-tailed Mann-Whitney test, p<0.001), and combined responses (two-tailed Mann-Whitney test, p<0.001) (Fig. 2a–c). While residue aa39 is highly phosphorylated in PD patients 24, Y39 phosphorylation was not required for antigenic response. The response was primarily polarized towards IL-5 in PD (71% IL-5 and 29% IFNγ; Fig. 2d). This polarization was PD specific, and the relatively rare HC responses were not similarly polarized (46% IL-5 and 54% IFNγ ).
Figure 2. Reactivity to native and modified α-syn peptides in PD patients.
(a–c) Magnitude of responses against native and modified α-syn 15mer S129 and Y39 region peptides as (SFC/106 PBMC). Each point represents a peptide/participant combination. Closed circles, PD (n=403 peptide/participant combinations “any peptide”, KTKEGVLYVGSKTKE n=63 participants (^), modified peptides marked with * are tested in 19 participants, unmodified peptides are tested in n=41); open circles, control (n=228 any peptide, ^ n=36, *n=12 and unmodified peptides n=24)a, IFNγ, b, IL-5, c, total (IFNγ & IL-5 combined) responses. d, Combined IL-5 and IFNγ responses against individual native and modified α-syn peptides by PD. Black points, IFNγ responses; red points, IL-5 responses. Two-tailed Mann Whitney, *, p<0.05, **, p<0.01, ***, p<0.001. As many participants showed no response, many points are at the limit of resolution (100 SFC).
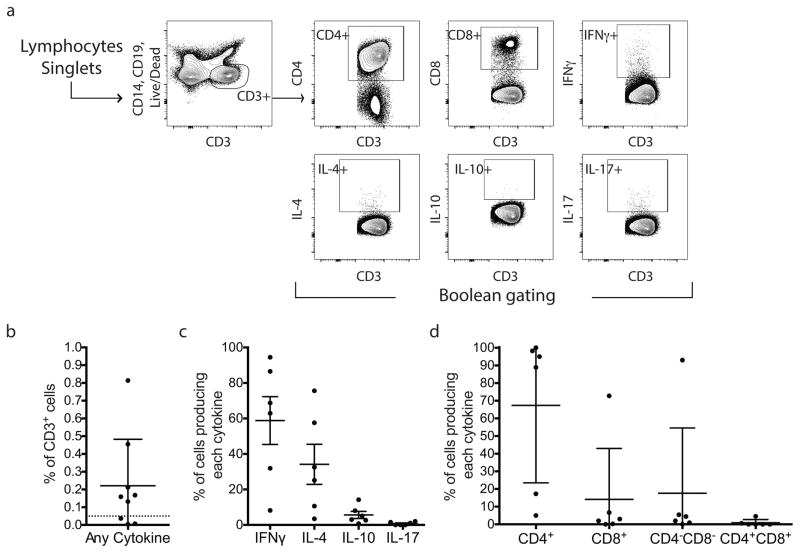
To identify specific sets of T cells that respond to α-syn epitopes, we measured response to a pool of the 11 α-syn antigenic peptides by 9 PD participants (Extended Data Fig. 2). Approximately 0.2% of CD3+ T cells responded to the α-syn peptides. Of the responsive T cells, ~50% produced IL-4 and 50% produced IFNγ, with no detectable IL-10 or IL-17 production. In most cases, responses were mediated by CD4+ T cells, but response by one PD was mostly mediated by IFNγ-producing CD8+ T cells. Thus, T cell response to α-syn antigenic peptides was largely mediated by IL-4 or IFNγ-producing CD4+ T cells, with potential contributions from CD8+/IFNγ producing T cells.
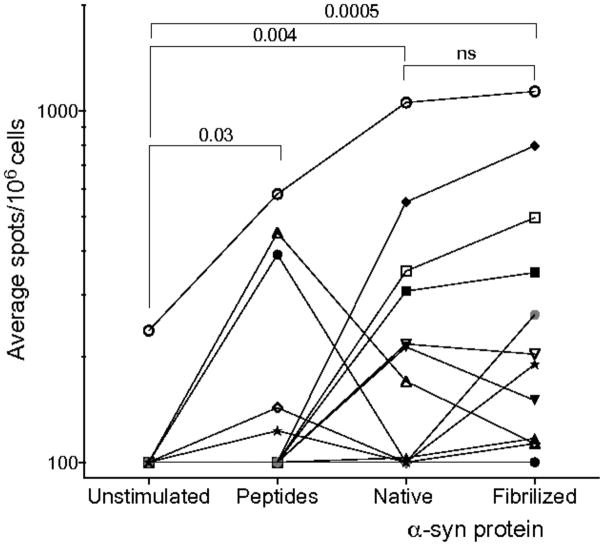
To test if the α-syn epitopes arise from processing of native and/or fibrilized α-syn, PBMCs were stimulated with α-syn epitopes for 14 days. The cultures were then assayed with α-syn peptides, 25 μg/ml fibrilized (PFF) α-syn, 25μg/ml native α-syn, or media alone. Extended Data Fig. 3 shows that T cells lines specific for the α-syn epitopes were activated by antigen presenting cells pulsed with native or PFF protein in 7/12 and 11/12 cases. There was significantly higher response to native α-syn (p=0.004) and PFF α-syn (p=0.0005) than media alone. Thus, T cells can respond to α-syn epitopes arising from natural processing of extracellular native α-syn, which is present in blood, and the fibrilized α-syn associated with PD.
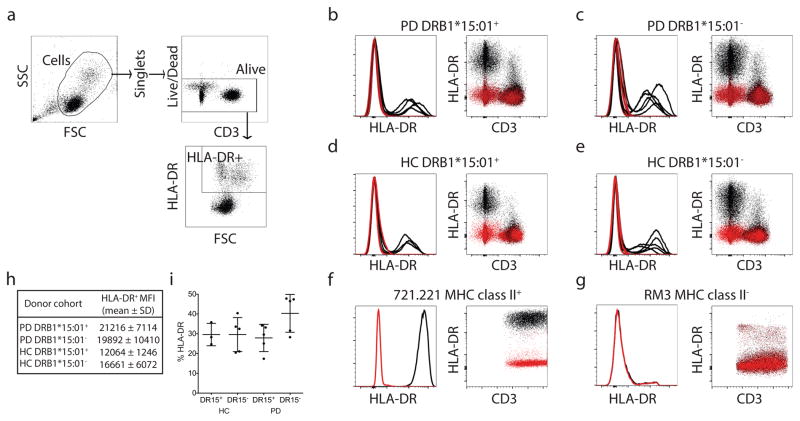
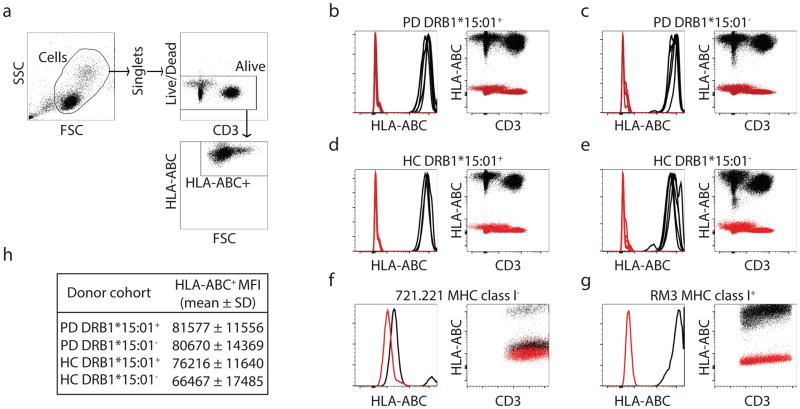
We then identified the HLA alleles that present α-syn peptides by in vitro binding to a panel of HLAs representing the common alleles expressed in worldwide populations 1. A threshold of 1,000 nM binding affinity is associated with immunogenicity of HLA class II T cell epitopes, and most epitopes bind in the 1–100 nm range, with affinities in the 1–10 nM considered to be of high affinity. Of 26 common HLA class II alleles tested, five bound to aa32KTKEGVLYVGSKTKEaa46 (Supplemental Table 4). The HLA class II variants DRB1*15:01 and DRB5*01:01 bound the epitope with high affinity (2.8 nM and 8.1 nM, respectively), while DRB1*07:01, B1*09:01 and DQB1*03:01 bound in the 80–250 nM range. The aa32KTKEGVLYVGSKTKEaa46 epitope phosphorylated at Y39 also bound DRB1*15:01 and DRB5*01:01 with high affinity. Comparison of PD with and without DRB1*15:01 alleles found no difference in levels of HLA class I or class II protein expression (Extended Data Fig. 4 & 5). Thus, epitopes in the Y39 region of α-syn strongly bind two HLA class II β chain alleles associated with PD.
In contrast, the C terminus peptides spanning S129 and its post-translational forms bound HLA class II alleles weakly, with the exception of aa121DNEAYEMPSEEGYQDaa135, which in both native and phosphorylated S129 forms strongly bound DQB1*05:01. The aa116MPVDPDNEAYEMPSEaa130 epitope bound several alleles with lower affinity, and the aa126EMPSEEGYQDYEPEAaa140 epitope bound DQB1*04:02 and DQB1*05:01 with low affinity. Thus, antigenic peptides in the C terminus S129 antigenic region demonstrated relatively little clear restriction, suggesting that they are recognized promiscuously.
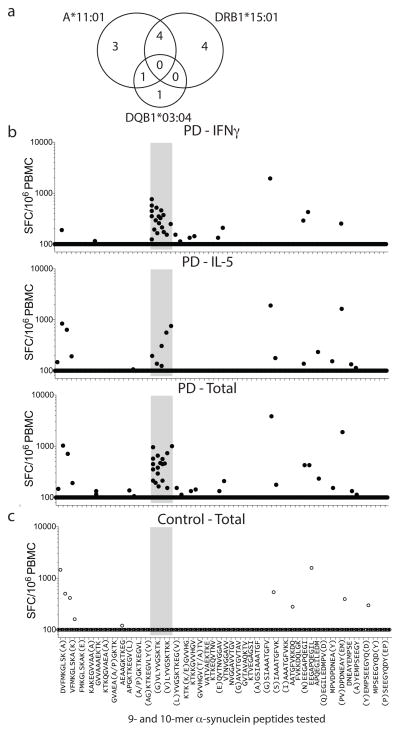
DRB1*15:01 and DRB5*01:01 alleles are in linkage disequilibrium, and participants expressing one allele likely express both. Of PD participants, 8/13 responders to the aa32KTKEGVLYVGSKTKEaa46 epitope expressed both DRB1*15:01 and DRB5*01:01, while only 12/45 (DRB1*15:01) and 13/43 (DRB5*01:01) non-responders expressed the alleles, indicating association between the alleles and antigenic response (odd ratios of 4.4 and 3.7, p values of 0.04 and 0.05, respectively) (Table 1). This analysis detected additional associations, with 2/13 responders expressing DQB1*03:04 (p=0.05) compared to 0/45 non-responders, as well as the HLA class I allele A*11:01, with 8/13 responders expressing A*11:01 compared to 9/45 non-responders (p=0.012). While A*11:01 is in relatively mild linkage disequilibrium with DRB1*15:01 and DRB1*01:01, the associations were largely independent (Fig 3a). In general, PD participants showed a trend towards higher expression of HLA molecules, particularly HLA class II. This is consistent with an inflammatory component of PD, and higher HLA class II expression and induction in PBMCs of PD vs. HC3. Little or no difference in HLA class II expression was found between participants expressing DRB1*15:01 vs. other DRB1 alleles (Extended Data Fig. 4). A similar but still less pronounced trend was noted for HLA class I (Extended Data Fig. 5). This suggests that the association between DRB1*15:01 and PD is not based on differential expression of the protein. We detected negative association between recognition of aa32KTKEGVLYVGSKTKEaa46 and the DRB3*02:02 allele, suggesting this allele might be protective. The four alleles DRB1*15:01, DRB5*01:01, DQB1*03:04 and A*11:01 accounted for every single individual responding to the aa39 epitope (p=0.00007 for PD, Table 1). This association was far more significant in PD than HC (p=0.009). The combined association for the four alleles for PD vs. HC was significant (p=0.008 two-tailed Fisher’s exact test compared to individual DRB1*15:01, p=0.05, and DRB5*01:01, p=0.03), with ~ half of the PD (31 with alleles and 27 without) carrying one of the four alleles, whereas only ~20% of the HC (8 with alleles and 26 without) expressed one of the four (Table 1).
Table 1.
HLA association of Y39 responses
| HLA Allele | Individuals with allele | Individuals lacking allele | Rel. freq. | Odds ratio | p-value | |||
|---|---|---|---|---|---|---|---|---|
| Pos. epitope response | Neg. epitope response | Pos. epitope response | Neg. epitope response | |||||
| PD | DRB1*15:01 | 8 | 12 | 5 | 33 | 1.8 | 4.4 | 0.04 |
| DQB1*03:04 | 2 | 0 | 11 | 45 | 4.5 | inf. | 0.05 | |
| DRB5*01:01 | 8 | 13 | 5 | 30 | 1.6 | 3.7 | 0.05 | |
| DRB3*02:02 | 1 | 19 | 12 | 24 | 0.2 | 0.1 | 0.021 | |
| A*11:01 | 8 | 9 | 5 | 36 | 2.1 | 6.4 | 0.012 | |
| DRB1*15:01/DQB1*03:04/DRB5*01:01/A*11:01 | 13 | 18 | 0 | 27 | 1.9 | inf. | 0.00007 | |
| HC | DRB1*15:01/DQB1*03:04/DRB5*01:01/A*11:01 | 3 | 5 | 0 | 26 | 4.3 | inf. | 0.009 |
Figure 3. HLA association of Y39 epitope and identification of A*11:01 restricted 9–10aa length Y39 epitopes.
a, Overlapping but largely independent associations between DRB1*15:01, DQB1*03:04 and A*11:01 for PD (13 participants) responding to the Y39 epitope. (b,c) Magnitude of responses by b, PD (n=19) and c, control participants (n=12), as (SFC/106 PBMC) of response per peptide/participant combination to α-syn 9–10mer peptides spanning the protein. In some cases, response to overlapping peptides are combined, with additional residues of the longer peptide in parentheses. b, top panel, IFNγ; middle, IL-5; bottom, total (IFNγ & IL-5 combined) response. c, Total (IFNγ & IL-5 combined). As many participants showed no T cell response, many points are at the limit of resolution (100 SFC).
Following detection of association of response to the Y39 region with the MHC class I allele HLA A*11:01, we evaluated PD responses to shorter α-syn derived peptide candidates for class I presentation. We found that 5/19 PD responded to these short peptides while 0/12 HC responded (Fig. 3b,c) (two-tailed Chi square=3.765, 1df, p=0.0523). Reactivity occurred mostly on peptides contained within the Y39 region, involving three peptides (aa36GVLYVGSKTKaa45, aa37VLYVGSKTKaa45, aa37VLYVGSKTKKaa46) predicted as potential A*11:01 binders 15. We tested each peptide for binding to purified HLA A*11:01 molecules in vitro, and found that the 9mer aa37VLYVGSKTKaa45, which is nested within the two 10mers, bound with good affinity (IC50 = 161 nM), while the other two bound poorly, indicating that the 9mer is responsible for T cell recognition. Reactivity to short peptides was mostly mediated by IFNγ producing cells and most pronounced for the A11 binding peptides. Thus, immune responses to α-syn associated with PD have both MHC class I and II restricted components.
Alleles of over twenty genes are associated with familial PD25, many of which encode proteins implicated in lysosomal degradation pathways including mitochondrial turnover. For example, mutations in α-syn or dopamine-modified α-syn 26,27, and LRRK228 interfere with protein degradation by chaperone-mediated autophagy, a process that becomes less efficient with age. Extracellular oligomeric α-syn may be acquired by brain cells during PD pathogenesis 29. These reports suggest that altered degradation of proteins including α-syn could produce antigenic epitopes that trigger immune reactions during aging and PD.
Our results indicate that peptides derived from two regions of α-syn produce immune response in PD patients; their roles in additional synucleinopathies are untested. Epitopes derived from the Y39 region (~aa31/32 to 45/46) are specifically displayed by two MHC class II beta chain alleles, DRB5*01:01 and DRB1*15:01, associated with PD, as well as an additional MHC class II allele and an MHC class I allele not previously associated with PD. This response is enacted mostly by IL-5 secreting CD4+ T cells, as well as IFNγ CD8+ cytotoxic T cells. α-Syn is not to our knowledge endogenously expressed by cells that express MHC class II, but is in CSF 30, from where it can be acquired by MHC class II expressing cells. This situation is analogous to the experimental autoimmune encephalitis model of multiple sclerosis, as myelin proteins used to produce autoimmunity are not endogenous to MHC class II expressing cells, but are accumulated and processed for MHC class II display by antigen presenting cells and microglia. The Y39 antigenic region is strikingly close to the α-syn mutations that cause PD (A30P, E46K, H50Q, G51D, A53T) 25. The second antigenic region encompasses S129 and requires S129 phosphorylation, a form present in Lewy bodies 18: antigenic epitopes from that region are not strongly restricted and can drive immune responses in PD patients who do not express HLA alleles that recognize the Y39 region.
Approximately 40% of the PD participants in our cohort exhibited immune responses to α-syn epitopes, and these responses may reflect variations in disease progression or environmental factors. The fraction of patients who display such responses in classic autoimmune disorders such as T1D, rheumatoid arthritis and multiple sclerosis is often ~20–50% 31,32. As with T1D, which features epitopes derived from both preproinsulin and additional proteins, it may be that PD-related epitopes are derived from α-syn and additional proteins. In classic autoimmune disorders, MHC class II response may precede MHC class I 5, and we note that exposing microglia to α-syn triggers MHC class I expression by dopamine neurons 10. The PD-associated proteins parkin and PINK1 may regulate antigenic presentation of mitochondrial peptides 33, and it is possible that an autoimmune presentation of antigenic epitopes unites lysosomal and mitochondrial mechanisms of PD pathogenesis.
MATERIALS AND METHODS
Study subjects
All participants provided written informed consent for participation in the study. Ethical approval was obtained from the LJI and Columbia University institutional review boards.
We recruited 67 participants with PD and 36 age-matched healthy controls (HCs) from the greater San Diego (PD, n=9; HC, n=13) and New York City (PD, n=58; HC, n=23) areas. The New York cohort was recruited from the Center for Parkinson’s Disease at Columbia University Medical Center through the Spot study 34. PD was defined based on the United Kingdom Parkinson’s Disease Brain Bank criteria, without excluding cases with a family history of PD 35. We collected demographics and disease characteristics including age, age of onset, sex, medications, comorbidities and motor disease severity as measured by the Unified Parkinson’s Disease Rating Scale (UPDRS) motor score (UPDRS-III). We also collected family history of PD in first-degree relatives. The data are reported in Supplementary Tables 1a & b. In the San Diego cohort, we collected demographic data and PD was self-reported. Samples used for additional assays in Fig. 3 and Extended Data Fig. 3 were collected from consecutive individuals based on the schedule of their appointment: the demographics and PD characteristics of these participants are displayed in Supplemental Tables 2 and 3. HCs were recruited through a convenience sample of consecutive non-blood related individuals, and were mostly spouses of PD participants. At Columbia University, PD and HC were recruited only if there was no history of immune modulatory medications (e.g., steroids) or overt autoimmune disorder (e.g., lupus). No significant difference was detected in response rates as a function of sex or geographical location. Three participants with PD had a history of Crohn’s disease and one patient had a history of Hashimoto’s thyroiditis. Two of the three participants with Crohn’s disease showed antigenic response to α-syn and the participant with Hashimoto’s thyroiditis did not. Experimental blinding was accomplished by labeling the blood samples in a coded fashion without information on age/gender or PD status. The cohort was predominantly Caucasian (88.3%) and no firm conclusions between Crohn’s disease and PD could be drawn because of the limited number of Crohn’s disease patients studied.
Peptides
Peptides were synthesized as crude material on a small (1 mg) scale by A and A (San Diego, CA). Peptides were 40 15mers overlapping by 10–14 residues and 70 9- or 10mers predicted to bind common HLA-class I alleles. Briefly, each possible 9- and 10mer from α-syn were scored for their capacity to bind a panel of 27 common HLA class I A and B molecules 36. For each allele 4 peptides were synthesized (two 9mers and two 10mers, n=61 after removing redundant sequences that were selected for 2 or more alleles). In addition, any peptide that scored at the 2 percentile level or better for predicted binding, but were not within the 4 selected per allele were synthesized (n=9). Post-translationally modified peptides (n=7) were synthesized as purified material (>95% by reversed phase HPLC) by A and A (San Diego). Peptides were combined into pools of 14 peptides (range 11–16).
An alternative mode of stimulation would be to use whole α-syn, but we opted for synthetic peptides due to their well-characterized and uniform chemical species, in contrast to α-syn preparations that contain varying amounts of different post-translational modifications, and as it is unclear which form(s) are processed by APCs during PD. In addition to a lower cost, synthetic peptides better provide mapping of specific epitopes and measurement of HLA binding.
PBMC isolation and culture
Venous blood was collected in heparin-containing blood bags or tubes. Peripheral blood mononuclear cells (PBMC) were purified from whole blood by density-gradient centrifugation, according to the manufacturer’s instructions. Cells were cryopreserved in liquid nitrogen suspended in FBS containing 10% (vol/vol) DMSO. Culturing of PBMCs for in vitro expansion was performed by incubating in RPMI (Omega Scientific) supplemented with 5% human AB serum (Gemini Bioscience), GlutaMAX (Gibco), and penicillin/streptomycin (Omega Scientific) at 2 × 10⁶ per mL in the presence of individual peptide pools at 5 μg/ml. Every 3 days, 10U/ml IL-2 in media were added to the cultures.
ELISPOT assays
After 14 days of culture with individual peptide pools (5μg/ml), the response to pools and individual peptides (5μg/ml) was measured by IFNγ and IL-5 dual ELISPOT 37. ELISPOT antibodies, mouse anti-human IFNγ (clone 1-D1K), mouse anti-human IL-5 (clone TRFK5), mouse anti-human IFNγ-HRP (clone 7-B6-1), mouse anti-human IL-5 biotinylated (clone 5A10) were all from Mabtech. To be considered positive, a response had to match three criteria: 1) elicit at least 100 spot-forming cells (SFC) per 106 PBMC, 2) p≤0.05 by Student’s t-test or by a Poisson distribution test, 3) stimulation index ≥2.
For the experiments with fibrilized or native α-syn, PBMCs were stimulated with epitopes derived from α-syn for 14 days. These cultures were then stimulated with α-syn peptides, 25 μg/ml fibrilized α-syn or 25μg/ml native α-syn.
HLA typing, restriction, binding predictions and assays
Participants were HLA typed at the La Jolla Institute or by an ASHI-accredited laboratory at Murdoch University (Western Australia). Typing at LJI was performed by next generation sequencing 38. Specifically, amplicons were generated from the appropriate class II locus for exons 2 through 4 by PCR amplification. From these amplicons, sequencing libraries were generated (Illumina Nextera XT) and sequenced with MiSeq Reagent Kit v3 as per manufacturer instructions (Illumina, San Diego, CA). Sequence reads were matched to HLA alleles and participant genotyping assigned. HLA typing in Australia for Class I (HLA A; B; C) and Class II (DQA1; DQB1, DRB1 3,4,5; DPB1) was performed using locus-specific PCR amplification on genomic DNA. Primers used for amplification employed patient-specific barcoded primers. Amplified products were quantitated and pooled by subject and up to 48 subjects were pooled. An unindexed (454 8-lane runs) or indexed (8 indexed MiSeq runs) library was then quantitated using Kappa universal QPCR library quantification kits. Sequencing was performed using either a Roche 454 FLX+ sequencer with titanium chemistry or an Illumina MiSeq using 2 × 300 paired-end chemistry. Reads were quality-filtered and passed through a proprietary allele calling algorithm and analysis pipeline using the latest IMGT HLA allele database as a reference. The algorithm was developed by co-authors EP and SM and relies on periodically updated versions of the freely available international immunogenetics information system (http://www.imgt.org) and an ASHI-accredited HLA allele caller software pipeline, IIID HLA Analysis Suite (http://www.iiid.com.au/laboratory-testing/).
Potential HLA-epitope restrictions were inferred using the RATE program 39. HLA A*11:01 binding predictions were performed using the consensus prediction method publicly available through the IEDB Analysis Resource (available at http://www.iedb.org) 15.
Classical competition assays to quantitatively measure peptide binding affinities for HLA class I and II MHC molecules, based on inhibition of binding of high affinity radiolabeled peptides to purified MHC molecules, were performed as detailed elsewhere 40. Briefly, 0.1–1 nM of radiolabeled peptide was co-incubated at room temperature or 37°C with purified MHC in the presence of a cocktail of protease inhibitors (and, for class I, exogenous human β2-microglobulin). Following a two to four day incubation, MHC bound radioactivity (cpm) was determined by capturing MHC/peptide complexes on Lumitrac 600 plates (Greiner Bio-one, Frickenhausen, Germany) coated with either HLA DR (L243), DQ (HB180), DP (B7/21) or class I (W6/32) specific monoclonal antibodies. Bound cpm was measured using the TopCount microscintillation counter (Packard Instrument Co., Meriden, CT). The concentration of peptide yielding 50% inhibition of binding of the radiolabeled peptide was calculated. Under the conditions utilized, where [label] < [MHC] and IC50 ≥ [MHC], measured IC50 values are reasonable approximations of true Kd 41,42. Each competitor peptide was tested at six different concentrations covering a 100,000-fold range, and in three or more independent experiments. As a positive control, the unlabeled version of the radiolabeled probe was also tested in each experiment. A threshold of 1,000 nM binding affinity is associated with immunogenicity of HLA class II T cell epitopes, and most epitopes bind in the 1–100 nm range, with affinities in the 1–10 nM considered to be of high affinity 43.
Intracellular cytokine staining
After 14 days of culture PBMC were stimulated in the presence of 5μg/ml α-syn peptide pool for 2h in complete RPMI medium at 37°C with 5% CO2. After 2h, 2.5μg/ml each of BFA and monensin was added for an additional 4h at 37°C. Unstimulated PBMCs were used to assess nonspecific/background cytokine production and PHA stimulation at 5μg/ml was used as a positive control. After a total of 6h, cells were harvested and stained for cell surface antigens CD4 (anti-CD4-APCEf780, RPA-T4, eBioscience), CD3 (anti-CD3-AF700, UCHT1, BD Pharmingen), CD8 (anti-CD8-BV650, RPA-T8, BioLegend), CD14 (anti-CD14-V500, M5E2, BD Pharmingen), CD19 (anti-CD19-V500, HIB19, BD Pharmingen), and fixable viability dye eFluor 506 (eBioscience). After washing, cells were fixed using 4% paraformaldehyde and permeabilized using saponin buffer. Cells were stained for IFNγ (anti-IFNγ-APC, 4S.B3, eBioscience), IL-17 (anti-IL-17-PECy7, eBio64DEC17, eBioscience), IL-4 (anti-IL-4-PE/Dazzle594, MP4-25D2, BioLegend), and IL-10 (anti-IL-10-AF488, JES3-9D7, eBioscience) in saponin buffer containing 10% FBS. Samples were acquired on a BD LSR II flow cytometer. Frequencies of CD3+ T cells responding to α-syn peptide pool were quantified by determining the total number of gated CD3+ and cytokine+ cells and background values subtracted (as determined from the medium alone control) using FlowJo X Software (FlowJo, Ashland, OR). Combinations of cytokine producing cells were determined using Boolean gating.
HLA-DR and -ABC expression
PBMCs from DRB1*15:01+ or DRB1*15:01− PD (n=5 for both) and HC (n=3 DRB1*15:01+ and n=5 DRB1*15:01−) were assessed for HLA-DR and HLA-ABC (as a control) expression. 721.221 and RM3 cells (both sourced from ATCC, mycoplasma free) were used as controls for HLA-DR and HLA-ABC expression. 721.221 cells lack HLA-ABC and express HLA-DR, whereas RM3 cells lack HLA-DR and express HLA-ABC. All cells were stained for cell surface antigens CD14 (anti-CD14-APC, 61D3, Tonbo biosciences), CD3 (anti-CD3-AF700, UCHT1, BD Pharmingen), HLA-ABC (anti-HLA-ABC-AF488, W6/32; pan HLA class I, BioLegend), HLA-DR (anti-HLA-DR-PE, L243; pan HLA-DR, eBioscience), and fixable viability dye eFluor 506 (eBioscience) or isotype controls for HLA-ABC (AF488 Mouse IgG2a, κ, catalogue number 400233, BioLegend) or HLA-DR (PE Mouse IgG2a, κ, catalogue number 12-4724, eBioscience). After washing, cells were fixed using 4% paraformaldehyde. Samples were acquired on a BD LSR II flow cytometer. The fraction of living cells expressing HLA-ABC or HLA-DR was determined using FlowJo X Software.
α-Syn purification and α-syn PFF preparation
Recombinant α-syn monomer was purified as previously described 44. α-Syn pre-formed fibrils (PFF) were prepared by agitating α-syn monomer in a transparent glass vial with a magnetic stirrer (350 rpm at 37°C). After 5–7 days of agitation, the clear α-syn monomer solution became turbid, indicative that α-syn fibrils were generated. The α-syn fibrils were then sonicated for 30 seconds at 10% amplitude to generate α-syn PFF (Branson Digital Sonifier, Danbury, CT, USA). α-Syn monomer and PFF were aliquoted and kept at −80°C.
Statistics and Reproducibility
A power analysis was not conducted a priori as there was no means to estimate effect size. Future validation studies will test whether the Y39 antigenic region is recognized significantly higher in donors with PD compared to HC. The recognition frequency of this peptide was 17% in PD and 3% in HC, which achieves 61% power to detect a response difference between response rates of 14 percentage points. To achieve 80% power in a repeat study to detect a similar effect size, a total of 62 PD and 62 HC should be included. Additionally validation studies will test whether the overall recognition of the peptides is significantly higher in donors with PD compared to HC. Based on our combined cohort data the recognition frequency of a pool of peptides was 37% in PD and 8% in HC. To obtain 80% power in a validation study a cohort size of 43 in both PD and HC will be required to detect the same effect.
The Fisher’s exact (two-tailed) test was used to evaluate the contingency between carriers and non-carriers of the DRB1*15:01 and DRB5*01:01 alleles in the PD and HC donors (Supplemental Table 3), between the responses to phosphorylated aaS129 epitopes of PD and HC donors (Fig. 1e–g), and between DRB1*01/DRB5*01:01/DQB1*03:04/A*11:01 carriers and non-carriers in PD and HC donors (Table 1). A non-parametric test was used because the data is not normally distributed. Fisher’s exact test that provides exact p values for the analysis of contingency tables and is available in most professional statistical analysis packages
The Mann Whitney test (two-tailed) was used to assess whether the number of SFCs of HC donors would be less or greater than those of PD donors (Fig. 1 b–g, Extended Data Figure 1, Fig. 2 a–c). The Mann Whitney test (two-tailed) was used to determine if the number of IFNγ SFC was different than IL-5 SFCs of PD donors (Fig 2d). A non-parametric test was used because the data is not normally distributed.
T-tests were used to analyze parametric differences in demographics between PD and HC donors (Supplemental Table 1a, 1b, 2).
The Wilcoxon test was used to analyze differences in population means of the repeated measurements of number of SFCs induced by media and different isoforms of α-syn (Extended Data Fig. 3). A non-parametric test was used because the data is not normally distributed. We hypothesized that responses to proteins and peptides would be higher than media alone, therefore a one-tailed test was used for those comparisons. Comparison between PFF and native α-syn was two-tailed.
We could not run a power analysis for this prior to the experiments as there were no means to estimate effect size. Future validation studies will test whether the Y39 antigenic region is recognized significantly higher in donors with PD compared to HC. The recognition frequency of this peptide was 17% in PD and 3% in HC, which achieves 61% power to detect a response difference between the response rates of 14 percentage points. To achieve 80% power in a repeat study to detect a similar effect size, a total of 62 PD and 62 HC should be included. Additionally, validation studies will test whether the overall recognition of the 11 peptides is significantly higher in donors with PD compared to HC. Based on our combined cohort data the recognition frequency of a pool of peptides was 37% in PD and 8% in HC. To obtain 80% power in a validation study a cohort size of 43 in both PD and HC will be required to detect the same effect.
All data generated or analyzed during this study are included in this article and its supplement.
Extended Data
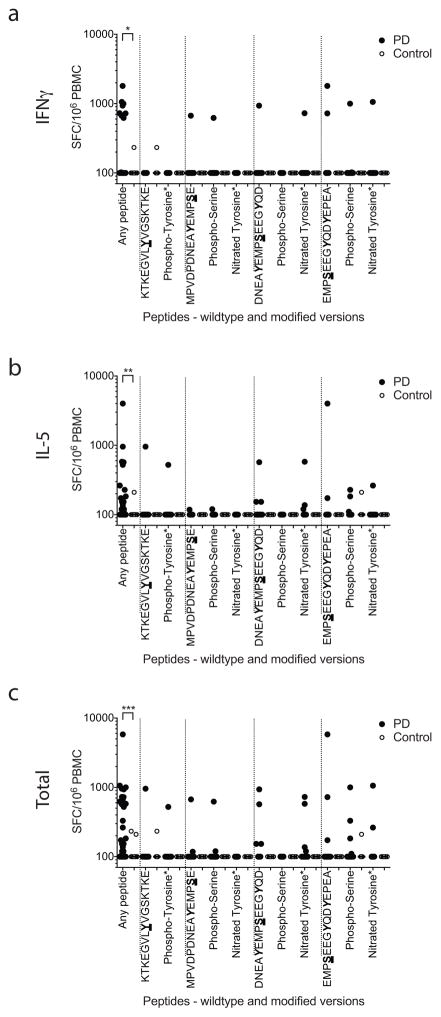
Extended Data Figure 1. T cell reactivity against α-syn peptides (wild type and post-translationally modified).
Magnitude of responses, expressed as the total magnitude (SFC/106 PBMC) of response per peptide/participant combination. Responses against any α-syn 15mer peptide spanning S129 and Y39, “any peptide”, PD (n=209), Control (n=132), and responses against individual α-syn 15mer peptides spanning S129 and Y39. Each dot represents a peptide/participant combination. Closed circles, PD (n=19); open circles, Control (n=12). Two-tailed Mann Whitney, *, p<0.05, **, p<0.01, ***, p<0.001. (A) IFNγ, (B) IL-5, (C) total (IFNγ and IL-5 combined) response.
Extended Data Figure 2. Characterization of α-syn specific responses in PD.
a, Gating strategy. T cells were gated based on CD3 expression. Boolean gating was used to define cytokine-producing cells expressing CD4 and/or CD8. b, Percent total cytokine detected from CD3+ T cells in response to α-syn peptides. Each point represents one participant (n=9); median ± interquartile range is indicated. Dotted line indicates 0.05% cut-off for specific cytokine production by CD3+ T cells. c, Percentage of total cytokines produced for IFNγ, IL-4, IL-10, and IL-17. Each point represents one participant that exceeded the cut-off (n=6), median ± interquartile range is indicated. d, Percentage of total cytokines produced by CD4+, CD8+, CD4−CD8−, or CD4+CD8+ T cells. Each point represents one participant (n=6), median ± interquartile range is indicated.
Extended Data Figure 3. Specific T cell reactivity against native or fibrilized α-syn.
Magnitude of responses, expressed as the average spots per 106 PBMC, of response per protein/PD participant or peptide/PD participant combination (n=12 PD participants, each represented by a different symbol). The lines connect discrete values from each individual participant and are present to provide a means to compare responses within and between individuals. The difference between response to unstimulated compared to peptides, the native α-syn and PFF groups is significant by the Wilcoxon one-tailed test (values are shown in the figure). No significant difference (Wilcoxon two-tailed test) in response to PFF and native protein was apparent in this relatively small sample.
Extended Data Figure 4. HLA-DR surface expression across DRB1*15:01+ or DRB1*15:01− PD and HC participants.
(a) Gating strategy for FACS analysis. After eliminating non-lymphocytes and doublet cells by forward- and side-scatter, cells were gated based on HLA-DR expression. HLA-DR and CD3 expression of participant cells (black; HLA-DR antibody, red; isotype control) of PD patients that carry (b; n=5) and do not carry (c; n=5) DRB1*15:01 allele and HC that carry (d; n=3) and do not carry (e; n=5) DRB1*15:01 allele. 721.221 (f) and RM3 (g) cells are used as controls that do not and do express HLA class II, respectively. (h) Mean fluorescent intensities (MFI) ± standard deviations of HLA-DR expression for each participant cohort. (i) Percentage of living cells that express HLA-DR, mean ± SD.
Extended Data Figure 5. HLA class I surface expression across DRB1*15:01+ or DRB1*15:01− PD and HC participants.
(a) Gating strategy for FACS analysis. After eliminating non-lymphocytes and doublet cells by forward- and side-scatter, cells were gated based on HLA-ABC expression. HLA-ABC and CD3 expression of participant cells (black: HLA-ABC antibody, red: isotype control) of PD patients that carry (b; n=5) and do not carry (c; n=5) DRB1*15:01 allele and HC that carry (d; n=3) and do not carry (e; n=5) DRB1*15:01 allele. 721.221 (f) and RM3 (g) cells are used as controls that do not and do express HLA class I, respectively. (h) Mean fluorescent intensities (MFI) ± standard deviations of HLA-ABC expression for each participant cohort.
Supplementary Material
Acknowledgments
Supported by the JPB (D.S., T.M.D), William F. Richter (D.S.) and Parkinson’s Foundations (A.S., D.S.). X.B.M., V.L.D. and T.M.D. are supported by NIH/NINDS grant P50 NS38377. X.B.M is supported by NIH/NIA ADRC grant 90071017. T.M.D. is the Abramson Professor. X.B.M., V.L.D. and T.M.D. acknowledge joint support by AHMMRF, JHH and JHUSOM PD program, M-2014.
Footnotes
Author contributions
D.S. and A.S. conceived the study and wrote the paper. C.A. and F.G. contributed to writing and prepared figures. R.A. and L.C recruited participants and performed clinical evaluations. C.L., J. A.-L. and A.F. maintained patient data and assisted in subject recruitment. E.K. arranged tissue handling and maintained records. F.G., C.O., J.P., M.D., C.C., D.W., E.P., S.M., B.P., W.H., C.M. and C.A. conducted analyses of T cells and antigenic epitopes. X.M., V.D. and T.D. prepared and characterized α-syn proteins and fibrils.
Columbia University filed a patent application for use of α-syn peptides as biomarkers (US Patent Application No. 15/300,713). David Sulzer (Columbia) and Alessandro Sette (La Jolla Institute) are listed as inventors.
References
- 1.Greenbaum J, et al. Functional classification of class II human leukocyte antigen (HLA) molecules reveals seven different supertypes and a surprising degree of repertoire sharing across supertypes. Immunogenetics. 2011;63:325–335. doi: 10.1007/s00251-011-0513-0. [DOI] [PMC free article] [PubMed] [Google Scholar]
- 2.Hamza TH, et al. Common genetic variation in the HLA region is associated with late-onset sporadic Parkinson’s disease. Nat Genet. 2010;42:781–785. doi: 10.1038/ng.642. [DOI] [PMC free article] [PubMed] [Google Scholar]
- 3.Kannarkat GT, et al. Common Genetic Variant Association with Altered HLA Expression, Synergy with Pyrethroid Exposure, and Risk for Parkinson’s Disease: An Observational and Case-Control Study. NPJ Parkinson’s disease. 2015:1. doi: 10.1038/npjparkd.2015.2. [DOI] [PMC free article] [PubMed] [Google Scholar]
- 4.Spillantini MG, Crowther RA, Jakes R, Hasegawa M, Goedert M. Alpha-synuclein in filamentous inclusions of Lewy bodies from Parkinson’s disease and dementia with Lewy bodies. Proc Natl Acad Sci USA. 1998;95:6469–6473. doi: 10.1073/pnas.95.11.6469. [DOI] [PMC free article] [PubMed] [Google Scholar]
- 5.Marrack P, Kappler JW. Do MHCII-presented neoantigens drive type 1 diabetes and other autoimmune diseases? Cold Spring Harbor perspectives in medicine. 2012;2:a007765. doi: 10.1101/cshperspect.a007765. [DOI] [PMC free article] [PubMed] [Google Scholar]
- 6.Foix C, Nicolesco J. Cérébrale: Les Noyauz Gris Centraux Et La Région Mésencephalo-Soue-Optique. SuiviD’Un Appendice Sur L’Anatomic Pathologique De La Maladie De Parkinson. Masson et Cie; 1925. [Google Scholar]
- 7.Cebrian C, Loike JD, Sulzer D. Neuroinflammation in Parkinson’s disease animal models: a cell stress response or a step in neurodegeneration? Curr Top Behav Neurosci. 2015;22:237–270. doi: 10.1007/7854_2014_356. [DOI] [PubMed] [Google Scholar]
- 8.Brochard V, et al. Infiltration of CD4+ lymphocytes into the brain contributes to neurodegeneration in a mouse model of Parkinson disease. J Clin Invest. 2009;119:182–192. doi: 10.1172/JCI36470. [DOI] [PMC free article] [PubMed] [Google Scholar]
- 9.Wissemann WT, et al. Association of Parkinson disease with structural and regulatory variants in the HLA region. Am J Hum Genet. 2013;93:984–993. doi: 10.1016/j.ajhg.2013.10.009. [DOI] [PMC free article] [PubMed] [Google Scholar]
- 10.Cebrian C, et al. MHC-I expression renders catecholaminergic neurons susceptible to T-cell-mediated degeneration. Nat Commun. 2014;5:3633. doi: 10.1038/ncomms4633. [DOI] [PMC free article] [PubMed] [Google Scholar]
- 11.Mor F, Quintana F, Mimran A, Cohen IR. Autoimmune encephalomyelitis and uveitis induced by T cell immunity to self beta-synuclein. J Immunol. 2003;170:628–634. doi: 10.4049/jimmunol.170.1.628. [DOI] [PubMed] [Google Scholar]
- 12.Theodore S, Cao S, McLean PJ, Standaert DG. Targeted overexpression of human alpha-synuclein triggers microglial activation and an adaptive immune response in a mouse model of Parkinson disease. J Neuropathol Exp Neurol. 2008;67:1149–1158. doi: 10.1097/NEN.0b013e31818e5e99. [DOI] [PMC free article] [PubMed] [Google Scholar]
- 13.Benner EJ, et al. Nitrated alpha-synuclein immunity accelerates degeneration of nigral dopaminergic neurons. PLoS ONE. 2008;3:e1376. doi: 10.1371/journal.pone.0001376. [DOI] [PMC free article] [PubMed] [Google Scholar]
- 14.Harms AS, et al. MHCII is required for alpha-synuclein-induced activation of microglia, CD4 T cell proliferation, and dopaminergic neurodegeneration. J Neurosci. 2013;33:9592–9600. doi: 10.1523/JNEUROSCI.5610-12.2013. [DOI] [PMC free article] [PubMed] [Google Scholar]
- 15.Vita R, et al. The immune epitope database (IEDB) 3.0. Nucleic Acids Res. 2015;43:D405–412. doi: 10.1093/nar/gku938. [DOI] [PMC free article] [PubMed] [Google Scholar]
- 16.Kim KS, et al. Proteolytic cleavage of extracellular alpha-synuclein by plasmin: implications for Parkinson disease. J Biol Chem. 2012;287:24862–24872. doi: 10.1074/jbc.M112.348128. [DOI] [PMC free article] [PubMed] [Google Scholar]
- 17.Hossain S, et al. Limited proteolysis of NACP/alpha-synuclein. J Alzheimers Dis. 2001;3:577–584. doi: 10.3233/jad-2001-3608. [DOI] [PubMed] [Google Scholar]
- 18.Fujiwara H, et al. alpha-Synuclein is phosphorylated in synucleinopathy lesions. Nature cell biology. 2002;4:160–164. doi: 10.1038/ncb748. [DOI] [PubMed] [Google Scholar]
- 19.Anderson JP, et al. Phosphorylation of Ser-129 is the dominant pathological modification of alpha-synuclein in familial and sporadic Lewy body disease. J Biol Chem. 2006;281:29739–29752. doi: 10.1074/jbc.M600933200. [DOI] [PubMed] [Google Scholar]
- 20.Wang W, et al. Caspase-1 causes truncation and aggregation of the Parkinson’s disease-associated protein alpha-synuclein. Proc Natl Acad Sci U S A. 2016;113:9587–9592. doi: 10.1073/pnas.1610099113. [DOI] [PMC free article] [PubMed] [Google Scholar]
- 21.Kasai T, et al. Cleavage of normal and pathological forms of alpha-synuclein by neurosin in vitro. Neurosci Lett. 2008;436:52–56. doi: 10.1016/j.neulet.2008.02.057. [DOI] [PubMed] [Google Scholar]
- 22.Li W, et al. Aggregation promoting C-terminal truncation of alpha-synuclein is a normal cellular process and is enhanced by the familial Parkinson’s disease-linked mutations. Proc Natl Acad Sci U S A. 2005;102:2162–2167. doi: 10.1073/pnas.0406976102. [DOI] [PMC free article] [PubMed] [Google Scholar]
- 23.Dufty BM, et al. Calpain-cleavage of alpha-synuclein: connecting proteolytic processing to disease-linked aggregation. Am J Pathol. 2007;170:1725–1738. doi: 10.2353/ajpath.2007.061232. [DOI] [PMC free article] [PubMed] [Google Scholar]
- 24.Brahmachari S, et al. Activation of tyrosine kinase c-Abl contributes to alpha-synuclein-induced neurodegeneration. J Clin Invest. 2016;126:2970–2988. doi: 10.1172/JCI85456. [DOI] [PMC free article] [PubMed] [Google Scholar]
- 25.Hernandez DG, Reed X, Singleton AB. Genetics in Parkinson disease: Mendelian versus non-Mendelian inheritance. J Neurochem. 2016 doi: 10.1111/jnc.13593. [DOI] [PMC free article] [PubMed] [Google Scholar]
- 26.Martinez-Vicente M, et al. Dopamine-modified alpha-synuclein blocks chaperone-mediated autophagy. J Clin Invest. 2008;118:777–788. doi: 10.1172/JCI32806. [DOI] [PMC free article] [PubMed] [Google Scholar]
- 27.Cuervo AM, Stefanis L, Fredenburg R, Lansbury PT, Sulzer D. Impaired degradation of mutant alpha-synuclein by chaperone-mediated autophagy. Science. 2004;305:1292–1295. doi: 10.1126/science.1101738. [DOI] [PubMed] [Google Scholar]
- 28.Orenstein SJ, et al. Interplay of LRRK2 with chaperone-mediated autophagy. Nat Neurosci. 2013;16:394–406. doi: 10.1038/nn.3350. [DOI] [PMC free article] [PubMed] [Google Scholar]
- 29.Luk KC, et al. Pathological alpha-synuclein transmission initiates Parkinson-like neurodegeneration in nontransgenic mice. Science. 2012;338:949–953. doi: 10.1126/science.1227157. [DOI] [PMC free article] [PubMed] [Google Scholar]
- 30.Atik A, Stewart T, Zhang J. Alpha-Synuclein as a Biomarker for Parkinson’s Disease. Brain Pathol. 2016;26:410–418. doi: 10.1111/bpa.12370. [DOI] [PMC free article] [PubMed] [Google Scholar]
- 31.Petrich de Marquesini LG, et al. IFN-gamma and IL-10 islet-antigen-specific T cell responses in autoantibody-negative first-degree relatives of patients with type 1 diabetes. Diabetologia. 2010;53:1451–1460. doi: 10.1007/s00125-010-1739-3. [DOI] [PubMed] [Google Scholar]
- 32.Arif S, et al. Peripheral and islet interleukin-17 pathway activation characterizes human autoimmune diabetes and promotes cytokine-mediated beta-cell death. Diabetes. 2011;60:2112–2119. doi: 10.2337/db10-1643. [DOI] [PMC free article] [PubMed] [Google Scholar]
- 33.Matheoud D, et al. Parkinson’s Disease-Related Proteins PINK1 and Parkin Repress Mitochondrial Antigen Presentation. Cell. 2016;166:314–327. doi: 10.1016/j.cell.2016.05.039. [DOI] [PubMed] [Google Scholar]
- 34.Alcalay RN, et al. Glucocerebrosidase activity in Parkinson’s disease with and without GBA mutations. Brain. 2015;138:2648–2658. doi: 10.1093/brain/awv179. [DOI] [PMC free article] [PubMed] [Google Scholar]
- 35.Hughes AJ, Ben-Shlomo Y, Daniel SE, Lees AJ. What features improve the accuracy of clinical diagnosis in Parkinson’s disease: a clinicopathologic study. 1992. Neurology. 2001;57:S34–38. [PubMed] [Google Scholar]
- 36.Paul S, et al. HLA class I alleles are associated with peptide-binding repertoires of different size, affinity, and immunogenicity. J Immunol. 2013;191:5831–5839. doi: 10.4049/jimmunol.1302101. [DOI] [PMC free article] [PubMed] [Google Scholar]
- 37.Oseroff C, et al. Molecular determinants of T cell epitope recognition to the common Timothy grass allergen. J Immunol. 2010;185:943–955. doi: 10.4049/jimmunol.1000405. [DOI] [PMC free article] [PubMed] [Google Scholar]
- 38.McKinney DM, et al. Development and validation of a sample sparing strategy for HLA typing utilizing next generation sequencing. Hum Immunol. 2015 doi: 10.1016/j.humimm.2015.04.007. [DOI] [PMC free article] [PubMed] [Google Scholar]
- 39.Paul S, et al. A population response analysis approach to assign class II HLA-epitope restrictions. J Immunol. 2015;194:6164–6176. doi: 10.4049/jimmunol.1403074. [DOI] [PMC free article] [PubMed] [Google Scholar]
- 40.Sidney J, et al. Measurement of MHC/peptide interactions by gel filtration or monoclonal antibody capture. Current protocols in immunology. 2013;Chapter 18(Unit 18.13) doi: 10.1002/0471142735.im1803s100. [DOI] [PMC free article] [PubMed] [Google Scholar]
- 41.Cheng Y, Prusoff WH. Relationship between the inhibition constant (K1) and the concentration of inhibitor which causes 50 per cent inhibition (I50) of an enzymatic reaction. Biochem Pharmacol. 1973;22:3099–3108. doi: 10.1016/0006-2952(73)90196-2. [DOI] [PubMed] [Google Scholar]
- 42.Gulukota K, Sidney J, Sette A, DeLisi C. Two complementary methods for predicting peptides binding major histocompatibility complex molecules. J Mol Biol. 1997;267:1258–1267. doi: 10.1006/jmbi.1997.0937. [DOI] [PubMed] [Google Scholar]
- 43.Sidney J, et al. Divergent motifs but overlapping binding repertoires of six HLA-DQ molecules frequently expressed in the worldwide human population. J Immunol. 2010;185:4189–4198. doi: 10.4049/jimmunol.1001006. [DOI] [PMC free article] [PubMed] [Google Scholar]
- 44.Mao X, et al. Pathological alpha-synuclein transmission initiated by binding lymphocyte-activation gene 3. Science. 2016:353. doi: 10.1126/science.aah3374. [DOI] [PMC free article] [PubMed] [Google Scholar]
Associated Data
This section collects any data citations, data availability statements, or supplementary materials included in this article.


