

Abstract
Progress in DNA sequencing has revealed the startling complexity of cancer genomes, which typically carry thousands of somatic mutations. However, it remains unclear which are the key driver mutations or dependencies in a given cancer and how these influence pathogenesis and response to therapy. Although tumors of similar types and clinical outcomes can have patterns of mutations that are strikingly different, it is becoming apparent that these mutations recurrently hijack the same hallmark molecular pathways and networks. For this reason, it is likely that successful interpretation of cancer genomes will require comprehensive knowledge of the molecular networks under selective pressure in oncogenesis. Here we announce the creation of a new effort, called The Cancer Cell Map Initiative (CCMI), aimed at systematically detailing these complex interactions among cancer genes and how they differ between diseased and healthy states. We discuss recent progress that enables creation of these Cancer Cell Maps across a range of tumor types and how they can be used to target networks disrupted in individual patients, significantly accelerating the development of precision medicine.
Ever since the first draft of the human genome was published (Lander et al., 2001; Venter et al., 2001), there has been an expectation this genetic code would reveal the secrets of life, ultimately leading to novel therapeutic strategies for a multitude of diseases. To effectively identify disease genes, DNA sequencing has been frequently applied to study cohorts of individuals afflicted with the same disease so that important variants associated with disease risk can be uncovered when compared to healthy individuals. As cancers arise via somatic mutation, this approach has been complemented by extensive studies of the tumor genomes of a large number of cancer types (Hudson et al., 2010; Cancer Genome Atlas Research Network, 2008, 2011, 2012a, 2012b, 2012c, 2013a, 2013b, 2014a, 2014b; Verhaak et al., 2010). Although there have been discrete sets of genes identified that are altered in these cohorts, disappointingly, there has not been a consensus set of mutations attributed to each cancer state. Instead, what is more common is that each tumor from the same cancer type has a strikingly different set of mutations that all lead to the same disease state (Mardis, 2014). This situation has led to an interesting debate on what the next steps should be to help understand the biological mechanisms driving different cancers. Is further sequencing of larger cohorts the answer (Lawrence et al., 2014)? Or should we more efficiently extract biological insight from existing genomic data using orthogonal tools? While not precluding the former, we argue strongly here that the latter approach will be essential in interpreting mutations that cause cancer. In this manuscript, we discuss the establishment of the Cancer Cell Map Initiative (CCMI), a resource that will use experimental and computational approaches to systematically generate hallmark cancer networks, an effort that will be essential in interpreting cancer genomic data.
A tsunami of cancer genome information
Over the last few years, a number of global consortia, such as The Cancer Genome Atlas (TCGA) (Cancer Genome Atlas Research Network, 2008, 2011, 2012a, 2012b, 2012c, 2013a, 2013b, 2014a, 2014b) and the International Cancer Genome Consortium (International Cancer Genome Consortium et al., 2010; Jones et al., 2012), are seeking to create a comprehensive catalogue of the genes that initiate or cause the progression of cancer. These studies involve full exome or genome sequencing of tumor samples, followed by comparison to normal tissue genomes from the same patients, to identify the point mutations, copy number aberrations, and gross genomic rearrangements that have been acquired exclusively in the tumor. Such ‘somatic’ events are examined statistically over a population of cancer patients to identify genes that are altered more often than expected by chance, resulting in a list of approximately 250 frequently mutated genes (Lawrence et al., 2014; Lawrence et al., 2013). In parallel, numerous genome-wide association studies (GWAS) have compared the normal or ‘germline’ genomes of cancer patients to those of healthy controls to identify inherited genetic variants that are associated with increased risk of cancer (Amundadottir et al., 2009; Flaherty et al., 2010; Girotti et al., 2015; Kuchenbaecker et al., 2015; Long et al., 2014; Pharoah et al., 2013; Turnbull et al., 2010; Vijai et al., 2015; Yeager et al., 2009). To-date, GWAS has identified around 200 associations between cancer risk and specific genetic loci, such as single nucleotide polymorphisms, haplotypes, and rare variants (Chang et al., 2014). Somatic and germline variants are then accumulated in data repositories, including the Catalogue of Somatic Mutations in Cancer (COSMIC) (Forbes et al., 2014) and the National Human Genome Research Institute’s GWAS Catalog (Welter et al., 2014), as are the cancer genomes themselves (Wilks et al., 2014). Some of the cancer projects encompass datasets that span not just genome sequence but a variety of other layers of complementary ‘omics information, including epigenetic changes, RNA profiles, and protein abundances. Several projects are also generating related ‘omics and drug sensitivity data across large panels of cancer cell lines, including the Cancer Cell Line Encyclopedia (Barretina et al., 2012), the Genomics of Drug Sensitivity in Cancer Resource (Yang et al., 2013), and Project Achilles (Nijhawan et al., 2012).
Cancer as a pathway-based disease
For simple Mendelian disorders, genome sequencing has been able to identify specific loci that are directly responsible for a given disease state (Figure 1A, left). For example, some of the greatest successes in GWAS have been in characterizing the polygenic nature of type 2 diabetes, lipid levels, and obesity (Teslovich et al., 2010). In other cases, large-scale GWAS have illuminated individual loci that dominate the genetic contribution to a complex trait, such as the case of HIV Elite Controllers (International HIV Consortium et al., 2010). However, these insights are relatively atypical of GWAS and more prevalent are Manhattan plots with suggestive signals but which lack statistical significance (Figure 1A, right side) (Goldstein, 2009; Maher, 2008; Manolio et al., 2009; Visscher et al., 2012; Zhang et al., 2014). In cancer and other complex diseases, the power to detect important germline variants or somatic mutations has been hampered by the extreme genetic heterogeneity observed across the patient population (Gerlinger et al., 2012; Lawrence et al., 2013; Longo, 2012; Zhang et al., 2014). In particular, one of the most striking outcomes of the cancer sequencing projects is the discovery that each tumor genome is quite different from every other (Figure 2A). Although many tumors harbor alterations to well-known cancer genes such as TP53 or PIK3CA, beyond these common events lies a “long tail” of ~20 to >1000 genetic alterations, the majority of which are rare across the patient population. Heterogeneity has also been observed within different subpopulations of cells taken from a single patients’ tumor (Fisher et al., 2013; Lawrence et al., 2013; Zhang et al., 2014) complicating the analysis of tumor genomes as frequently only the dominant clone is analyzed. This lack of common genetic signal between or within patients limits the power of gene association or frequency-based methods to link individual genes with pathogenesis in cancer (Yaffe, 2013).
Figure 1.

(A) Current paradigm for genome wide association studies (GWAS) seeking to associate genetic variation in single genes with the incidence of diseases or disease outcomes. With all genes tested individually for association, often none are able to pass a genome-wide level of significance. (B) Translation of variation at the nucleotide or gene level to variation in protein networks. Multiple genetic variants, each of which is observed rarely in a disease population, are found to impact a common region of a protein network due to different means of altering the activity of a protein complex, metabolic pathway, or signaling cascade. Such common events can be realized with an integrated physical and genetic interaction map where directionality of pathways can be inferred (Battle et al., 2010; Fischer et al., 2015; St Onge et al., 2007). (C) A pipeline for understanding mutants involved in disease using network biology, which initially requires a reference map to help interrupt the underlying biology behind the mutations.
Figure 2. Network based stratification of somatic mutations in ovarian cancer.

(A) Network of genes for which mutation leads to an aggressive ‘subtype 1’ of ovarian tumor. Node size (importance) shows the network proximity of that gene to somatic mutations within tumors of that subtype. Node color corresponds to functional classes of interest. Edge width shows the interaction confidence score from the HumanNet resource (http://www.functionalnet.org/) representing the confidence that the connected genes function in the same process given the available experimental evidence for interaction. Thick node borders indicate genes that are included in the COSMIC cancer gene census. (B) Kaplan-Meier survival plot for NBS ovarian cancer subtypes (k = 4). Subtype 1 has the lowest survival and highest platinum resistance rates amongst the four subtypes. (C) Scatterplot of mutations arising in ovarian tumors in The Cancer Genome Atlas (http://cancergenome.nih.gov/), focused on genes in the subtype 1 subnetwork. Each gray bar represents a gene (x-axis) that is mutated in a particular tumor (y-axis).
As a common explanation for the observed heterogeneity, it has been widely discussed that cancer is a disease that arises because of the action of hallmark cancer pathways (Hanahan and Weinberg, 2000, 2011; Vogelstein and Kinzler, 2004). Although any particular mutation or mutated gene may be a rare event when viewed independently, the key hypothesis is that various rare mutations found in different individuals will be found to converge on a smaller number of protein complexes, signaling cascades, or transcriptional regulatory circuits. This ‘pathway principle’ is being applied with increasing success in recent interpretations of cancer genomics datasets (Cancer Genome Atlas Research Network, 2008; Ding et al., 2008; Perry et al., 2014). For example, a recent analysis of TCGA data identified 16 significantly mutated genetic networks that correspond to well-known cancer signaling pathways, as well as networks with less characterized roles in cancer including cohesin and condensin (Leiserson et al., 2014), two related protein complexes required for segregating sister chromatids during cell division. Other efforts have shown that, within a hallmark cancer pathway, typically no more than one gene is mutated per tumor. This effect, which has been termed ‘mutual exclusivity’, possibly occurs because additional mutations in that same pathway provide no further selective advantage (Ciriello et al., 2012). Other sets of genes are rarely observed to be mutated together in the same tumor due to synthetic lethal interaction, in which the presence of the first mutation creates a specific vulnerability to the second, providing negative selective pressure against that combination during tumor evolution (Ashworth et al., 2011; Corcoran et al., 2013; Gross et al., 2014; Jerby-Arnon et al., 2014; Morrison et al., 1997; Nijman and Friend, 2013; Scholl et al., 2009; Vizeacoumar et al., 2013). Thus, the key question is not whether cancer is a pathway or network-based disease – this hypothesis is familiar and increasingly well supported – but how best to apply this principle to the analysis and interpretation of cancer genomes.
A network mapping strategy for cancer
Several groups have strongly argued that what is needed to interpret genomic data is the ability to place these data into biological context by mapping the identified sequence alterations onto the complexes and pathways in which they function (Califano et al., 2012; Ideker et al., 2011; Pujana et al., 2007; Sahni et al., 2015; Wang et al., 2010; Yaffe, 2013; Zuk et al., 2012). Instead of Manhattan plots testing individual genes for association, generation of analogous plots would be performed using networks (Figure 1B). To effectively enable this type of analysis, we believe it will be absolutely critical to initially define networks in “healthy” cells, unperturbed by specific mutations. Using cancer genomic information, the sets of genes that are linked to different disease states are being identified, and these should be targeted for systematic study both with and without cancer mutations. While many databases exist to house information on pathways and complexes complied from individual studies, and should indeed be exploited, there is great power in the systematic and unbiased collection of network data to accurately recapitulate the molecular wiring of the cell. Ultimately, the goal should be to generate “differential” maps (Bandyopadhyay et al., 2010; Ideker and Krogan, 2012), in which networks are compared in the presence versus absence of the specific mutants associated with different disease states. Only by comparing to the reference “wild-type” map will be it possible to truly understand how mutated genomes hijack and re-wire pathways and complexes during the course of disease.
In model organisms, systematic integration of physical and genetic interaction data is a powerful way to reconstruct biological pathways (Bandyopadhyay et al., 2008; Beltrao et al., 2010; Beyer et al., 2007; Collins et al., 2007; Fischer et al., 2015; Gao et al., 2004; Hannum et al., 2009; Kelley and Ideker, 2005; Roguev et al., 2008; Schuldiner et al., 2005; Zhu et al., 2008). Mapping of physical networks, including protein-protein, protein-DNA, protein-RNA and DNA-DNA interactions, is used to systematically identify the physical modules in a system, including macromolecular protein complexes. In contrast, genetic interaction data, in which genes are perturbed in a pair-wise fashion and the effects quantitatively assessed, provide the functional framework to place the physical modules into meaningful pathways. We argue that a similar dual approach should be utilized to define and characterize the hallmark pathways of cancer. Recent advances in genome engineering and interaction mapping in mammalian systems have made it possible to systematically physically and genetically interrogate sets of genes and proteins that have been linked to different disease states. For example, CRISPR/Cas9 technology permits facile labeling of genes with affinity tags and the engineering of specific point mutants into the genomes of mammalian somatic cells (Doudna and Charpentier, 2014) or induced pluripotent stem cells (iPS cells) (Yamanaka, 2009). Importantly, targeting specific point mutants using network biology approaches will be key in understanding how these mutations give rise to different diseases states (Braberg et al., 2013; Sahni et al., 2013). The CRISPR/Cas9 recombination technology helps to ensure normal expression of the targeted protein, once tagged, in subsequent proteomics analysis. Since iPS cells can give rise to other cell types in the body, one can argue that targeting such a cell line would be appropriate, at least initially. Using specific genetic and chemical manipulation, these iPS cell lines can then be differentiated into specific cell types (Amabile and Meissner, 2009), proteins purified in a temporal fashion (Bisson et al., 2011; Ideker and Krogan, 2012), and complexes analyzed via mass spectrometry (Figure 1B, bottom left). While analysis of isolated mutations in iPS cells should be carried out, it will also be imperative to study mutations in the cancerous lines in which they arise. Therefore, we anticipate that a complete Cancer Cell Map must ultimately incorporate data generated using “healthy” cells as well as appropriate tumor cell lines. There is certain thinking that, even in a single patient, cancer arises from a heterogeneous group of cell types, each contributing a different set of mutations to the ultimate growth of a tumor (Fisher et al., 2013; Lawrence et al., 2013). If so, complexity grows, although it would still be of great value to have a reference map in even one cell type subjected to the set of mutations uncovered in cancer genomes.
Importantly, the identification of protein complexes will facilitate structural studies, including those involving recently developed cryo-EM technology (Li et al., 2013; Shen et al., 2015). Similarly, sets of genes can be analyzed functionally using genetic interaction mapping techniques (Bassik et al., 2013; Laufer et al., 2013; Roguev et al., 2013), and the resulting data can be used to place complexes into pathways (Figure 1B, bottom right). Finally, a number of cancers arise in part by viral infection, including human papillomavirus involved in oropharyngeal and cervical cancers (Gross et al., 2014; Marur et al., 2010; Munoz et al., 2006) and hepatitis B and C involved in liver cancer (Levrero, 2006). The corresponding pathogenic viral proteins can be used as probes to generate physical and genetic interaction maps to help better interpret the cancer genomic datasets, since similar mechanisms may exist between molecular re-wiring induced by viruses and in mutated cancer genomes. We have recently shown that targeting viruses for systematic host-pathogen interaction studies is a powerful approach to help understand the underlying biology behind different pathogenic disease states (Davis et al., 2015; Jager et al., 2012a; Jager et al., 2012b; Ramage et al., 2015).
From descriptive to predictive networks
Armed with a collection of systematically generated network maps, we see several immediate applications. First, there is increasing evidence that prior knowledge of molecular networks can powerfully guide the search for disease genes (Ideker et al., 2011). A number of studies have recently demonstrated the power of network-guided GWAS for diverse diseases such as autism (O’Roak et al., 2012; Parikshak et al., 2013; Willsey et al., 2013), multiple sclerosis (Baranzini et al., 2009; International Multiple Sclerosis Genetics Consortium, 2013) and motor neuron disorders (Novarino et al., 2014), among others. These efforts are fueled by a growing number of bioinformatic approaches for integrating genetic data with molecular interaction networks or pathway databases (Bandyopadhyay et al., 2008; Collins et al., 2007; Hannum et al., 2009; Jia et al., 2011; Kelley and Ideker, 2005; Roguev et al., 2008; Wang et al., 2010). Pathway and network-guided GWAS in the cancer field are in their infancy (Fehringer et al., 2012; Koster et al., 2014; Tang et al., 2014), although highly related progress is being made in identifying new cancer genes based on integration of somatic mutations and networks (Ciriello et al., 2012; Leiserson et al., 2014). Regardless, the concepts and methodology are general and we anticipate that, as with other diseases, future cancer genomic studies will rely increasingly on network knowledge.
We anticipate that a second major use of network information in cancer will be translational, by providing a platform for integrating patient data to make biological and clinical predictions. In an increasing number of cases, network analyses are yielding better indicators of patient survival times or responses to therapy than traditional ‘black-box’ statistical regression or classification methods (Carro et al., 2009; Chuang et al., 2007; Chuang et al., 2012; Dutkowski and Ideker, 2011; Hofree et al., 2013; Jerby-Arnon et al., 2014; Taylor et al., 2009; Vaske et al., 2010). For example, we recently introduced the method of Network-Based Stratification (NBS), which allows for stratification of cancer into informative subtypes by clustering together patients who have somatic mutations that impact common regions of a reference molecular interaction network (Hofree et al., 2013). Several publicly-available molecular interaction networks were shown to be effective aids in this task, including HumanNet, a network of approximately 500,000 human protein interactions which integrates 21 types of ‘omics’ data, with each data type weighted according to how well it links proteins known to function together (Lee et al., 2011). NBS has been demonstrated in ovarian, uterine, and lung cancer (Hofree et al., 2013) and, more recently, thyroid cancer cohorts (Giordano and The Cancer Genome Atlas Research Network, 2014). For each of these tissues, NBS identified clear subtypes predictive of clinical outcomes such as patient survival or response to therapy, and it identified network regions characteristic of each subtype. For example, the network region for ovarian cancer subtype 1 (Figure 2A) clustered patients with somatic mutations in genes including the Fibroblast Growth Factor Receptor (FGFR) family and cytoskeletal signaling proteins such as ankyrin (e.g. ANK1). Patients with mutations in this network region had the most aggressive ovarian tumors as measured by survival, in contrast to patients whose mutations placed them in other subtypes (Figure 2B). Strikingly, these patients’ mutations did not form a recognizable cluster in the absence of network information (Figure 2C), since these mutations largely affected different genes.
Moving forward, our view is that strong emphasis should be placed on new methodologies to identify which networks and pathways are affected by mutations conferring risk of a disease, for using network knowledge to predict the outcome of therapy in a given patient, and to predict novel molecular targets (Watson et al., 2013). For these purposes, one can leverage databases of curated mutations, clinical data and drug-gene interactions, such as DoCM, CIViC and DGidb, respectively (http://docm.genome.wustl.edu, https://civic.genome.wustl.edu, (Griffith et al., 2013)). Such tasks will require a bioinformatic framework to integrate patient molecular and clinical data with biological networks, with the goal of making clinically relevant diagnoses and predictions about an individual based on their genomic information. By probing the available network knowledge as part of routine analysis of patient data, questions such as which cancer subtype a patient belongs to, whether their tumor will metastasize or not, and what drug should be chosen to treat them may be answered.
Towards creation of a Cancer Cell Map
As we have outlined, there exists a vast amount of sequence data from tumors associated with many different cancer types, and efforts are ongoing to extract mechanistic insight from this information. Given all of this progress, what is now needed is an integrated computational and experimental strategy that will help bridge the basic and clinical research communities, an effort that will ultimately impact translational research. Genomic data derived from tumor sequencing studies identifies key genes implicated in different cancer states. Integrated physical and genetic networks based on these factors (Figure 1) will help put the mutations into context (Figure 2) as well as to discover new disease genes as interacting partners become apparent (Figure 3). This is the goal of The Cancer Cell Map, a resource that can be used for cancer genome interpretation and to identify key complexes and pathways to be studied in greater mechanistic detail to get a deeper understanding about the underlying biology underlying different cancer states.
Figure 3. Pipeline for cancer cell network mapping and network interpretation of patient data.
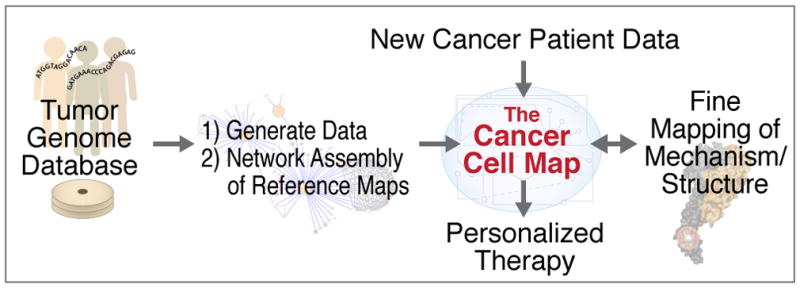
Growing databases of tumor genomes are mined to identify genes and cell types in which alterations drive or predispose to development of cancer. Seeded by this information, systematic network mapping efforts lead to assembly of the ‘Cancer Cell Map’, providing a working scaffold of molecular interactions and the cell types and conditions under which they are active. New patient data are assessed by query against this resource, which translates alterations at the genetic and molecular level to reveal the impact these alterations have on the hallmark networks of cancer. Key interactions and network structures are explored for fine mapping of their basis in molecular structure or implications to biomolecular mechanism.
Although such a framework is readily applicable not only to cancer but also to virtually any other disease, an initial focus on cancer is warranted for several reasons. First, cancer is well known to be one of the greatest causes of mortality in developed nations. Second, many organized efforts focused on cancer, including those from TCGA and ICGC, have resulted in the collection of many somatic tumor exomes, methylomes, microRNA and mRNA profiles, as well as many other ‘omics datasets, providing the most concerted and comprehensive data collection for any disease, information that can be leveraged in the CCMI. Finally, unlike many other complex diseases, cancer is an evolutionary process driven by somatic changes to normal cells, a fact that allows for powerful subtractive approaches, which reduce many genomic variants to a few somatic alterations. We believe that similar subtractive approaches could and should be applied to systematic network mapping approaches (Ideker and Krogan, 2012). Nonetheless, ultimately a collection of cell maps generated to help understand the underlying biology behind many disease states would provide a resource to gain insight into biological data collected from new patients, and, depending on the pathways and complexes that are perturbed, select targeted therapies, the goal of precision medicine (Figure 3).
Acknowledgments
We would like to thank Hannah Carter, Ryan Hernandez, Danielle Swaney, Minkyu Kim, Michael Shales and Matan Hofree for helpful comments and discussion as well as the Fred Luddy Family Foundation for the founding donation to the CCMI (Cancer Cell Map Initiative).
References
- Amabile G, Meissner A. Induced pluripotent stem cells: current progress and potential for regenerative medicine. Trends in molecular medicine. 2009;15:59–68. doi: 10.1016/j.molmed.2008.12.003. [DOI] [PubMed] [Google Scholar]
- Amundadottir L, Kraft P, Stolzenberg-Solomon RZ, Fuchs CS, Petersen GM, Arslan AA, Bueno-de-Mesquita HB, Gross M, Helzlsouer K, Jacobs EJ. Genome-wide association study identifies variants in the ABO locus associated with susceptibility to pancreatic cancer. Nature genetics. 2009;41:986–990. doi: 10.1038/ng.429. [DOI] [PMC free article] [PubMed] [Google Scholar]
- Ashworth A, Lord CJ, Reis-Filho JS. Genetic interactions in cancer progression and treatment. Cell. 2011;145:30–38. doi: 10.1016/j.cell.2011.03.020. [DOI] [PubMed] [Google Scholar]
- Bandyopadhyay S, Kelley R, Krogan NJ, Ideker T. Functional maps of protein complexes from quantitative genetic interaction data. PLoS Comput Biol. 2008;4:e1000065. doi: 10.1371/journal.pcbi.1000065. [DOI] [PMC free article] [PubMed] [Google Scholar]
- Bandyopadhyay S, Mehta M, Kuo D, Sung MK, Chuang R, Jaehnig EJ, Bodenmiller B, Licon K, Copeland W, Shales M, et al. Rewiring of genetic networks in response to DNA damage. Science. 2010;330:1385–1389. doi: 10.1126/science.1195618. [DOI] [PMC free article] [PubMed] [Google Scholar]
- Baranzini SE, Galwey NW, Wang J, Khankhanian P, Lindberg R, Pelletier D, Wu W, Uitdehaag BM, Kappos L, Gene MSAC, et al. Pathway and network-based analysis of genome-wide association studies in multiple sclerosis. Hum Mol Genet. 2009;18:2078–2090. doi: 10.1093/hmg/ddp120. [DOI] [PMC free article] [PubMed] [Google Scholar]
- Barretina J, Caponigro G, Stransky N, Venkatesan K, Margolin AA, Kim S, Wilson CJ, Lehar J, Kryukov GV, Sonkin D, et al. The Cancer Cell Line Encyclopedia enables predictive modelling of anticancer drug sensitivity. Nature. 2012;483:603–607. doi: 10.1038/nature11003. [DOI] [PMC free article] [PubMed] [Google Scholar]
- Bassik MC, Kampmann M, Lebbink RJ, Wang S, Hein MY, Poser I, Weibezahn J, Horlbeck MA, Chen S, Mann M, et al. A systematic mammalian genetic interaction map reveals pathways underlying ricin susceptibility. Cell. 2013;152:909–922. doi: 10.1016/j.cell.2013.01.030. [DOI] [PMC free article] [PubMed] [Google Scholar]
- Battle A, Jonikas MC, Walter P, Weissman JS, Koller D. Automated identification of pathways from quantitative genetic interaction data. Molecular systems biology. 2010;6:379. doi: 10.1038/msb.2010.27. [DOI] [PMC free article] [PubMed] [Google Scholar]
- Beltrao P, Cagney G, Krogan NJ. Quantitative genetic interactions reveal biological modularity. Cell. 2010;141:739–745. doi: 10.1016/j.cell.2010.05.019. [DOI] [PMC free article] [PubMed] [Google Scholar]
- Beyer A, Bandyopadhyay S, Ideker T. Integrating physical and genetic maps: from genomes to interaction networks. Nature reviews genetics. 2007;8:699–710. doi: 10.1038/nrg2144. [DOI] [PMC free article] [PubMed] [Google Scholar]
- Bisson N, James DA, Ivosev G, Tate SA, Bonner R, Taylor L, Pawson T. Selected reaction monitoring mass spectrometry reveals the dynamics of signaling through the GRB2 adaptor. Nat Biotechnol. 2011;29:653–658. doi: 10.1038/nbt.1905. [DOI] [PubMed] [Google Scholar]
- Braberg H, Jin H, Moehle EA, Chan YA, Wang S, Shales M, Benschop JJ, Morris JH, Qiu C, Hu F, et al. From structure to systems: high-resolution, quantitative genetic analysis of RNA polymerase II. Cell. 2013;154:775–788. doi: 10.1016/j.cell.2013.07.033. [DOI] [PMC free article] [PubMed] [Google Scholar]
- Califano A, Butte AJ, Friend S, Ideker T, Schadt E. Leveraging models of cell regulation and GWAS data in integrative network-based association studies. Nature genetics. 2012;44:841–847. doi: 10.1038/ng.2355. [DOI] [PMC free article] [PubMed] [Google Scholar]
- Cancer Genome Atlas Research Network. Comprehensive genomic characterization defines human glioblastoma genes and core pathways. Nature. 2008;455:1061–1068. doi: 10.1038/nature07385. [DOI] [PMC free article] [PubMed] [Google Scholar]
- Cancer Genome Atlas Research Network. Integrated genomic analyses of ovarian carcinoma. Nature. 2011;474:609–615. doi: 10.1038/nature10166. [DOI] [PMC free article] [PubMed] [Google Scholar]
- Cancer Genome Atlas Research Network. Comprehensive molecular portraits of human breast tumours. Nature. 2012a;490:61–70. doi: 10.1038/nature11412. [DOI] [PMC free article] [PubMed] [Google Scholar]
- Cancer Genome Atlas Research Network. Comprehensive genomic characterization of squamous cell lung cancers. Nature. 2012b;489:519–525. doi: 10.1038/nature11404. [DOI] [PMC free article] [PubMed] [Google Scholar]
- Cancer Genome Atlas Research Network. Comprehensive molecular characterization of human colon and rectal cancer. Nature. 2012c;487:330–337. doi: 10.1038/nature11252. [DOI] [PMC free article] [PubMed] [Google Scholar]
- Cancer Genome Atlas Research Network. Genomic and epigenomic landscapes of adult de novo acute myeloid leukemia. The New England journal of medicine. 2013a;368:2059–2074. doi: 10.1056/NEJMoa1301689. [DOI] [PMC free article] [PubMed] [Google Scholar]
- Cancer Genome Atlas Research Network. The Cancer Genome Atlas Pan-Cancer analysis project. Nature genetics. 2013b;45:1113–1120. doi: 10.1038/ng.2764. [DOI] [PMC free article] [PubMed] [Google Scholar]
- Cancer Genome Atlas Research Network. Comprehensive molecular characterization of gastric adenocarcinoma. Nature. 2014a;513:202–209. doi: 10.1038/nature13480. [DOI] [PMC free article] [PubMed] [Google Scholar]
- Cancer Genome Atlas Research Network. Integrated Genomic Characterization of Papillary Thyroid Carcinoma. Cell. 2014b;159:676–690. doi: 10.1016/j.cell.2014.09.050. [DOI] [PMC free article] [PubMed] [Google Scholar]
- Carro MS, Lim WK, Alvarez MJ, Bollo RJ, Zhao X, Snyder EY, Sulman EP, Anne SL, Doetsch F, Colman H. The transcriptional network for mesenchymal transformation of brain tumours. Nature. 2009;463:318–325. doi: 10.1038/nature08712. [DOI] [PMC free article] [PubMed] [Google Scholar]
- Chang CQ, Yesupriya A, Rowell JL, Pimentel CB, Clyne M, Gwinn M, Khoury MJ, Wulf A, Schully SD. A systematic review of cancer GWAS and candidate gene meta-analyses reveals limited overlap but similar effect sizes. European journal of human genetics: EJHG. 2014;22:402–408. doi: 10.1038/ejhg.2013.161. [DOI] [PMC free article] [PubMed] [Google Scholar]
- Chuang HY, Lee E, Liu YT, Lee D, Ideker T. Network-based classification of breast cancer metastasis. Molecular systems biology. 2007;3:140. doi: 10.1038/msb4100180. [DOI] [PMC free article] [PubMed] [Google Scholar]
- Chuang HY, Rassenti L, Salcedo M, Licon K, Kohlmann A, Haferlach T, Foa R, Ideker T, Kipps TJ. Subnetwork-based analysis of chronic lymphocytic leukemia identifies pathways that associate with disease progression. Blood. 2012;120:2639–2649. doi: 10.1182/blood-2012-03-416461. [DOI] [PMC free article] [PubMed] [Google Scholar]
- Ciriello G, Cerami E, Sander C, Schultz N. Mutual exclusivity analysis identifies oncogenic network modules. Genome Res. 2012;22:398–406. doi: 10.1101/gr.125567.111. [DOI] [PMC free article] [PubMed] [Google Scholar]
- Collins SR, Miller KM, Maas NL, Roguev A, Fillingham J, Chu CS, Schuldiner M, Gebbia M, Recht J, Shales M, et al. Functional dissection of protein complexes involved in yeast chromosome biology using a genetic interaction map. Nature. 2007;446:806–810. doi: 10.1038/nature05649. [DOI] [PubMed] [Google Scholar]
- Corcoran RB, Cheng KA, Hata AN, Faber AC, Ebi H, Coffee EM, Greninger P, Brown RD, Godfrey JT, Cohoon TJ, et al. Synthetic lethal interaction of combined BCL-XL and MEK inhibition promotes tumor regressions in KRAS mutant cancer models. Cancer cell. 2013;23:121–128. doi: 10.1016/j.ccr.2012.11.007. [DOI] [PMC free article] [PubMed] [Google Scholar]
- Davis ZH, Verschueren E, Jang GM, Kleffman K, Johnson JR, Park J, Von Dollen J, Maher MC, Johnson T, Newton W, et al. Global mapping of herpesvirus-host protein complexes reveals a transcription strategy for late genes. Molecular cell. 2015;57:349–360. doi: 10.1016/j.molcel.2014.11.026. [DOI] [PMC free article] [PubMed] [Google Scholar]
- Ding L, Getz G, Wheeler DA, Mardis ER, McLellan MD, Cibulskis K, Sougnez C, Greulich H, Muzny DM, Morgan MB, et al. Somatic mutations affect key pathways in lung adenocarcinoma. Nature. 2008;455:1069–1075. doi: 10.1038/nature07423. [DOI] [PMC free article] [PubMed] [Google Scholar]
- Doudna JA, Charpentier E. Genome editing. The new frontier of genome engineering with CRISPR-Cas9. Science. 2014;346:1258096. doi: 10.1126/science.1258096. [DOI] [PubMed] [Google Scholar]
- Dutkowski J, Ideker T. Protein networks as logic functions in development and cancer. PLoS computational biology. 2011;7:e1002180. doi: 10.1371/journal.pcbi.1002180. [DOI] [PMC free article] [PubMed] [Google Scholar]
- Fehringer G, Liu G, Briollais L, Brennan P, Amos CI, Spitz MR, Bickeboller H, Wichmann HE, Risch A, Hung RJ. Comparison of pathway analysis approaches using lung cancer GWAS data sets. PloS one. 2012;7:e31816. doi: 10.1371/journal.pone.0031816. [DOI] [PMC free article] [PubMed] [Google Scholar]
- Fischer B, Sandmann T, Horn T, Billmann M, Chaudhary V, Huber W, Boutros M. A map of directional genetic interactions in a metazoan cell. eLife. 2015;4 doi: 10.7554/eLife.05464. [DOI] [PMC free article] [PubMed] [Google Scholar]
- Fisher R, Pusztai L, Swanton C. Cancer heterogeneity: implications for targeted therapeutics. British journal of cancer. 2013;108:479–485. doi: 10.1038/bjc.2012.581. [DOI] [PMC free article] [PubMed] [Google Scholar]
- Flaherty KT, Puzanov I, Kim KB, Ribas A, McArthur GA, Sosman JA, O’Dwyer PJ, Lee RJ, Grippo JF, Nolop K, et al. Inhibition of mutated, activated BRAF in metastatic melanoma. The New England journal of medicine. 2010;363:809–819. doi: 10.1056/NEJMoa1002011. [DOI] [PMC free article] [PubMed] [Google Scholar]
- Forbes SA, Beare D, Gunasekaran P, Leung K, Bindal N, Boutselakis H, Ding M, Bamford S, Cole C, Ward S, et al. COSMIC: exploring the world’s knowledge of somatic mutations in human cancer. Nucleic acids research. 2014 doi: 10.1093/nar/gku1075. [DOI] [PMC free article] [PubMed] [Google Scholar]
- Gao F, Foat BC, Bussemaker HJ. Defining transcriptional networks through integrative modeling of mRNA expression and transcription factor binding data. BMC bioinformatics. 2004;5:31. doi: 10.1186/1471-2105-5-31. [DOI] [PMC free article] [PubMed] [Google Scholar]
- Gerlinger M, Rowan AJ, Horswell S, Larkin J, Endesfelder D, Gronroos E, Martinez P, Matthews N, Stewart A, Tarpey P, et al. Intratumor heterogeneity and branched evolution revealed by multiregion sequencing. The New England journal of medicine. 2012;366:883–892. doi: 10.1056/NEJMoa1113205. [DOI] [PMC free article] [PubMed] [Google Scholar]
- Giordano TJ The Cancer Genome Atlas Research Network. Integrated Genomic Characterization of Papillary Thyroid Carcinoma. Cell. 2014;159:676–690. doi: 10.1016/j.cell.2014.09.050. [DOI] [PMC free article] [PubMed] [Google Scholar]
- Girotti MR, Lopes F, Preece N, Niculescu-Duvaz D, Zambon A, Davies L, Whittaker S, Saturno G, Viros A, Pedersen M, et al. Paradox-breaking RAF inhibitors that also target SRC are effective in drug-resistant BRAF mutant melanoma. Cancer cell. 2015;27:85–96. doi: 10.1016/j.ccell.2014.11.006. [DOI] [PMC free article] [PubMed] [Google Scholar]
- Goldstein DB. Common genetic variation and human traits. The New England journal of medicine. 2009;360:1696–1698. doi: 10.1056/NEJMp0806284. [DOI] [PubMed] [Google Scholar]
- Griffith M, Griffith OL, Coffman AC, Weible JV, McMichael JF, Spies NC, Koval J, Das I, Callaway MB, Eldred JM, et al. DGIdb: mining the druggable genome. Nature methods. 2013;10:1209–1210. doi: 10.1038/nmeth.2689. [DOI] [PMC free article] [PubMed] [Google Scholar]
- Gross AM, Orosco RK, Shen JP, Egloff AM, Carter H, Hofree M, Choueiri M, Coffey CS, Lippman SM, Hayes DN. Multi-tiered genomic analysis of head and neck cancer ties TP53 mutation to 3p loss. Nature genetics. 2014;46:939–943. doi: 10.1038/ng.3051. [DOI] [PMC free article] [PubMed] [Google Scholar]
- Hanahan D, Weinberg RA. The hallmarks of cancer. Cell. 2000;100:57–70. doi: 10.1016/s0092-8674(00)81683-9. [DOI] [PubMed] [Google Scholar]
- Hanahan D, Weinberg RA. Hallmarks of cancer: the next generation. Cell. 2011;144:646–674. doi: 10.1016/j.cell.2011.02.013. [DOI] [PubMed] [Google Scholar]
- Hannum G, Srivas R, Guenole A, van Attikum H, Krogan NJ, Karp RM, Ideker T. Genome-wide association data reveal a global map of genetic interactions among protein complexes. PLoS genetics. 2009;5:e1000782. doi: 10.1371/journal.pgen.1000782. [DOI] [PMC free article] [PubMed] [Google Scholar]
- Hofree M, Shen JP, Carter H, Gross A, Ideker T. Network-based stratification of tumor mutations. Nature methods. 2013;10:1108–1115. doi: 10.1038/nmeth.2651. [DOI] [PMC free article] [PubMed] [Google Scholar]
- Hudson TJ, Anderson W, Aretz A, Barker AD, Bell C, Bernabé RR, Bhan M, Calvo F, Eerola I, Gerhard DS. International network of cancer genome projects. Nature. 2010;464:993–998. doi: 10.1038/nature08987. [DOI] [PMC free article] [PubMed] [Google Scholar]
- Ideker T, Dutkowski J, Hood L. Boosting signal-to-noise in complex biology: prior knowledge is power. Cell. 2011;144:860–863. doi: 10.1016/j.cell.2011.03.007. [DOI] [PMC free article] [PubMed] [Google Scholar]
- Ideker T, Krogan NJ. Differential network biology. Molecular systems biology. 2012;8:565. doi: 10.1038/msb.2011.99. [DOI] [PMC free article] [PubMed] [Google Scholar]
- International Cancer Genome Cancer Research Network. Hudson TJ, Anderson W, Artez A, Barker AD, Bell C, Bernabe RR, Bhan MK, Calvo F, Eerola I, et al. International network of cancer genome projects. Nature. 2010;464:993–998. doi: 10.1038/nature08987. [DOI] [PMC free article] [PubMed] [Google Scholar]
- International H.I.V. Consortium. Pereyra F, Jia X, McLaren PJ, Telenti A, de Bakker PI, Walker BD, Ripke S, Brumme CJ, Pulit SL, et al. The major genetic determinants of HIV-1 control affect HLA class I peptide presentation. Science. 2010;330:1551–1557. doi: 10.1126/science.1195271. [DOI] [PMC free article] [PubMed] [Google Scholar]
- International Multiple Sclerosis Genetics Consortium. Network-based multiple sclerosis pathway analysis with GWAS data from 15,000 cases and 30,000 controls. Am J Hum Genet. 2013;92:854–865. doi: 10.1016/j.ajhg.2013.04.019. [DOI] [PMC free article] [PubMed] [Google Scholar]
- Jager S, Cimermancic P, Gulbahce N, Johnson JR, McGovern KE, Clarke SC, Shales M, Mercenne G, Pache L, Li K, et al. Global landscape of HIV-human protein complexes. Nature. 2012a;481:365–370. doi: 10.1038/nature10719. [DOI] [PMC free article] [PubMed] [Google Scholar]
- Jager S, Kim DY, Hultquist JF, Shindo K, LaRue RS, Kwon E, Li M, Anderson BD, Yen L, Stanley D, et al. Vif hijacks CBF-beta to degrade APOBEC3G and promote HIV-1 infection. Nature. 2012b;481:371–375. doi: 10.1038/nature10693. [DOI] [PMC free article] [PubMed] [Google Scholar]
- Jerby-Arnon L, Pfetzer N, Waldman YY, McGarry L, James D, Shanks E, Seashore-Ludlow B, Weinstock A, Geiger T, Clemons PA. Predicting cancer-specific vulnerability via data-driven detection of synthetic lethality. Cell. 2014;158:1199–1209. doi: 10.1016/j.cell.2014.07.027. [DOI] [PubMed] [Google Scholar]
- Jia P, Zheng S, Long J, Zheng W, Zhao Z. dmGWAS: dense module searching for genome-wide association studies in protein-protein interaction networks. Bioinformatics. 2011;27:95–102. doi: 10.1093/bioinformatics/btq615. [DOI] [PMC free article] [PubMed] [Google Scholar]
- Jones DT, Jager N, Kool M, Zichner T, Hutter B, Sultan M, Cho YJ, Pugh TJ, Hovestadt V, Stutz AM, et al. Dissecting the genomic complexity underlying medulloblastoma. Nature. 2012;488:100–105. doi: 10.1038/nature11284. [DOI] [PMC free article] [PubMed] [Google Scholar]
- Kelley R, Ideker T. Systematic interpretation of genetic interactions using protein networks. Nat Biotechnol. 2005;23:561–566. doi: 10.1038/nbt1096. [DOI] [PMC free article] [PubMed] [Google Scholar]
- Koster R, Mitra N, D’Andrea K, Vardhanabhuti S, Chung CC, Wang Z, Loren Erickson R, Vaughn DJ, Litchfield K, Rahman N, et al. Pathway-based analysis of GWAs data identifies association of sex determination genes with susceptibility to testicular germ cell tumors. Human molecular genetics. 2014;23:6061–6068. doi: 10.1093/hmg/ddu305. [DOI] [PMC free article] [PubMed] [Google Scholar]
- Kuchenbaecker KB, Ramus SJ, Tyrer J, Lee A, Shen HC, Beesley J, Lawrenson K, McGuffog L, Healey S, Lee JM, et al. Identification of six new susceptibility loci for invasive epithelial ovarian cancer. Nature genetics. 2015 doi: 10.1038/ng.3185. [DOI] [PMC free article] [PubMed] [Google Scholar]
- Lander ES, Linton LM, Birren B, Nusbaum C, Zody MC, Baldwin J, Devon K, Dewar K, Doyle M, FitzHugh W. Initial sequencing and analysis of the human genome. Nature. 2001;409:860–921. doi: 10.1038/35057062. [DOI] [PubMed] [Google Scholar]
- Laufer C, Fischer B, Billmann M, Huber W, Boutros M. Mapping genetic interactions in human cancer cells with RNAi and multiparametric phenotyping. Nature methods. 2013;10:427–431. doi: 10.1038/nmeth.2436. [DOI] [PubMed] [Google Scholar]
- Lawrence MS, Stojanov P, Mermel CH, Robinson JT, Garraway LA, Golub TR, Meyerson M, Gabriel SB, Lander ES, Getz G. Discovery and saturation analysis of cancer genes across 21 tumour types. Nature. 2014;505:495–501. doi: 10.1038/nature12912. [DOI] [PMC free article] [PubMed] [Google Scholar]
- Lawrence MS, Stojanov P, Polak P, Kryukov GV, Cibulskis K, Sivachenko A, Carter SL, Stewart C, Mermel CH, Roberts SA. Mutational heterogeneity in cancer and the search for new cancer-associated genes. Nature. 2013;499:214–218. doi: 10.1038/nature12213. [DOI] [PMC free article] [PubMed] [Google Scholar]
- Lee I, Blom UM, Wang PI, Shim JE, Marcotte EM. Prioritizing candidate disease genes by network-based boosting of genome-wide association data. Genome research. 2011;21:1109–1121. doi: 10.1101/gr.118992.110. [DOI] [PMC free article] [PubMed] [Google Scholar]
- Leiserson MD, Vandin F, Wu H, Dobson JR, Eldridge JV, Thomas JL, Papoutsaki A, Kim Y, Niu B, McLellan M, et al. Pan-cancer network analysis identifies combinations of rare somatic mutations across pathways and protein complexes. Nature genetics. 2014 doi: 10.1038/ng.3168. [DOI] [PMC free article] [PubMed] [Google Scholar]
- Levrero M. Viral hepatitis and liver cancer: the case of hepatitis C. Oncogene. 2006;25:3834–3847. doi: 10.1038/sj.onc.1209562. [DOI] [PubMed] [Google Scholar]
- Li X, Mooney P, Zheng S, Booth CR, Braunfeld MB, Gubbens S, Agard DA, Cheng Y. Electron counting and beam-induced motion correction enable near-atomic-resolution single-particle cryo-EM. Nature methods. 2013;10:584–590. doi: 10.1038/nmeth.2472. [DOI] [PMC free article] [PubMed] [Google Scholar]
- Long GV, Stroyakovskiy D, Gogas H, Levchenko E, de Braud F, Larkin J, Garbe C, Jouary T, Hauschild A, Grob JJ, et al. Combined BRAF and MEK inhibition versus BRAF inhibition alone in melanoma. The New England journal of medicine. 2014;371:1877–1888. doi: 10.1056/NEJMoa1406037. [DOI] [PubMed] [Google Scholar]
- Longo DL. Tumor heterogeneity and personalized medicine. The New England journal of medicine. 2012;366:956–957. doi: 10.1056/NEJMe1200656. [DOI] [PubMed] [Google Scholar]
- Maher B. Personal genomes: The case of the missing heritability. Nature. 2008;456:18–21. doi: 10.1038/456018a. [DOI] [PubMed] [Google Scholar]
- Manolio TA, Collins FS, Cox NJ, Goldstein DB, Hindorff LA, Hunter DJ, McCarthy MI, Ramos EM, Cardon LR, Chakravarti A, et al. Finding the missing heritability of complex diseases. Nature. 2009;461:747–753. doi: 10.1038/nature08494. [DOI] [PMC free article] [PubMed] [Google Scholar]
- Mardis ER. The translation of cancer genomics: time for a revolution in clinical cancer care. Genome medicine. 2014;6:22. doi: 10.1186/gm539. [DOI] [PMC free article] [PubMed] [Google Scholar]
- Marur S, D’Souza G, Westra WH, Forastiere AA. HPV-associated head and neck cancer: a virus-related cancer epidemic. The Lancet Oncology. 2010;11:781–789. doi: 10.1016/S1470-2045(10)70017-6. [DOI] [PMC free article] [PubMed] [Google Scholar]
- Morrison C, Smith GC, Stingl L, Jackson SP, Wagner EF, Wang ZQ. Genetic interaction between PARP and DNA-PK in V (D) J recombination and tumorigenesis. Nature genetics. 1997;17:479–482. doi: 10.1038/ng1297-479. [DOI] [PubMed] [Google Scholar]
- Munoz N, Castellsague X, de Gonzalez AB, Gissmann L. Chapter 1: HPV in the etiology of human cancer. Vaccine. 2006;24(Suppl 3):S3/1–10. doi: 10.1016/j.vaccine.2006.05.115. [DOI] [PubMed] [Google Scholar]
- Nijhawan D, Zack TI, Ren Y, Strickland MR, Lamothe R, Schumacher SE, Tsherniak A, Besche HC, Rosenbluh J, Shehata S. Cancer vulnerabilities unveiled by genomic loss. Cell. 2012;150:842–854. doi: 10.1016/j.cell.2012.07.023. [DOI] [PMC free article] [PubMed] [Google Scholar]
- Nijman SM, Friend SH. Potential of the synthetic lethality principle. Science. 2013;342:809–811. doi: 10.1126/science.1244669. [DOI] [PubMed] [Google Scholar]
- Novarino G, Fenstermaker AG, Zaki MS, Hofree M, Silhavy JL, Heiberg AD, Abdellateef M, Rosti B, Scott E, Mansour L, et al. Exome sequencing links corticospinal motor neuron disease to common neurodegenerative disorders. Science. 2014;343:506–511. doi: 10.1126/science.1247363. [DOI] [PMC free article] [PubMed] [Google Scholar]
- O’Roak BJ, Vives L, Girirajan S, Karakoc E, Krumm N, Coe BP, Levy R, Ko A, Lee C, Smith JD, et al. Sporadic autism exomes reveal a highly interconnected protein network of de novo mutations. Nature. 2012;485:246–250. doi: 10.1038/nature10989. [DOI] [PMC free article] [PubMed] [Google Scholar]
- Parikshak NN, Luo R, Zhang A, Won H, Lowe JK, Chandran V, Horvath S, Geschwind DH. Integrative functional genomic analyses implicate specific molecular pathways and circuits in autism. Cell. 2013;155:1008–1021. doi: 10.1016/j.cell.2013.10.031. [DOI] [PMC free article] [PubMed] [Google Scholar]
- Perry JA, Kiezun A, Tonzi P, Van Allen EM, Carter SL, Baca SC, Cowley GS, Bhatt AS, Rheinbay E, Pedamallu CS, et al. Complementary genomic approaches highlight the PI3K/mTOR pathway as a common vulnerability in osteosarcoma. Proceedings of the National Academy of Sciences of the United States of America. 2014;111:E5564–5573. doi: 10.1073/pnas.1419260111. [DOI] [PMC free article] [PubMed] [Google Scholar]
- Pharoah PD, Tsai YY, Ramus SJ, Phelan CM, Goode EL, Lawrenson K, Buckley M, Fridley BL, Tyrer JP, Shen H. GWAS meta-analysis and replication identifies three new susceptibility loci for ovarian cancer. Nature genetics. 2013;45:362–370. doi: 10.1038/ng.2564. [DOI] [PMC free article] [PubMed] [Google Scholar]
- Pujana MA, Han JDJ, Starita LM, Stevens KN, Tewari M, Ahn JS, Rennert G, Moreno V, Kirchhoff T, Gold B. Network modeling links breast cancer susceptibility and centrosome dysfunction. Nature genetics. 2007;39:1338–1349. doi: 10.1038/ng.2007.2. [DOI] [PubMed] [Google Scholar]
- Ramage HR, Kumar GR, Verschueren E, Johnson JR, Von Dollen J, Johnson T, Newton B, Shah P, Horner J, Krogan NJ, et al. A combined proteomics/genomics approach links hepatitis C virus infection with nonsense-mediated mRNA decay. Molecular cell. 2015;57:329–340. doi: 10.1016/j.molcel.2014.12.028. [DOI] [PMC free article] [PubMed] [Google Scholar]
- Roguev A, Bandyopadhyay S, Zofall M, Zhang K, Fischer T, Collins SR, Qu H, Shales M, Park HO, Hayles J, et al. Conservation and rewiring of functional modules revealed by an epistasis map in fission yeast. Science. 2008;322:405–410. doi: 10.1126/science.1162609. [DOI] [PMC free article] [PubMed] [Google Scholar]
- Roguev A, Talbot D, Negri GL, Shales M, Cagney G, Bandyopadhyay S, Panning B, Krogan NJ. Quantitative genetic-interaction mapping in mammalian cells. Nature methods. 2013;10:432–437. doi: 10.1038/nmeth.2398. [DOI] [PMC free article] [PubMed] [Google Scholar]
- Sahni N, Yi S, Taipale M, Fuxman Bass JI, Coulombe-Huntington J, Yang F, Peng J, Weile J, Karras GI, Wang Y, et al. Widespread Macromolecular Interaction Perturbations in Human Genetic Disorders. Cell. 2015;161:647–660. doi: 10.1016/j.cell.2015.04.013. [DOI] [PMC free article] [PubMed] [Google Scholar]
- Sahni N, Yi S, Zhong Q, Jailkhani N, Charloteaux B, Cusick ME, Vidal M. Edgotype: a fundamental link between genotype and phenotype. Current opinion in genetics & development. 2013;23:649–657. doi: 10.1016/j.gde.2013.11.002. [DOI] [PMC free article] [PubMed] [Google Scholar]
- Scholl C, Frohling S, Dunn IF, Schinzel AC, Barbie DA, Kim SY, Silver SJ, Tamayo P, Wadlow RC, Ramaswamy S, et al. Synthetic lethal interaction between oncogenic KRAS dependency and STK33 suppression in human cancer cells. Cell. 2009;137:821–834. doi: 10.1016/j.cell.2009.03.017. [DOI] [PubMed] [Google Scholar]
- Schuldiner M, Collins SR, Thompson NJ, Denic V, Bhamidipati A, Punna T, Ihmels J, Andrews B, Boone C, Greenblatt JF, et al. Exploration of the function and organization of the yeast early secretory pathway through an epistatic miniarray profile. Cell. 2005;123:507–519. doi: 10.1016/j.cell.2005.08.031. [DOI] [PubMed] [Google Scholar]
- Shen PS, Park J, Qin Y, Li X, Parsawar K, Larson MH, Cox J, Cheng Y, Lambowitz AM, Weissman JS, et al. Protein synthesis. Rqc2p and 60S ribosomal subunits mediate mRNA-independent elongation of nascent chains. Science. 2015;347:75–78. doi: 10.1126/science.1259724. [DOI] [PMC free article] [PubMed] [Google Scholar]
- St Onge RP, Mani R, Oh J, Proctor M, Fung E, Davis RW, Nislow C, Roth FP, Giaever G. Systematic pathway analysis using high-resolution fitness profiling of combinatorial gene deletions. Nature genetics. 2007;39:199–206. doi: 10.1038/ng1948. [DOI] [PMC free article] [PubMed] [Google Scholar]
- Tang H, Wei P, Duell EJ, Risch HA, Olson SH, Bueno-de-Mesquita HB, Gallinger S, Holly EA, Petersen G, Bracci PM, et al. Axonal guidance signaling pathway interacting with smoking in modifying the risk of pancreatic cancer: a gene- and pathway-based interaction analysis of GWAS data. Carcinogenesis. 2014;35:1039–1045. doi: 10.1093/carcin/bgu010. [DOI] [PMC free article] [PubMed] [Google Scholar]
- Taylor IW, Linding R, Warde-Farley D, Liu Y, Pesquita C, Faria D, Bull S, Pawson T, Morris Q, Wrana JL. Dynamic modularity in protein interaction networks predicts breast cancer outcome. Nat Biotechnol. 2009;27:199–204. doi: 10.1038/nbt.1522. [DOI] [PubMed] [Google Scholar]
- Teslovich TM, Musunuru K, Smith AV, Edmondson AC, Stylianou IM, Koseki M, Pirruccello JP, Ripatti S, Chasman DI, Willer CJ, et al. Biological, clinical and population relevance of 95 loci for blood lipids. Nature. 2010;466:707–713. doi: 10.1038/nature09270. [DOI] [PMC free article] [PubMed] [Google Scholar]
- Turnbull C, Ahmed S, Morrison J, Pernet D, Renwick A, Maranian M, Seal S, Ghoussaini M, Hines S, Healey CS. Genome-wide association study identifies five new breast cancer susceptibility loci. Nature genetics. 2010;42:504–507. doi: 10.1038/ng.586. [DOI] [PMC free article] [PubMed] [Google Scholar]
- Vaske CJ, Benz SC, Sanborn JZ, Earl D, Szeto C, Zhu J, Haussler D, Stuart JM. Inference of patient-specific pathway activities from multi-dimensional cancer genomics data using PARADIGM. Bioinformatics. 2010;26:i237–i245. doi: 10.1093/bioinformatics/btq182. [DOI] [PMC free article] [PubMed] [Google Scholar]
- Venter JC, Adams MD, Myers EW, Li PW, Mural RJ, Sutton GG, Smith HO, Yandell M, Evans CA, Holt RA. The sequence of the human genome. Science. 2001;291:1304–1351. doi: 10.1126/science.1058040. [DOI] [PubMed] [Google Scholar]
- Verhaak RG, Hoadley KA, Purdom E, Wang V, Qi Y, Wilkerson MD, Miller CR, Ding L, Golub T, Mesirov JP, et al. Integrated genomic analysis identifies clinically relevant subtypes of glioblastoma characterized by abnormalities in PDGFRA, IDH1, EGFR, and NF1. Cancer cell. 2010;17:98–110. doi: 10.1016/j.ccr.2009.12.020. [DOI] [PMC free article] [PubMed] [Google Scholar]
- Vijai J, Wang Z, Berndt SI, Skibola CF, Slager SL, de Sanjose S, Melbye M, Glimelius B, Bracci PM, Conde L. A genome-wide association study of marginal zone lymphoma shows association to the HLA region. Nature communications. 2015;6 doi: 10.1038/ncomms6751. [DOI] [PMC free article] [PubMed] [Google Scholar]
- Visscher PM, Brown MA, McCarthy MI, Yang J. Five years of GWAS discovery. Am J Hum Genet. 2012;90:7–24. doi: 10.1016/j.ajhg.2011.11.029. [DOI] [PMC free article] [PubMed] [Google Scholar]
- Vizeacoumar FJ, Arnold R, Vizeacoumar FS, Chandrashekhar M, Buzina A, Young JT, Kwan JH, Sayad A, Mero P, Lawo S, et al. A negative genetic interaction map in isogenic cancer cell lines reveals cancer cell vulnerabilities. Molecular systems biology. 2013;9:696. doi: 10.1038/msb.2013.54. [DOI] [PMC free article] [PubMed] [Google Scholar]
- Vogelstein B, Kinzler KW. Cancer genes and the pathways they control. Nat Med. 2004;10:789–799. doi: 10.1038/nm1087. [DOI] [PubMed] [Google Scholar]
- Wang K, Li M, Hakonarson H. Analysing biological pathways in genome-wide association studies. Nature Reviews Genetics. 2010;11:843–854. doi: 10.1038/nrg2884. [DOI] [PubMed] [Google Scholar]
- Watson IR, Takahashi K, Futreal PA, Chin L. Emerging patterns of somatic mutations in cancer. Nature reviews Genetics. 2013;14:703–718. doi: 10.1038/nrg3539. [DOI] [PMC free article] [PubMed] [Google Scholar]
- Welter D, MacArthur J, Morales J, Burdett T, Hall P, Junkins H, Klemm A, Flicek P, Manolio T, Hindorff L, et al. The NHGRI GWAS Catalog, a curated resource of SNP-trait associations. Nucleic acids research. 2014;42:D1001–1006. doi: 10.1093/nar/gkt1229. [DOI] [PMC free article] [PubMed] [Google Scholar]
- Wilks C, Cline MS, Weiler E, Diehkans M, Craft B, Martin C, Murphy D, Pierce H, Black J, Nelson D, et al. The Cancer Genomics Hub (CGHub): overcoming cancer through the power of torrential data. Database: the journal of biological databases and curation. 2014;2014 doi: 10.1093/database/bau093. [DOI] [PMC free article] [PubMed] [Google Scholar]
- Willsey AJ, Sanders SJ, Li M, Dong S, Tebbenkamp AT, Muhle RA, Reilly SK, Lin L, Fertuzinhos S, Miller JA, et al. Coexpression networks implicate human midfetal deep cortical projection neurons in the pathogenesis of autism. Cell. 2013;155:997–1007. doi: 10.1016/j.cell.2013.10.020. [DOI] [PMC free article] [PubMed] [Google Scholar]
- Yaffe MB. The scientific drunk and the lamppost: massive sequencing efforts in cancer discovery and treatment. Science signaling. 2013;6:pe13. doi: 10.1126/scisignal.2003684. [DOI] [PubMed] [Google Scholar]
- Yamanaka S. A fresh look at iPS cells. Cell. 2009;137:13–17. doi: 10.1016/j.cell.2009.03.034. [DOI] [PubMed] [Google Scholar]
- Yang W, Soares J, Greninger P, Edelman EJ, Lightfoot H, Forbes S, Bindal N, Beare D, Smith JA, Thompson IR, et al. Genomics of Drug Sensitivity in Cancer (GDSC): a resource for therapeutic biomarker discovery in cancer cells. Nucleic acids research. 2013;41:D955–961. doi: 10.1093/nar/gks1111. [DOI] [PMC free article] [PubMed] [Google Scholar]
- Yeager M, Chatterjee N, Ciampa J, Jacobs KB, Gonzalez-Bosquet J, Hayes RB, Kraft P, Wacholder S, Orr N, Berndt S. Identification of a new prostate cancer susceptibility locus on chromosome 8q24. Nature genetics. 2009;41:1055–1057. doi: 10.1038/ng.444. [DOI] [PMC free article] [PubMed] [Google Scholar]
- Zhang J, Fujimoto J, Zhang J, Wedge DC, Song X, Zhang J, Seth S, Chow CW, Cao Y, Gumbs C, et al. Intratumor heterogeneity in localized lung adenocarcinomas delineated by multiregion sequencing. Science. 2014;346:256–259. doi: 10.1126/science.1256930. [DOI] [PMC free article] [PubMed] [Google Scholar]
- Zhu J, Zhang B, Smith EN, Drees B, Brem RB, Kruglyak L, Bumgarner RE, Schadt EE. Integrating large-scale functional genomic data to dissect the complexity of yeast regulatory networks. Nature genetics. 2008;40:854–861. doi: 10.1038/ng.167. [DOI] [PMC free article] [PubMed] [Google Scholar]
- Zuk O, Hechter E, Sunyaev SR, Lander ES. The mystery of missing heritability: Genetic interactions create phantom heritability. Proceedings of the National Academy of Sciences of the United States of America. 2012;109:1193–1198. doi: 10.1073/pnas.1119675109. [DOI] [PMC free article] [PubMed] [Google Scholar]