G protein-coupled receptors (GPCRs) are essential components of the signalling network throughout the body. To understand the molecular mechanism of G protein-mediated signalling, structures of receptors are necessary in inactive conformations and in the active conformation coupled to a G protein1,2. Here we present the structure of the adenosine A2A receptor (A2AR) bound to an engineered G protein3, mini-Gs, to 3.4 Å resolution. Mini-Gs binds to A2AR through an extensive interface (1048 Å2) that is similar, but not identical, to the interface between the β2-adrenergic receptor (β2AR) and Gs4. The transition of the receptor from an agonist-bound active-intermediate state5,6 to an active G protein-bound state is characterised by a 14 Å shift of the cytoplasmic end of transmembrane helix 6 (H6) away from the receptor core, slight changes in the positions of the cytoplasmic ends of H5 and H7 and rotamer changes of the amino acid side chains Arg3.50, Tyr5.58 and Tyr7.53. There are no significant differences in the extracellular half of the receptor around the ligand binding pocket. The A2AR–mini-Gs structure highlights both the diversity and similarity in G protein coupling to GPCRs7 and hints at the potential complexity of the molecular basis for G protein specificity.
Structures of A2AR bound to either inverse agonists8–10 or agonists5,6,11 have elucidated the molecular determinants of subtype specificity and ligand efficacy12. However, the mechanism of activation of the receptor to allow G protein coupling and the basis of G protein selectivity is not fully understood. Structures of A2AR in the inactive state have been determined bound either to the antagonists ZM2413858–10, XAC8, caffeine8 or 1,2,4-triazines13, and all the structures are very similar. An intramembrane Na+ ion that can act as an allosteric antagonist was identified in the highest resolution structure (1.8 Å)14, and a homologous Na+ ion has been subsequently identified in other high-resolution structures of GPCRs15–17. Four agonist-bound structures of A2AR have also been determined after co-crystallisation with either adenosine5, NECA5, CGS2168011 or UK4320976. All the structures are very similar and are thought to represent an active-intermediate conformation of the receptor, but not the fully active receptor that binds a G protein5. Observations that support this conclusion include the presence of rotamer changes of conserved amino acid residues associated with activation of other GPCRs18, and the absence of a large-scale movement of the cytoplasmic end of transmembrane helix 6 (H6) away from the receptor core12. The G protein-coupled state of A2AR exhibits higher binding affinity for agonists compared to the uncoupled state19, but it is unclear whether the agonist-bound structures determined so far depict the binding pocket in a high affinity or low affinity conformation. Therefore, in order to elucidate the structure of the activated state of A2AR, we have determined its structure bound to a high-affinity agonist and an engineered G protein.
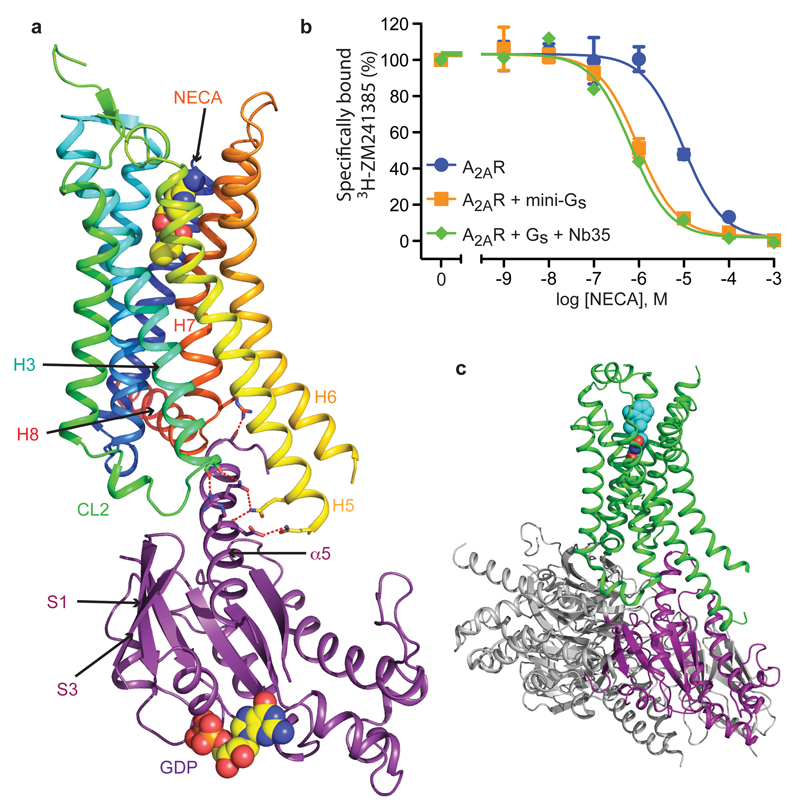
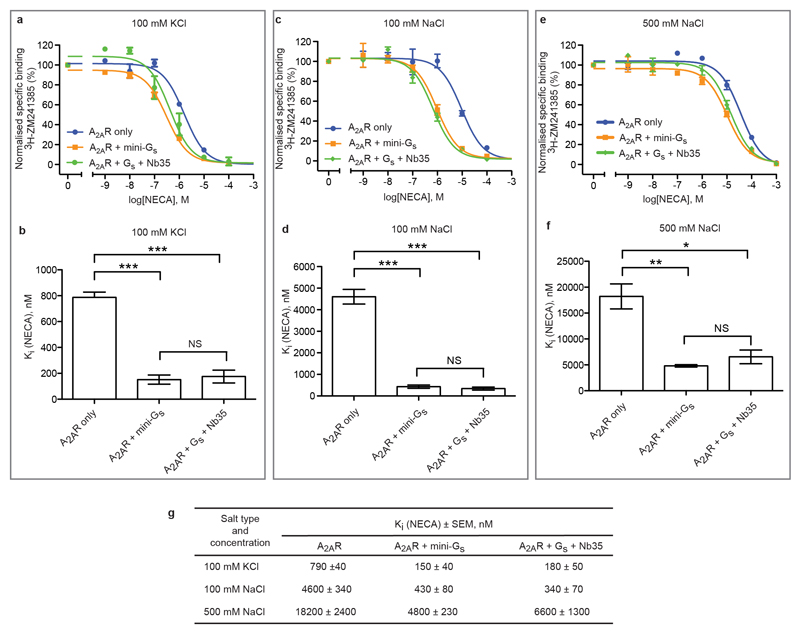
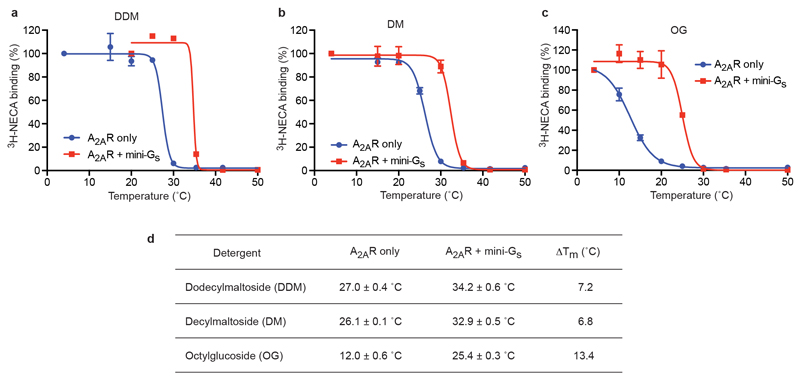
There is a single reported structure of a GPCR bound to a heterotrimeric G protein, namely Gs-bound β2AR4, which showed that virtually all the atomic contacts between the receptor and G protein were formed by the Gα subunit. To facilitate the crystallisation of any GPCR-Gs complex, we developed a minimal G protein, mini-Gs, that comprised a truncated form of the GTPase domain of Gαs and included 8 point mutations to stabilise the protein in the absence of Gβγ and in the presence of detergents3. In addition, 3 truncations removed the switch III region, 25 amino acids from the N-terminus and the α-helical domain . Mini-Gs reproduced the increase in agonist affinity that occurred upon incubation of the receptor in the presence of the heterotrimeric G protein Gs and it also showed identical sensitivity to the presence of the allosteric antagonist Na+ (Fig. 1 and Extended Data Fig. 1). In addition, mini-Gs readily formed a complex with A2AR in the presence of the agonist NECA and the complex was considerably more thermostable, particularly in short chain detergents, than A2AR with only NECA bound (Extended Data Fig. 2). This complex was crystallised in the detergent octylthioglucoside by vapour diffusion, a data set collected from two crystals, the structure determined by molecular replacement (see Online Methods) and refined to 3.4 Å (Extended Data Table 1). Of the two A2AR–mini-Gs complexes per crystallographic asymmetric unit, the density in complex AC was better defined and was therefore used for all subsequent analyses below (see Supplementary Discussion).
Figure 1.
Ligand binding and overall structure of the A2AR–mini-Gs complex. a, The structure of A2AR is depicted as a cartoon in rainbow coloration (N-terminus in blue, C-terminus in red) with mini-Gs in purple. The agonist NECA bound to A2AR and GDP bound to mini-Gs are depicted as space-filling models (carbon, yellow; nitrogen, blue; oxygen, red; phosphorous, orange). Relevant secondary structural features are labelled. b, Mini-Gs increases the affinity of agonist binding to A2AR similar to that observed by a heterotrimeric G protein. Competition binding curves were performed in duplicate (n = 3) by measuring the displacement of the inverse agonist 3H-ZM241385 with increasing concentrations of the agonist NECA (Ki values in parentheses, see Extended Data Fig. 1 for full data): blue circles, A2AR (Ki 4.6 ± 0.3 μM); orange squares, A2AR and mini-Gs (Ki 430 ± 80 nM); green diamonds, A2AR and heterotrimeric G protein with nanobody Nb35 (Ki 340 ± 70 nM). G proteins were all added to membranes containing A2AR to give a final concentration of 25 μM and the final concentration of NaCl was 100 mM (see Methods online). c, The structure of β2AR (green) bound to Gs (grey and purple) is depicted as a cartoon in the same orientation as A2AR in a; the purple region in Gs corresponds to the structure of mini-Gs.
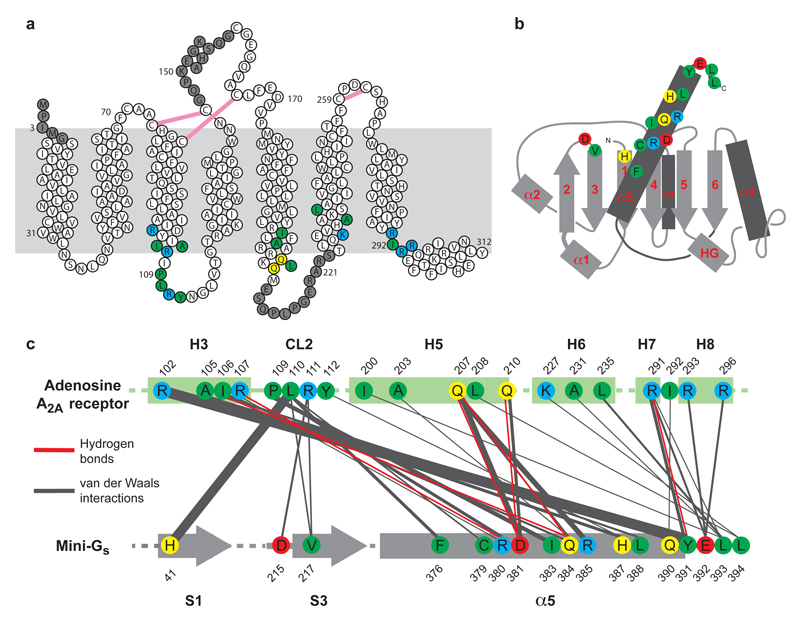
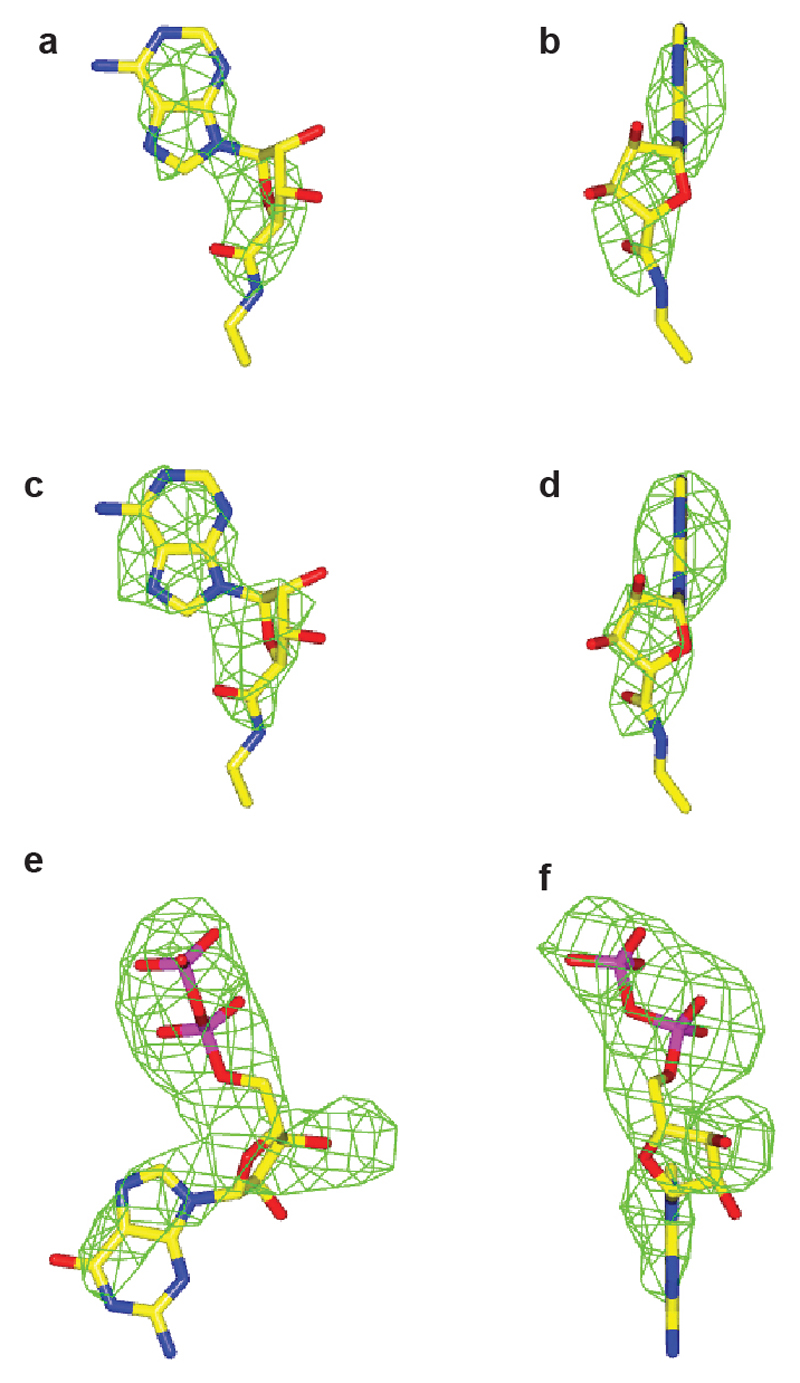
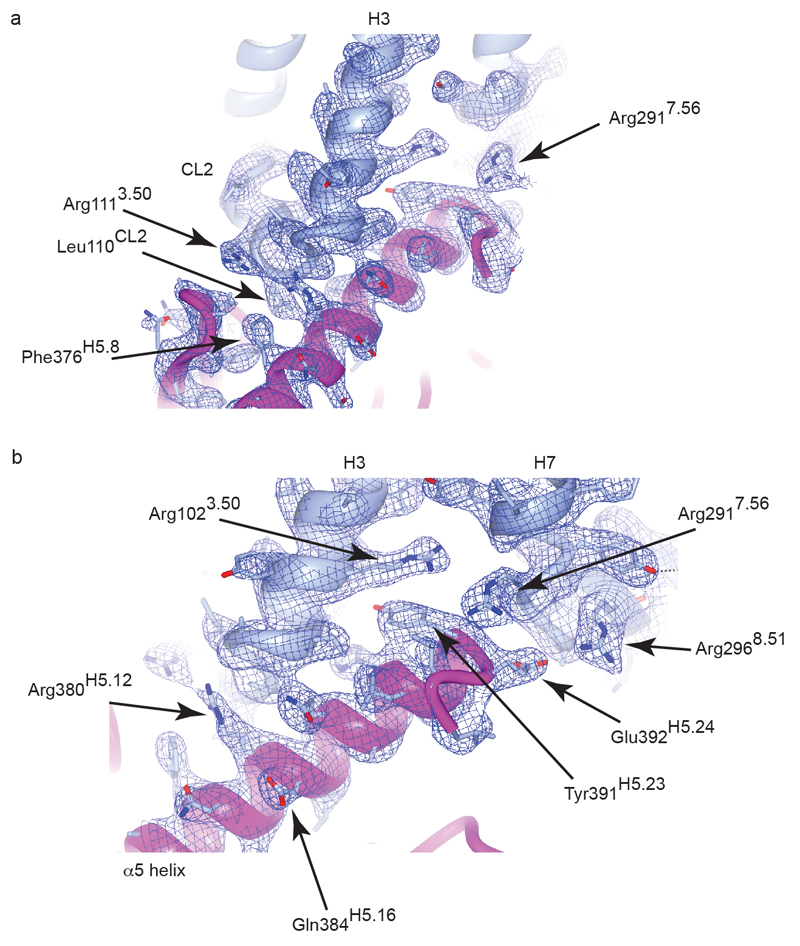
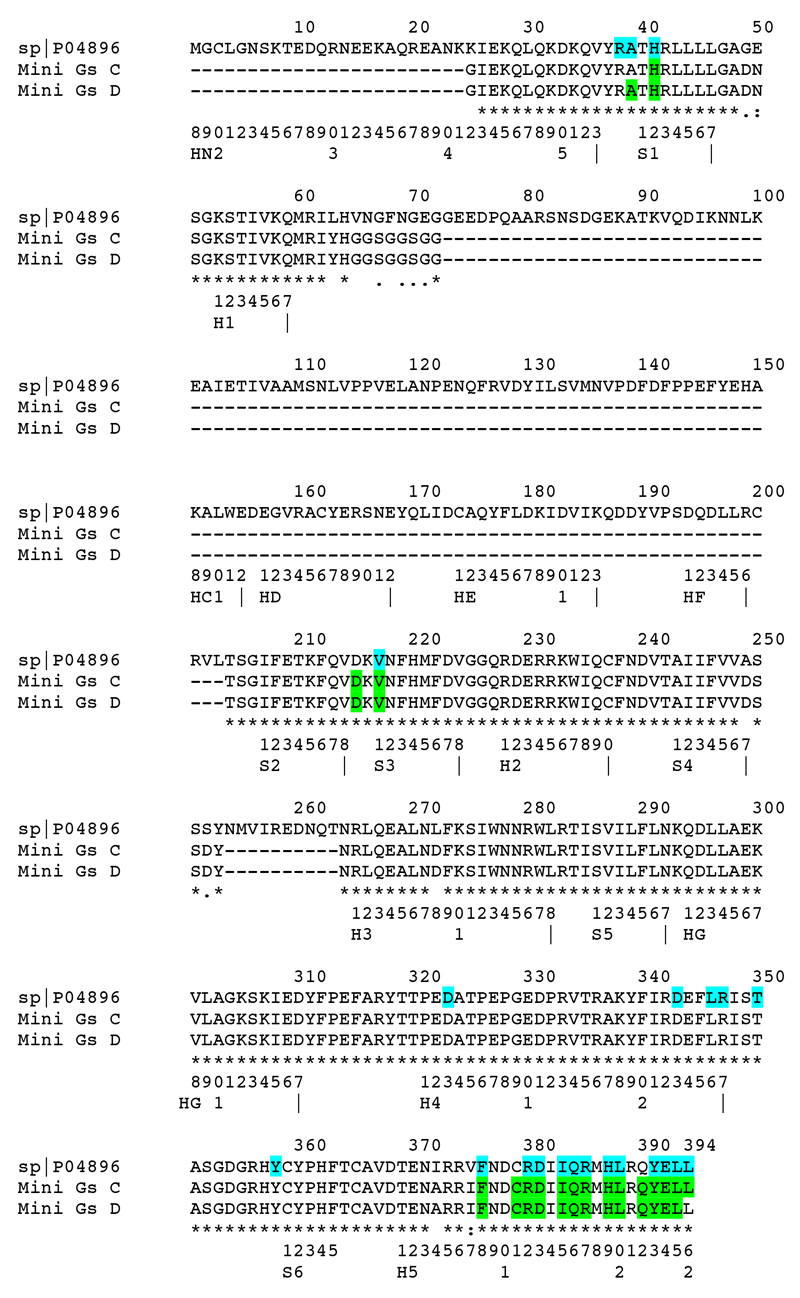
The A2AR–mini-Gs complex contained density for the agonist NECA bound to A2AR and density for a molecule of GDP bound to mini-Gs (Extended Data Fig. 3). The presence of GDP in the mini-Gs structure is a reflection of the properties of the engineered G protein, which, after complex formation, is insensitive to GTPγS-mediated dissociation3. Mini-Gs is in a conformation virtually identical to that observed in the β2AR–Gs structure (see below) and therefore represents an active state of the G protein, consistent with its ability to couple to A2AR and induce high-affinity agonist binding (Fig. 1). The interface between A2AR and mini-Gs is formed between 20 amino acid residues from the receptor and 17 residues in mini-Gs (Fig. 2, Extended Data Figs. 4-6, Supplementary Table 1), comprising a total buried surface area of 1048 Å2 on the receptor. In mini-Gs, contacts are made predominantly by the α5 helix involving 14 amino acid residues that pack against residues in H3, CL2, H5, H6, H7 and H8 of A2AR. Additional interactions include residues in S1, S3, the S2-S3 loop and α5 that form a hydrophobic pocket in which the side chain Leu110 in CL2 of A2AR is sequestered (Extended Data Fig. 7). Amino acid residues in A2AR and mini-Gs form complementary surfaces that pack together predominantly via van der Waals interactions (~90% of contacts) with 6 polar interactions across the interface. Helix α5 protrudes into the cleft within the cytoplasmic face of A2AR created through the outward bending of the cytoplasmic end of H6. The apex of the α5 helix, Tyr391H5.23 (superscript refers to the CGN system for G proteins7) makes extensive van der Waals interactions with Arg1023.50 (superscript refers to the Ballesteros-Weinstein numbering system for GPCRs20) that forms the whole upper surface of the cleft (Fig. 3).
Figure 2.
Packing interactions between A2AR and mini-Gs. a, Diagram of A2AR depicting its secondary structure in the A2AR–mini-Gs structure. Residues shaded in grey are disordered in either chain A and/or chain B. Disulphide bonds are depicted as pink lines. b, Cartoon of the mini-Gs topology. c, Diagram of contacts between mini-Gs and A2AR, with line thickness representing the relative number of interactions between amino acid residues. In all panels, amino acid residues depicted in colour are at the interface between mini-Gs and A2AR (within 3.9 Å), with colours reflecting the properties of the side chain; blue, positively charged; red; negatively charged; green, hydrophobic; yellow, hydrophilic.
Figure 3.
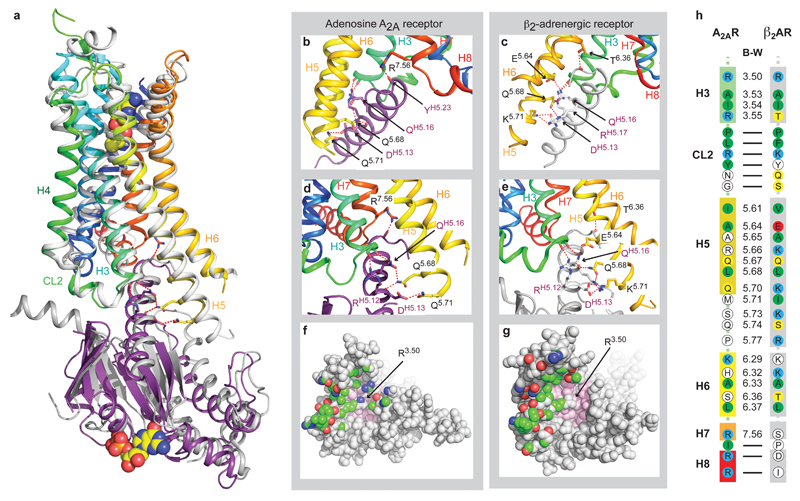
Comparison of the A2AR–mini-Gs and β2AR–Gs complexes. a, Structural alignment of β2AR–Gs (PDB ID: 3SN6)4 and A2AR–mini-Gs was performed by aligning the receptors alone; A2AR, rainbow colouration; β2AR, grey. The resultant relative dispositions of Gαs (dark grey) bound to β2AR and mini-Gs bound to A2AR (purple) are depicted. NECA and GDP are depicted as space-filling models (carbon, yellow; nitrogen, blue; oxygen, red; phosphorous, orange). The α-helical domain of Gαs, Gβγ and Nb35 have all been omitted for clarity. b-e, Detailed comparisons of hydrogen bonds (red dashed lines) between the respective G proteins and receptors; both receptors are in rainbow colouration, with mini-Gs in purple and Gαs in grey. Labelling of amino acid residues shows the Ballesteros-Weinstein (B-W) numbers for the receptors and the CGN notation for G proteins. f and g, Views of the cytoplasmic surface of A2AR and β2AR, respectively, as space-filling models with atoms making contacts with their respective G proteins coloured according to their type; carbon, green; nitrogen, blue; oxygen, red. Atoms coloured pink comprise conserved hydrophobic residues in the core of the receptors against which Arg3.50 packs. h, Comparison of residues making contacts to G proteins in the A2AR–mini-Gs complex and the β2AR–Gs complex. Amino acid residues in the receptors that make contacts are coloured: red, negatively charged; blue, positively charged; green, hydrophobic; yellow, hydrophilic. Residues in white are those that do not make contact to the respective G protein, but the equivalent residue in the other receptor does. B-W numbers are given for residues in transmembrane α-helices, with a dash for residues in loops or H8. Amino acid residues 5.71-5.77 are disordered in the A2AR–mini-Gs structure.
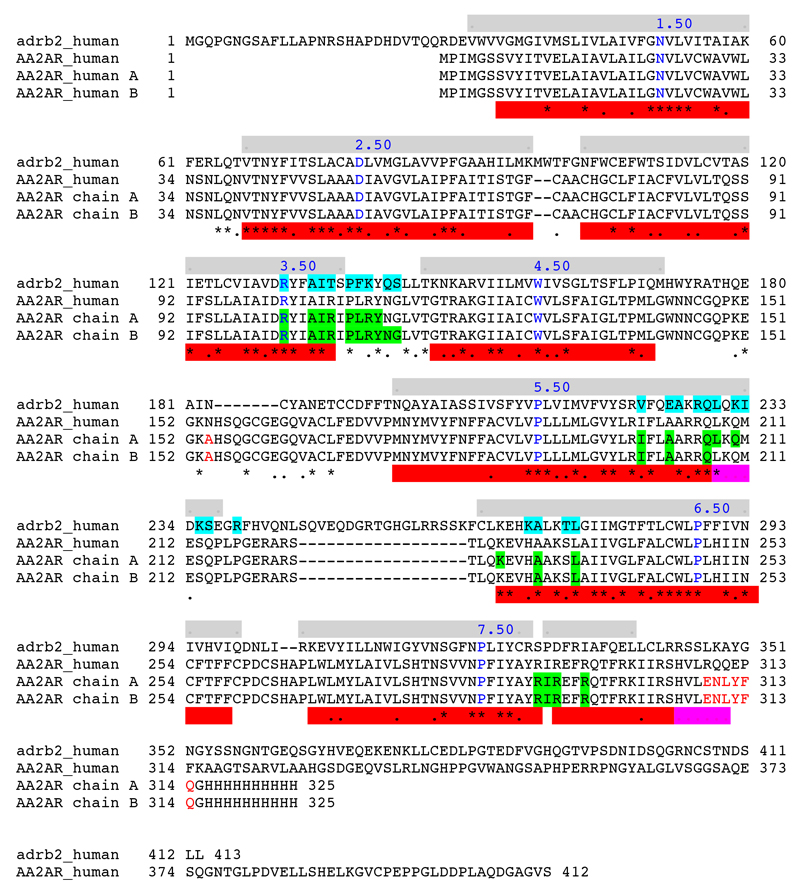
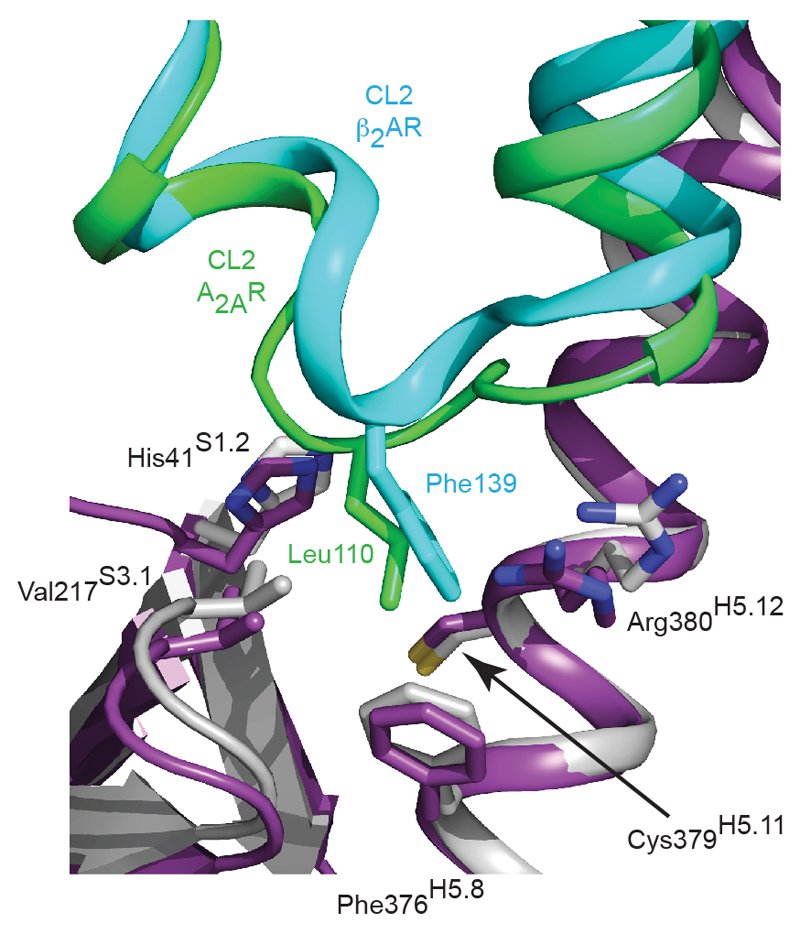
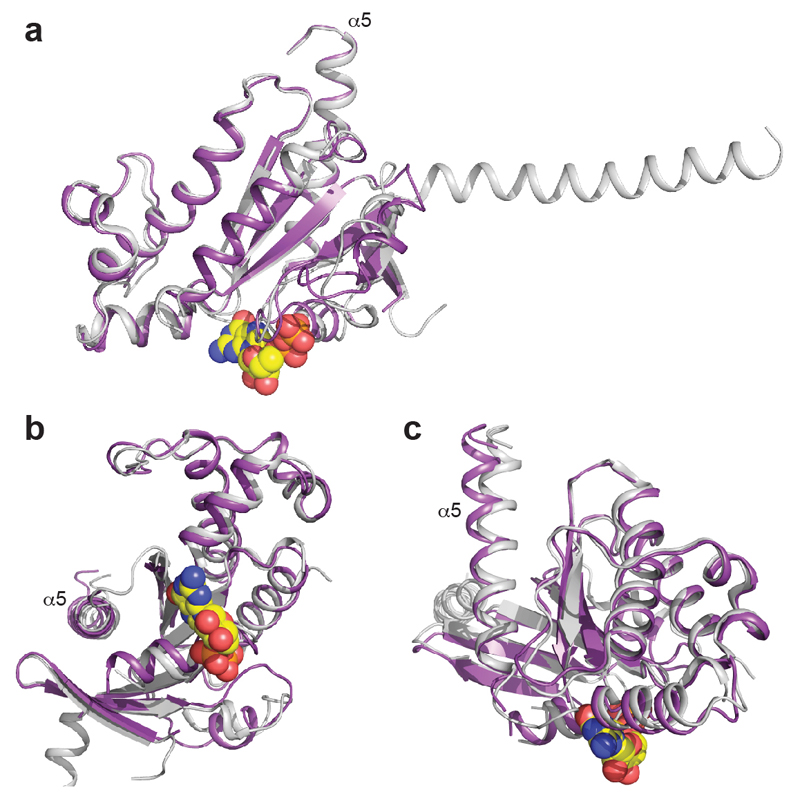
Superposition of the receptors in the A2AR–mini-Gs complex and the β2AR–Gs complex4 shows that the receptors have very similar architectures (rmsd 1.7 Å over 1239 atoms). The intracellular faces of the receptors align very well, including the large outward shift of the cytoplasmic end of H6 on activation. However, mini-Gs does not superimpose exactly on the Gα subunit of the heterotrimeric G protein bound to β2AR (Fig. 3). There is a difference in orientation of ~15°, although the difference is smaller (~10°) for the α5 helix. This is probably a consequence of the different amino acid residues in A2AR compared to β2AR (Fig. 3 and Extended Data Fig. 5), which results in a slightly different packing of the G proteins to the receptors, although we cannot discount the possible influence of lattice contacts. Alignment of mini-Gs with Gαs bound to β2AR shows that they are essentially identical (rmsd 0.92 Å over 1158 atoms), with the most significant difference being an 8° tilt between the respective α5 helices, resulting in a 3.7 Å displacement of the Cα of Tyr391 in mini-Gs away from the core of the G protein (Extended Data Fig. 8). Overall, there are 14 contacting residues in common between β2AR and A2AR Gs complexes, with an additional 6 contacting residues present only in A2AR and another 10 present only in β2AR (Supplementary Table 1). Many of the contacts between residues in the α5 helix of the G protein and the receptors are conserved, although the exact orientation and atomic contacts may differ (Fig. 3; Extended Data Fig 6, Supplementary Table 1). Similarly, there is a highly conserved interaction between a hydrophobic residue in the centre of CL2, Leu110 in A2AR and Phe139 in β2AR, and residues His41S1.2, Val217S3.1 and Asp215s2s3.1 in Gαs (Extended Data Fig. 7). The most significant difference between the A2AR–mini-Gs interface compared to the β2AR–Gs interface occurs as a result of the different amino acid sequences at the H7-H8 boundary. In A2AR, H7 terminates with Arg2917.56 and forms the sequence R7.56IREFR (amino acid residues in italics do not contact mini-Gs), compared to the sequence S7.56PDFRI in the equivalent position of β2AR, where none of the residues make contacts with Gαs. Another region of the receptors that differs in the presence/absence of contacts to their respective G proteins is at the end of H5, due to the extension of H5 in β2AR by an additional turn compared to A2AR (Fig. 3; Extended Data Fig 6, Supplementary Table 1). From these examples it is clear that although the majority of amino acid residues at the interface between the receptor and G protein are identical, the specific atoms involved in the contacts differ either in terms of the amino acid side chains involved, their relative dispositions at the interface and/or the nature of the interaction.
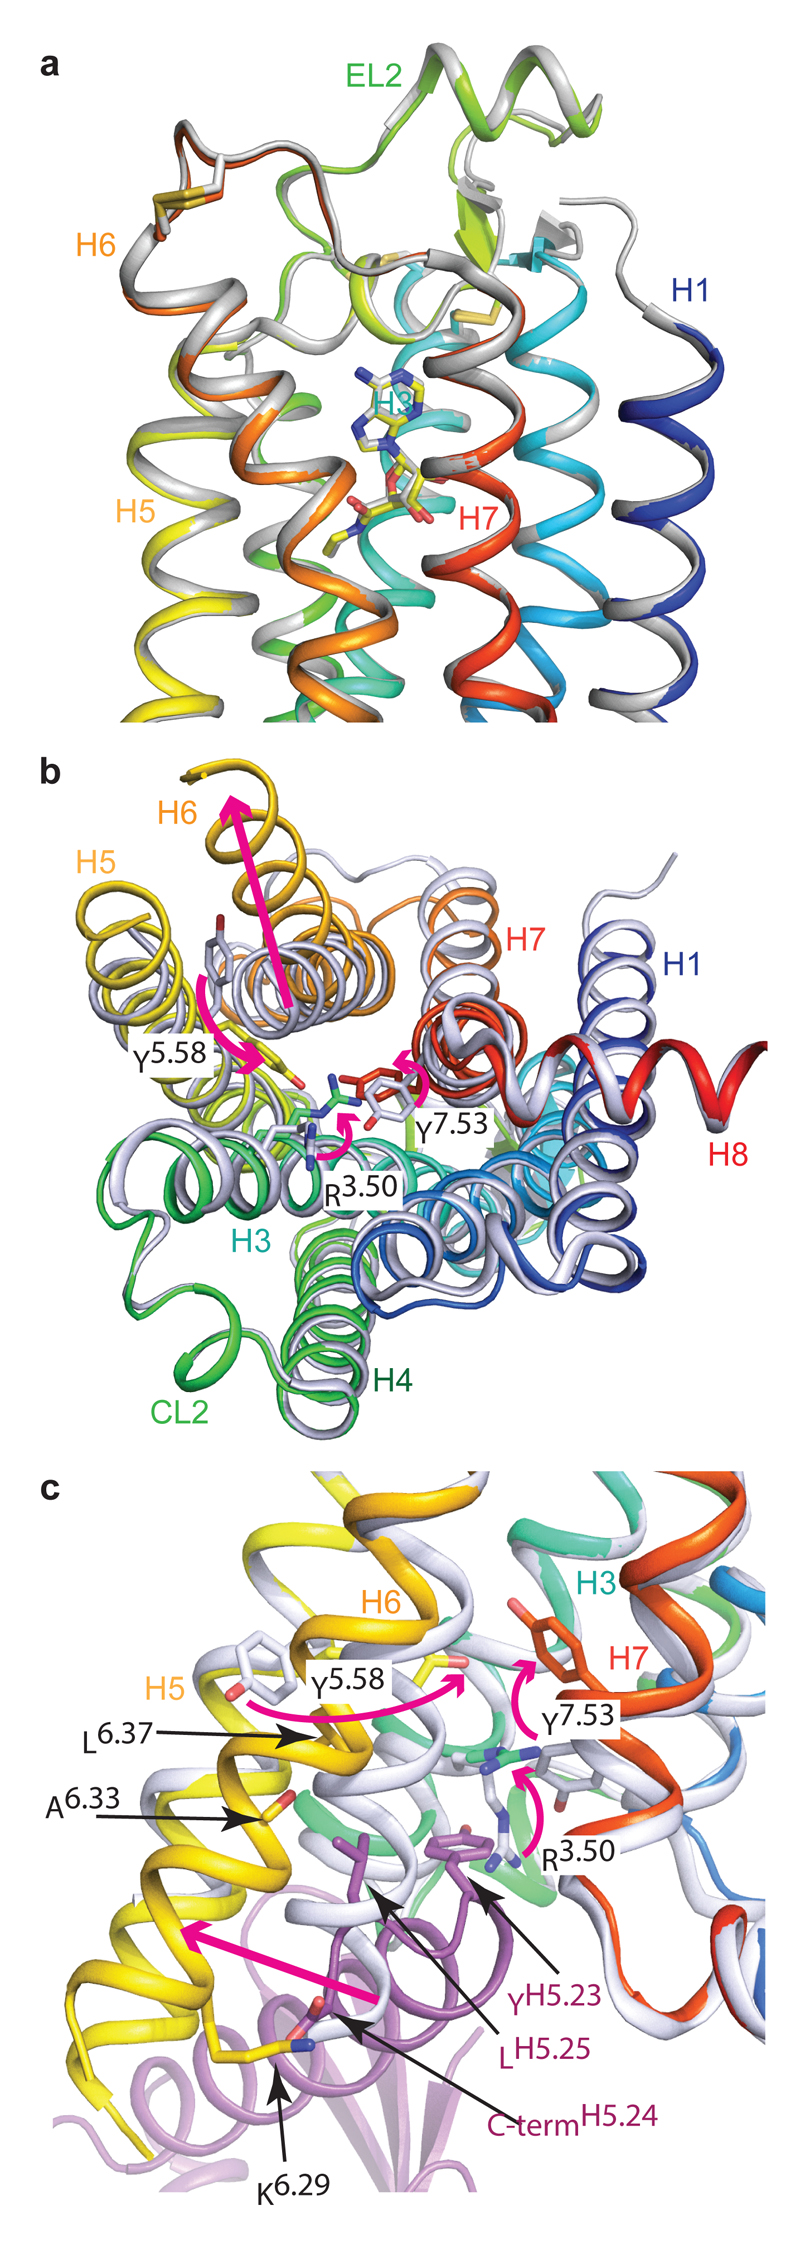
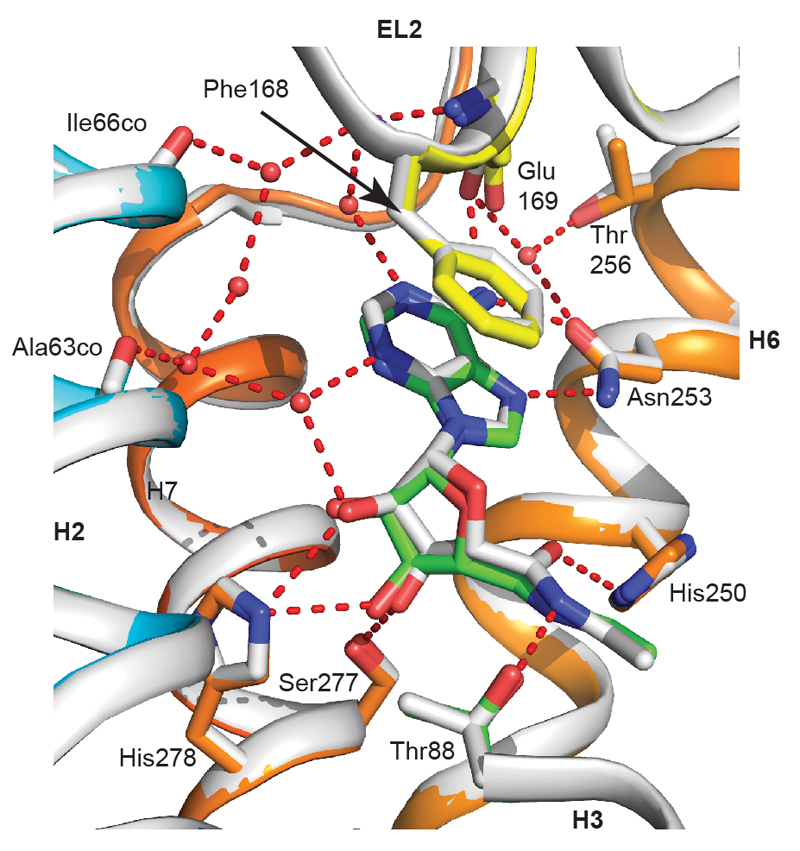
Comparison of the active-intermediate state of UK432097-bound A2AR6 with the structure of A2AR bound to mini-Gs identified major re-arrangements in the cytoplasmic half of the receptor core to accommodate G protein binding (Fig. 4) and will be described in terms of the re-arrangements required to transition from the active-intermediate state to the activated G protein-bound conformation. Firstly, the cytoplasmic end of H6 moves away from the receptor core by 14 Å as measured between the Cα atoms of Thr2246.26 in the two different conformations. This movement is achieved through H6 bending outwards with little discernible rotation around the helix axis. The extent of H6 movement is dictated by van der Waals interactions between Lys2276.29, Ala2316.33 and Leu2356.37 in A2AR and Leu393H5.25 and the carboxy terminus of mini-Gs. The movement of H6 requires significant changes in the packing of the cytoplasmic end of H6 with helices H5 and H7. In particular, the side chains of highly conserved Tyr1975.58 and Tyr2887.53 both adopt new rotamers to fill the space previously occupied by the side chains of Leu2356.37 (whose Cα moves by 3.7 Å) and Ile2386.40 (Cα moves by 2.2 Å) respectively. The shift in Tyr2887.53 allows Arg1023.50 of the conserved DRY motif to adopt a fully extended conformation, packing against the side chain of Tyr391H5.23 in the α5 helix of mini-Gs. It is striking that the structural change from the inactive conformation to the active-intermediate state5 is characterised by the concerted rotation of H5, H6 and H7, whereas the conformation change from the active-intermediate state to the active conformation upon mini-Gs binding is characterised by the bending of H6 with little further rotation. In contrast to the considerable re-arrangements of the cytoplasmic half of the receptor, there are no significant changes in the extracellular half of the receptor (Fig. 4; Extended Data Fig. 9). Thus the disposition of the ligand binding pocket described in the active-intermediate state most likely describes the high-affinity state of NECA-bound to A2AR.
Figure 4.
Conformational changes in A2AR upon G protein binding. A2AR (rainbow colouration) bound to mini-Gs (purple) was aligned with A2AR in the active-intermediate conformation bound to either NECA (PDB ID: 2YDV)5 or UK432097 (PDB ID: 3QAK)6 to highlight structural changes upon G protein binding. Neither structure was used for both comparisons because the large extensions of the ligand UK432097 compared to NECA distorts the extracellular surface in comparison to the NECA-bound structure and the NECA-bound structure contains a thermostabilising mutation in the intracellular half of the receptor. a, Alignment between 2YDV and the extracellular half of the A2AR–mini-Gs complex is viewed parallel to the membrane plane. b, Alignment with 3QAK and viewed from the cytoplasmic surface with mini-Gs removed for clarity. c, Alignment with 3QAK viewed parallel to the membrane with the cytoplasmic side at the bottom. Residues are labelled with their Ballesteros-Weinstein numbers and arrows depict the direction of movement upon mini-Gs binding. Conversion of B-W and CGN numbers to amino acid residues in A2AR and mini-Gs, respectively, are as follows: R3.50, Arg102; Y5.58, Tyr197; K6.29, Lys227; A6.33, Ala231 carbonyl; L6.37, Leu235; Y7.53, Tyr288; YH5.23, Tyr391; LH5.25, Leu393; C-termH5.26, C-terminus of mini-Gs (Leu394). The receptor is in rainbow colours and the mini-Gs is in purple.
A2AR appears to have a very different energy landscape to the β-adrenergic receptors (βARs). Both A2AR and β2AR exist in an ensemble of conformations whether bound to antagonists, agonists or to no ligand at all, and the presence of agonists increases the probability of formation of a fully active state21,22. This active state is then stabilised by binding of a G protein. Structures of βARs bound to agonists are all in a conformation very similar to the inactive state4,23–25, whereas structures of A2AR bound to agonists are in an active-intermediate state5,6,11 very similar to the active state. Whether there is an active-intermediate state for βARs equivalent to A2AR is unknown, but recently, it has been proposed based on extensive EPR data that β2AR also exists in two distinct states in the active conformation21. The work here shows that the active-intermediate and fully active states are distinct conformations in the intracellular half of the receptor. Given the highly conserved nature of the mechanism of GPCR activation, it is likely that the active-intermediate of A2AR may represent a common intermediate for many Class A GPCRs, although it may exist only transiently depending on the energy landscape of the receptor.
Methods
Expression and purification of mini-Gs
The mini-Gs construct used (construct 414) was identical to mini-Gs (construct 393) previously described3, except that one additional mutation, L63Y, was included to improve crystal quality. An N-terminal histidine tag (His6) and TEV protease cleavage site were present to facilitate purification. Mini-Gs was expressed in E. coli strain BL21(DE3)RIL upon induction with IPTG (50 μM) for 20 h at 25°C. Cells were harvested by centrifugation and lysed by sonication in lysis buffer (40 mM HEPES pH 7.5, 100 mM NaCl, 10% glycerol, 10 mM imidazole, 5 mM MgCl2, 50 μM GDP, 1 mM PMSF, 2.5 μM Pepstatin-A, 10 μM Leupeptin, 50 μg/ml DNase I, 100 μg/ml lysozyme, 100 μM DTT), supplemented with Complete™ protease inhibitors (Roche). The lysate was clarified by centrifugation and loaded onto a 10 ml Ni2+ Sepharose FF column. The column was washed with wash buffer (20 mM HEPES pH 7.5, 500 mM NaCl, 40 mM imidazole, 10% glycerol, 1 mM MgCl2, 50 μM GDP) and eluted with elution buffer (20 mM HEPES pH 7.5, 100 mM NaCl, 500 mM imidazole, 10% glycerol, 1 mM MgCl2, 50 μM GDP). TEV protease was added and the sample was dialysed overnight against dialysis buffer (20 mM HEPES pH 7.5, 100 mM NaCl, 10% glycerol, 1 mM MgCl2, 10 μM GDP). TEV protease was removed by negative purification on Ni2+-NTA resin (Qiagen). The sample was concentrated to 1.5 ml and loaded onto a Superdex-200 26/600 gel filtration column, equilibrated with gel filtration buffer (10 mM HEPES pH 7.5, 100 mM NaCl, 10% glycerol, 1 mM MgCl2, 1 μM GDP, 0.1 mM TCEP). Peak fractions were pooled and concentrated to 100 mg/ml. The pure protein was aliquoted, flash-frozen in liquid nitrogen, and stored at -80°C. A typical yield was 100 mg of pure mini-Gs per litre of culture.
Expression and purification of adenosine A2AR
Wild type human adenosine A2AR (residues 1-308) was modified to contain a C-terminal histidine tag (His10) and TEV protease cleavage site. The N154A mutation was introduced to remove a potential N-linked glycosylation site. Recombinant baculoviruses expressing A2AR were prepared using the flashBAC ULTRA system (Oxford Expression Technologies). Trichoplusia ni cells were grown in suspension in ESF921 media (Expression Systems) to a density of 3x10⁶ cells/ml, infected with A2AR baculovirus and incubated for 72 h. Cells were harvested and membranes prepared by two ultracentrifugation steps in 20 mM HEPES pH7.5, 1 mM EDTA, 1mM PMSF. NECA (100 μM), NaCl (300 mM), PMSF (1mM) and Complete™ protease inhibitors (Roche) were added to the membranes, and the sample was mixed for 30 min at room temperature. Membranes from 3 L of cells were solubilised with 2% n-decyl-β-D-maltopyranoside (DM) on ice for 1 h. The sample was clarified by ultracentrifugation and loaded onto a 5 ml Ni-NTA column (Qiagen). The column was washed with wash buffer (20 mM HEPES pH 7.5, 500 mM NaCl, 10% glycerol, 80 mM imidazole, 100 μM NECA, 0.15% DM), and eluted with elution buffer (20 mM HEPES pH 7.5, 100 mM NaCl, 10% glycerol, 300 mM imidazole, 100 μM NECA, 0.15% DM). The eluate was concentrated using a 50 kDa cut-off Amicon centrifugal ultrafiltration unit (Millipore), and exchanged into desalting buffer (10 mM HEPES pH 7.5, 100 mM NaCl, 10% glycerol, 100 μM NECA, 0.15% DM) using a PD10 column (GE Healthcare). TEV protease was added, and the sample was incubated on ice overnight. TEV protease was removed by negative purification on Ni2+-NTA resin. The sample was concentrated to 0.2 ml and loaded onto a Superdex 200 column (GE Healthcare). Peak fractions were pooled and concentrated to approximately 20 mg/ml. A typical yield was 2 mg of pure A2AR per litre of culture.
Complexation and crystallisation
Purified A2AR was mixed with a 1.2-fold molar excess of mini-Gs. MgCl2 (1 mM) and apyrase (0.1 U) were added, and the mixture was incubated on ice overnight. The sample was diluted 10-fold in gel filtration buffer (10 mM HEPES pH 7.5, 100 mM NaCl, 100 μM NECA, 0.35% n-octyl-β-D-thioglucopyranoside OTG), concentrated to 0.2 ml, and loaded on to a Superdex 200 column (pre-equilibrated in the same buffer). Peak fractions, containing the A2AR–mini-Gs complex, were pooled and concentrated to 20 mg/ml. The A2AR–mini-Gs complex was crystallised by vapour diffusion in OTG either in the presence or absence of cholesterol hemisuccinate (CHS), but there was no discernible difference in the quality of crystals that grew under the two different conditions (the structure was determined using data collected from 2 crystals, one from each condition). Crystallisation plates were set up at 4°C using 120 nl sitting drops. Crystals used for structure solution were grown in two conditions, either: 0.1 M NaOAc pH 5.5, 10% PEG 2000 (in the presence of CHS); or 0.1 M NaOAc pH 5.7, 9.5% PEG 2000 MME (in the absence of CHS). Crystals were cryo-protected in mother liquor supplemented with 30% PEG 400 and flash frozen in liquid nitrogen.
Data collection, processing and refinement
Diffraction data were collected at the European Synchrotron Radiation Facility on beamline ID23-2 with a Pilatus 2M detector, using a 6 μm x 8 μm microfocus beam (0.8729 Å wavelength). Data were collected using either standard or helical collection modes. Data from two crystals were used for structure solution. Data were processed using MOSFLM26 and AIMLESS27. The structure was solved by molecular replacement with PHASER28 using the structures of the thermostabilised A2AR (PDB ID: 2YDV)5 and the Gαs GTPase domain (residues 40-59 and 205-394) from the β2AR–Gs complex (PDB ID: 3SN6)4 as search models. Model refinement and rebuilding were performed using REFMAC29 and COOT30.
Competition binding assay
FreeStyle HEK293-F cells transiently expressing wild type A2AR were resuspended in either assay buffer A (25 mM HEPES, pH 7.5, 100 mM KCl, 1 mM MgCl2), assay buffer B (25 mM HEPES, pH 7.5, 100 mM NaCl, 1 mM MgCl2), or assay buffer C (25 mM HEPES, pH 7.5, 500 mM NaCl, 1 mM MgCl2), and were lysed by 10 passages through a 26-gauge needle. Purified binding partners were buffer-exchanged to the respective buffer before being added to the membranes at a final concentration of 25 μM. The mixture was aliquoted and NECA was added (0 to 1 mM final concentration, prepared in assay buffers containing 1 u/mL apyrase). The samples were incubated for 90 min at 22°C, 3H-ZM241385 was added at its apparent Kd (2.5 nM) and allowed to bind for a further 90 min at 22°C. Non-specific binding was determined in the presence of 100 μM of ZM241385. Receptor-bound and free radioligand were separated by filtration through 96-well GF/B filter plates (pre-soaked with 0.1% polyethyleneimine), and washed 3 times with the appropriate buffer. Plates were dried and radioactivity was quantified by liquid scintillation counting using a Tri-Carb 2910 TR (Perkin Elmer). Data were analyzed by nonlinear regression using GraphPad Prism software. The Ki for NECA binding was derived from one-site fit Ki analysis. Data from at least three independent experiments, each performed in duplicate, were analyzed using an unpaired two-tailed t-test for statistical significance.
Thermostability assay
Membranes from Trichoplusia ni cells expressing wild type human A2AR were resuspended in Tm buffer (25 mM HEPES pH 7.5, 100 mM NaCl, 1 mM MgCl2) and homogenised by 10 passages through a 26-gauge needle. Binding partner was added at a final concentration of 25 μM. 3H-NECA and unlabelled NECA were mixed in a molar ratio of 1:5 and added to the membranes to give a final concentration of 1 μM (approximately 10-fold above the apparent Kd). The samples were incubated at room temperature for 1 h, then chilled on ice for 30 min. DDM, DM or OG were added to a final concentration of 0.1%, 0.13% or 0.8%, respectively, and samples were incubated on ice for 1 h. Cell debris and insoluble material were removed by centrifugation for 5 min at 20,000 xg and the supernatant was aliquoted into PCR strips. Samples were heated to the desired temperature for exactly 30 min, then quenched on ice for 30 min. Samples (50 μl) were loaded onto gel filtration resin packed into a 96-well filter plate (Millipore), which was centrifuged to separate receptor-bound from free radioligand. Non-specific binding was determined in the presence of 200 μM unlabeled NECA. Radioactivity was quantified by liquid scintillation counting using a MicroBeta TriLux scintillation counter (PerkinElmer). Data were analyzed by nonlinear regression using GraphPad Prism software. Apparent Tm values were derived from sigmoidal dose-response analysis. Results represent the mean ± SEM of two independent experiments, performed in duplicate.
Extended Data
Extended Data Figure 1.
Pharmacological analyses of A2AR–mini-Gs complexes. Competition assays were performed on A2AR expressed in HEK293 cell membranes with the agonist NECA competing for the binding of radiolabelled inverse agonist 3H-ZM241385. Experiments were performed in the presence of either 100 mM KCl (a,b), 100 mM NaCl (c, d) or 500 mM NaCl (e, f) to confirm the similar behaviour of mini-Gs with heterotrimeric Gs with nanobody Nb35 for stabilisation of the complex. Results are summarised in the Table (g). Data from at least 3 independent experiments performed in duplicate were analysed with an unpaired t-test for statistical significance.
Extended Data Figure 2.
Thermostability of detergent-solubilised 3H-NECA-bound A2AR in the presence or absence of mini-Gs. Unpurified A2AR was solubilised in detergent at the following concentrations: a, DDM, 0.1%; b, DM, 0.13%; c, OG, 0.8%. Samples were heated for 30 minutes, quenched on ice and the amount of 3H-NECA bound determined. Data were analysed by non-linear regression and apparent Tm values were determined from analysis of the sigmoidal dose-response curves fitted (d). Results represent the mean ± SEM of two independent experiments, performed in duplicate.
Extended Data Figure 3.
Omit maps for NECA and GDP. Orthogonal views of omit map difference density for NECA in A2AR chain A (a, b), NECA in A2AR chain B (c, d) and GDP in mini-Gs chain C (e, f). The contour level is 2.5 sigma in panels a-d and 3.0 sigma in panels e and f. Figures were made using CCP4mg31.
Extended Data Figure 4.
Electron density for the interface region of the A2AR–mini Gs complex. The backbones of A2AR and mini-Gs are shown in cartoon representation in light blue and magenta respectively. Side chains are shown in stick representation (carbon, light blue; oxygen, red; nitrogen, deep blue). The electron density of the final 2Fo-Fc map is shown contoured at 1.2 sigma. For clarity, transmembrane helices H5 and H6 and the corresponding electron density have been omitted. (a) View showing the interaction between the C-terminal helix of mini-Gs and the CL2 loop of A2AR. (b) View showing the interactions between side chains of the C-terminal helix of mini-Gs and three Arg residues of A2AR.
Extended Data Figure 5.
Alignment of mini-Gs with GNAS2. Comparison of amino acid residues in mini-Gs (chains C & D) within 3.9 Å of A2AR (green) in the A2AR–mini-Gs structure and the amino acid residues in bovine GNAS2 (P04896) within 3.9 Å of β2AR in the β2AR–Gs structure (turquoise). The CGN system is used for reference.
Extended Data Figure 6.
Alignment of β2AR and A2AR amino acid sequences. adrb2_human, human β2-adrenergic receptor; AA2AR_human, human adenosine A2A receptor; AA2AR chain A, chain A of the crystallised A2AR–mini-Gs structure; AA2AR chain B, chain B of the crystallised A2AR–mini-Gs structure. Residues in the receptors that are within 3.9 Å of either Gσ in the β2AR–Gs complex or mini-Gs in the A2AR–mini-Gs complex are highlighted in turquoise or green, respectively. Key Ballesteros-Weinstein numbers are shown in blue and mutations in the crystallised A2AR to facilitate purification and crystallization are shown in red. Grey bars indicate the positions of α-helices in the β2AR–Gs structure, whereas red bars represent these regions in the A2AR–mini-Gs structure; where there is a discrepancy in helix length between Chain A and B of A2AR, the bar is coloured pink.
Extended Data Figure 7.
A conserved hydrophobic binding pocket at the receptor-Gασ interface. The A2AR–mini-Gs complex was aligned to the β2AR–Gs complex via the receptors; A2AR, green; β2AR, turquoise; mini-Gs (purple); Gαs (grey).
Extended Data Figure 8.
Comparison between receptor-bound mini-Gs and Gασ. a-c, Three different views of an alignment of mini-Gs (chain C, purple) bound to A2AR with the GTPase domain of Gαs (grey) bound to β2AR. GDP bound to mini-Gs is depicted as a space filling model (carbon, yellow; oxygen, red; nitrogen, blue; phosphorus, orange). The α5 helix that interacts with the receptors is labelled.
Extended Data Figure 9.
Comparison of the NECA binding site in the active-intermediate state compared to the mini-Gs-bound state. The structure of NECA-bound A2AR (grey cartoon, with the carbon atoms of NECA also in grey) in the active-intermediate state was aligned with the structure of the NECA-bound A2AR–mini-Gs complex (rainbow colouration, with the carbon atoms of NECA in green). Key amino acid residues for both receptors are depicted (sticks; carbon atoms in the same colour as the respective receptor) that form hydrogen bonds (red dashed line) with either NECA or the associated water network (red spheres). Note that the water molecules depicted are from only the NECA-bound A2AR structure in the active-intermediate state, because the resolution of the A2AR–mini-Gs structure was insufficient to identify water molecules. Carbonyl oxygens are denoted by ‘co’ after the residue name.
Extended Data Table 1. Data collection and refinement statistics.
| Data Collection | |
|---|---|
| Space group | P 21 21 21 |
| Cell dimensions a, b, c (Å) | 90.6, 111.8, 161.3 |
| Resolution (Å) 1 | 40.3-3.4 (3.49-3.40) |
| Rmerge | 0.173 (0.747) |
| I/σI | 3.6 (1.2) |
| Completeness (%) | 90.6 (78.5) |
| Redundancy | 2.6 (2.4) |
| Refinement | |
| Resolution (Å) | 40.3-3.4 |
| No. reflections | 19788 |
| Rwork/Rfree % | 28.4/31.5 |
| No. atoms | 7359 |
| Protein | 7248 |
| Ligand/detergent/nucleotide | 44/40/27 |
| Water | 0 |
| B-factors (Å2) | |
| Protein | 79.9 |
| Ligand/detergent/nucleotide | 67.9/98.6/69.0 |
| R.M.S.D. | |
| Bond lengths (Å) | 0.008 |
| Bond angles (°) | 1.15 |
Values in parentheses are for the highest resolution shell.
Supplementary Material
Acknowledgements
This work was supported by a grant from Heptares Therapeutics Ltd, the ERC (grant EMPSI 339995) and core funding from the Medical Research Council (MC_U105197215 and MC_U105184325). We thank the beamline staff at the European Synchrotron Radiation Facility (beamlines ID23-2, ID30-A3 and ID29) and at Diamond Light Source (beamline I24). We also thank R. Henderson, A. Jazayeri and T. Flock for comments on the manuscript. We declare a competing financial interest: this work was funded in part by Heptares Therapeutics Ltd. CGT is a consulatnat and member of the Scientific Advisory Board for Heptares Therapeutics Ltd.
Footnotes
Author contributions. B.C. performed receptor expression, purification, crystallization, cryo-cooling of the crystals, data collection, data processing and structure refinement. T.W. helped with crystallisation, data collection and data processing. R.N. performed the stability assays and pharmacological analyses on A2AR–mini-GS complexes. A.G.W.L. was involved in data processing and structure solution, refinement and analysis. Manuscript preparation was performed by B.C., A.G.W.L. and C.G.T. The overall project management was by C.G.T.
Author information. Co-ordinates and structure factors for the A2AR–mini-Gs complex have been submitted to the PDB database under accession code 5G53.
References
- 1.Kobilka BK. Structural insights into adrenergic receptor function and pharmacology. Trends Pharmacol Sci. 2011;32:213–218. doi: 10.1016/j.tips.2011.02.005. [DOI] [PMC free article] [PubMed] [Google Scholar]
- 2.Venkatakrishnan AJ, et al. Molecular signatures of G-protein-coupled receptors. Nature. 2013;494:185–194. doi: 10.1038/nature11896. [DOI] [PubMed] [Google Scholar]
- 3.Carpenter B, Tate CG. Engineering a minimal G Protein to facilitate crystallisation of G protein coupled receptors in their active conformation. 2016 doi: 10.1093/protein/gzw049. Submitted. [DOI] [PMC free article] [PubMed] [Google Scholar]
- 4.Rasmussen SG, et al. Crystal structure of the beta2 adrenergic receptor-Gs protein complex. Nature. 2011;477:549–555. doi: 10.1038/nature10361. [DOI] [PMC free article] [PubMed] [Google Scholar]
- 5.Lebon G, et al. Agonist-bound adenosine A2A receptor structures reveal common features of GPCR activation. Nature. 2011;474:521–525. doi: 10.1038/nature10136. [DOI] [PMC free article] [PubMed] [Google Scholar]
- 6.Xu F, et al. Structure of an agonist-bound human A2A adenosine receptor. Science. 2011;332:322–327. doi: 10.1126/science.1202793. [DOI] [PMC free article] [PubMed] [Google Scholar]
- 7.Flock T, et al. Universal allosteric mechanism for Galpha activation by GPCRs. Nature. 2015;524:173–179. doi: 10.1038/nature14663. [DOI] [PMC free article] [PubMed] [Google Scholar]
- 8.Dore AS, et al. Structure of the adenosine A(2A) receptor in complex with ZM241385 and the xanthines XAC and caffeine. Structure. 2011;19:1283–1293. doi: 10.1016/j.str.2011.06.014. [DOI] [PMC free article] [PubMed] [Google Scholar]
- 9.Hino T, et al. G-protein-coupled receptor inactivation by an allosteric inverse-agonist antibody. Nature. 2012;482:237–240. doi: 10.1038/nature10750. [DOI] [PMC free article] [PubMed] [Google Scholar]
- 10.Jaakola VP, et al. The 2.6 angstrom crystal structure of a human A2A adenosine receptor bound to an antagonist. Science. 2008;322:1211–1217. doi: 10.1126/science.1164772. [DOI] [PMC free article] [PubMed] [Google Scholar]
- 11.Lebon G, Edwards PC, Leslie AG, Tate CG. Molecular Determinants of CGS21680 Binding to the Human Adenosine A2A Receptor. Mol Pharmacol. 2015;87:907–915. doi: 10.1124/mol.114.097360. [DOI] [PMC free article] [PubMed] [Google Scholar]
- 12.Lebon G, Warne T, Tate CG. Agonist-bound structures of G protein-coupled receptors. Current opinion in structural biology. 2012 doi: 10.1016/j.sbi.2012.03.007. [DOI] [PubMed] [Google Scholar]
- 13.Congreve M, et al. Discovery of 1,2,4-triazine derivatives as adenosine A(2A) antagonists using structure based drug design. Journal of medicinal chemistry. 2012;55:1898–1903. doi: 10.1021/jm201376w. [DOI] [PMC free article] [PubMed] [Google Scholar]
- 14.Liu W, et al. Structural basis for allosteric regulation of GPCRs by sodium ions. Science. 2012;337:232–236. doi: 10.1126/science.1219218. [DOI] [PMC free article] [PubMed] [Google Scholar]
- 15.Miller-Gallacher JL, et al. The 2.1 A resolution structure of cyanopindolol-bound beta1-adrenoceptor identifies an intramembrane Na+ ion that stabilises the ligand-free receptor. PLoS One. 2014;9:e92727. doi: 10.1371/journal.pone.0092727. [DOI] [PMC free article] [PubMed] [Google Scholar]
- 16.Fenalti G, et al. Molecular control of delta-opioid receptor signalling. Nature. 2014;506:191–196. doi: 10.1038/nature12944. [DOI] [PMC free article] [PubMed] [Google Scholar]
- 17.Zhang C, et al. High-resolution crystal structure of human protease-activated receptor 1. Nature. 2012;492:387–392. doi: 10.1038/nature11701. [DOI] [PMC free article] [PubMed] [Google Scholar]
- 18.Huang W, et al. Structural insights into micro-opioid receptor activation. Nature. 2015;524:315–321. doi: 10.1038/nature14886. [DOI] [PMC free article] [PubMed] [Google Scholar]
- 19.Murphree LJ, Marshall MA, Rieger JM, MacDonald TL, Linden J. Human A(2A) adenosine receptors: high-affinity agonist binding to receptor-G protein complexes containing Gbeta(4) Mol Pharmacol. 2002;61:455–462. doi: 10.1124/mol.61.2.455. [DOI] [PubMed] [Google Scholar]
- 20.Ballesteros JA, Weinstein H. Integrated methods for the construction of three dimensional models and computational probing of structure function relations in G protein-coupled receptors. In: Sealfon SC, Conn PM, editors. Methods in Neurosciences. Vol. 25. Academic Press; San Diego, CA: 1995. pp. 366–428. [Google Scholar]
- 21.Manglik A, et al. Structural Insights into the Dynamic Process of beta2-Adrenergic Receptor Signaling. Cell. 2015;161:1101–1111. doi: 10.1016/j.cell.2015.04.043. [DOI] [PMC free article] [PubMed] [Google Scholar]
- 22.Ye L, Van Eps N, Zimmer M, Ernst OP, Prosser RS. Activation of the A2A adenosine G-protein-coupled receptor by conformational selection. Nature. 2016;533:265–268. doi: 10.1038/nature17668. [DOI] [PubMed] [Google Scholar]
- 23.Rasmussen SG, et al. Structure of a nanobody-stabilized active state of the beta(2) adrenoceptor. Nature. 2011;469:175–180. doi: 10.1038/nature09648. [DOI] [PMC free article] [PubMed] [Google Scholar]
- 24.Rosenbaum DM, et al. Structure and function of an irreversible agonist-beta(2) adrenoceptor complex. Nature. 2011;469:236–240. doi: 10.1038/nature09665. [DOI] [PMC free article] [PubMed] [Google Scholar]
- 25.Warne T, et al. The structural basis for agonist and partial agonist action on a beta(1)-adrenergic receptor. Nature. 2011;469:241–244. doi: 10.1038/nature09746. [DOI] [PMC free article] [PubMed] [Google Scholar]
- 26.Leslie AG. The integration of macromolecular diffraction data. Acta Crystallogr D Biol Crystallogr. 2006;62:48–57. doi: 10.1107/S0907444905039107. [DOI] [PubMed] [Google Scholar]
- 27.Evans P. Scaling and assessment of data quality. Acta Crystallogr D Biol Crystallogr. 2006;62:72–82. doi: 10.1107/S0907444905036693. [DOI] [PubMed] [Google Scholar]
- 28.McCoy AJ, et al. Phaser crystallographic software. J Appl Crystallogr. 2007;40:658–674. doi: 10.1107/S0021889807021206. [DOI] [PMC free article] [PubMed] [Google Scholar]
- 29.Murshudov GN, et al. REFMAC5 for the refinement of macromolecular crystal structures. Acta Crystallogr D Biol Crystallogr. 2011;67:355–367. doi: 10.1107/S0907444911001314. [DOI] [PMC free article] [PubMed] [Google Scholar]
- 30.Emsley P, Lohkamp B, Scott WG, Cowtan K. Features and development of Coot. Acta Crystallogr D Biol Crystallogr. 2010;66:486–501. doi: 10.1107/S0907444910007493. [DOI] [PMC free article] [PubMed] [Google Scholar]
- 31.Potterton L, et al. Developments in the CCP4 molecular-graphics project. Acta Crystallogr D Biol Crystallogr. 2004;60:2288–2294. doi: 10.1107/S0907444904023716. [DOI] [PubMed] [Google Scholar]
- 32.Winn MD, et al. Overview of the CCP4 suite and current developments. Acta Crystallogr D Biol Crystallogr. 2011;67:235–242. doi: 10.1107/S0907444910045749. [DOI] [PMC free article] [PubMed] [Google Scholar]
Associated Data
This section collects any data citations, data availability statements, or supplementary materials included in this article.


