

Abstract
Many cellular processes including cell division and cell migration require coordination between the actin and microtubule (MT) cytoskeletons. This coordination is as-yet poorly understood, but proteins such as formins and IQGAP1 are known to be involved. We show that the MT binding protein EB1 (end-binding protein 1), a key regulator of MT dynamics, can bind directly to filamentous actin (F-actin) F-actin. We determined that the EB1:F-actin interaction is salt sensitive and weak under physiological salt concentrations but might be relevant in contexts where the local concentration of actin is high. Using bioinformatics and mutagenesis, we found that the EB1:F-actin binding site partially overlaps the well-characterized EB1:MT binding interface. Congruently, competition experiments indicate that EB1 can bind to F-actin or MTs but not both simultaneously. These observations suggest that EB1:F-actin interactions may negatively regulate EB1:MT interactions, and we speculate that this interaction may assist cells in differentially regulating MT stability in the actin-rich cortex as opposed to the cell interior.
Keywords: EB1, actin, microtubules, cytoskeleton, plus-end tracking protein
Many important cellular and physiological processes (e.g., cell division, cell migration, wound healing, axon guidance) involve both the actin and microtubule (MT) cytoskeletons, and they require coordination between these two dynamic filament systems [1]. While the proteins that control and regulate actin and MTs are relatively well characterized, the processes coordinating these filament systems are less clear.
One reasonable suggestion is that actin:MT coordination is mediated by the use of common signal transduction pathways that control major regulators of both the actin and MT cytoskeletons. For example, the GSK3 kinase regulates both the actin and MT cytoskeletons through phosphorylation of actin and MT binding proteins, such as adenomatous polyposis coli (APC) and CLASPs [2,3]. Another explanation (not mutually exclusive) is that proteins described as cytoskeletal integrators (e.g., IQGAP1 and spectraplakins) mediate communication between the filament networks by binding directly to both networks [4,5]. Both of these mechanisms are well substantiated. However, one could also imagine that actin and MTs might regulate each other more directly, with core elements of one filament system responding to the other. Evidence for this idea is provided by the observation that the crucial actin assembly factors known as formins also bind MTs, regulate MT dynamics, and can bundle MTs in vitro [6,7]. We were intrigued by the possibility that EB1 (end-binding protein 1), the core MT plus-end tracking protein (+TIP) [8,9], might be similarly involved in direct actin:MT coordination.
The idea that EB1 might bind actin is suggested by several pieces of circumstantial evidence. First, EB1 contains a CH (calponin homology) domain at its N-terminus (Fig. 1a). CH domains are typically considered to be actin binding structures [11], although other MT binding CH domains besides EB1 do exist (e.g., NDC80 [12]). Second, other MT +TIPs such as APC and spectraplakins can themselves bind actin [13,14]. Lastly, EB1 depletion causes defects in actin-based processes in mouse tissue culture cells, as well as in Dictyostelium [15,16], and EB1 partially co-localizes with filamentous actin F-actin in Dictyostelium [17]. These observations suggest that EB1 has an evolutionarily conserved role in actin-related functions. However, any EB1:F-actin interaction has thus far been assumed to be indirect, likely mediated by EB1 binding proteins such as formins [7,13,15]. We sought to investigate whether EB1 can bind directly to F-actin. Through a combination of biochemical and biophysical techniques, we have found that EB1 can bind F-actin in vitro and that the F-actin binding site on EB1 overlaps with the well-characterized EB1:MT binding site. Competition experiments support the conclusions from our mutagenesis data and suggest that EB1:F-actin binding and EB1:MT binding are mutually exclusive. We speculate that this interaction may assist cells in differentially regulating MT stability in the actin-rich cortex as opposed to the cell interior.
Fig. 1.
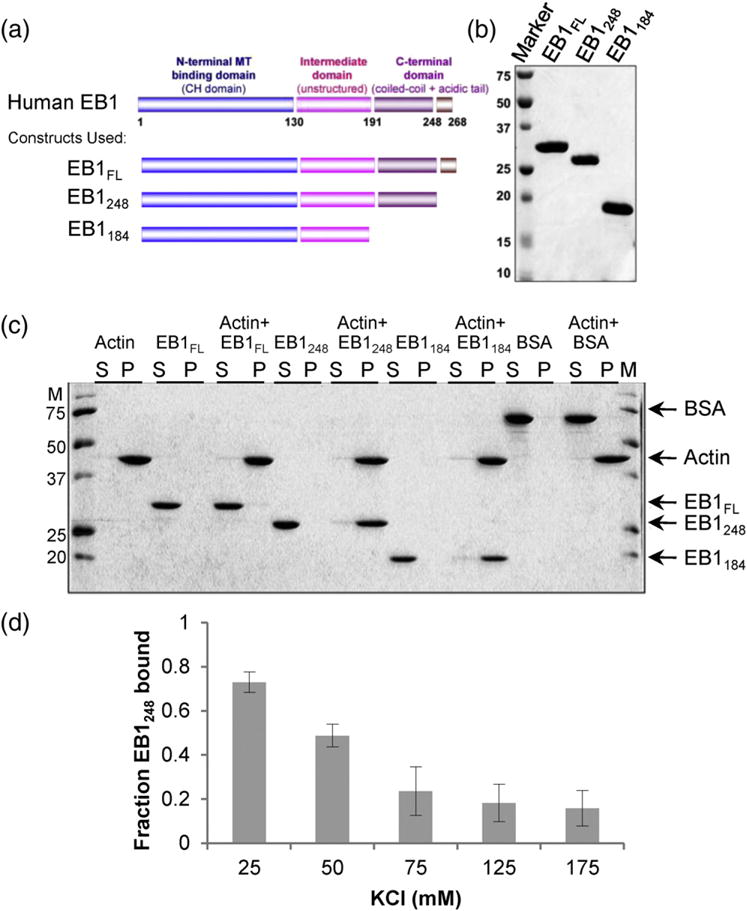
Activated EB1 binds directly to F-actin. (a) EB1 constructs. EB1 full-length (EB1FL) contains an N-terminal MT binding CH domain, a flexible region, a dimerizing coiled coil, and an auto-inhibitory acidic tail. EB1248 is an activated fragment (also dimeric) that lacks the auto-inhibitory acidic tail, while EB1184 lacks the entire coiled-coil region and is monomeric [10]. (b) Purified EB1 proteins. An SDS-PAGE gel of the purified bacterially expressed EB1 proteins is shown. (c) F-actin binding assay, 2 μM of the indicated EB1 proteins (calculated as EB1 monomer) and/or 2 μM preformed F-actin (calculated as actin monomer) were incubated and centrifuged, and the resulting supernatant (S) and pellet (P) fractions were analyzed by SDS-PAGE. The “activated” EB1248 and monomeric EB1184 fragments show 100% binding under the assay conditions. In contrast, EB1FL shows minimal actin binding, consistent with auto-inhibition. BSA was used as a negative control for F-actin binding. (c) Salt sensitivity binding assay; 2 μM EB1248 sedimented with 7 μM F-actin in increasing KCl concentrations. The fraction of EB1248 bound to F-actin decreased as the salt concentration increased, consistent with a salt-sensitive interaction. The observation that ~half of the 2 μM EB1 co-sedimented with 7 μM F-actin in 50 mM salt indicates that, at this salt concentration, the apparent KD is ~7 μM.
Results and discussion
EB1 binds to F-actin
As a first test of whether EB1 binds to F-actin, we examined the ability of various fragments of EB1 to co-sediment with F-actin under conditions of low salt, where we expected that binding to the negatively charged actin filaments would be strongest. We tested three different EB1 constructs: EB1FL (the full-length human protein), EB1248 (the activated form of the protein with the acidic tail removed), and EB1184 (monomeric EB1 that contains the CH domain and part of the unstructured region) (Fig. 1a and b) [10]. We found that full-length EB1 (EB1FL) binds weakly to 2 μM pre-polymerized F-actin: almost all of the EB1FL protein remained in the supernatant whether or not F-actin was added to the assay (Fig. 1c). However, nearly all the EB1248 fragment pelleted in the presence (but not the absence) of 2 μM F-actin under these conditions (Fig. 1c). These observations demonstrate that EB1 can bind to actin and that EB1:F-actin binding, like EB1:MT binding, is negatively regulated by the EB1 tail (i.e., removal of the tail increases the affinity of EB1 for both actin and MTs) [10,18]. In addition, the monomeric MT binding “head” domain of EB1 (which contains the CH domain) also pelleted with F-actin (Fig. 1c). This observation indicates that F-actin binding is mediated at least in part by the MT binding CH domain.
Next, we wanted to get a better understanding of the EB1:F-actin interaction by determining its salt sensitivity. To address this question, we used EB1248 because this construct bound to F-actin the strongest. We found that as we increased the amount of salt from 25 to 175 mM KCl, the fraction of EB1248 bound decreased and then leveled off (Fig. 1d). This salt sensitivity indicates that, at least, part of EB1:F-actin binding is mediated by ionic interactions.
We also tested EB1248 for its ability to bind to F-actin without the presence of phalloidin to ensure that the interaction was mediated by F-actin and not phalloidin or the combination of phalloidin bound F-actin. We found that the fraction of EB1248 bound was the same with or without phalloidin (Fig. S3b). This is consistent with the idea that the interaction between EB1 and F-actin is direct.
The EB1:F-actin binding surface overlaps the EB1:MT binding surface
The conclusion that the CH domain can bind to actin raises the question of how the F-actin and MT binding surfaces of EB1 relate to each other. To investigate this issue, we mapped onto the surface of EB1 a set of amino acids previously identified as being critical for tracking MTs [19] (Fig. 2a and b, blue residues; for additional information, refer to Fig. S1b and Fig. 3). Next, we mapped onto the crystal structure previous mutations that had no effect on MT tracking [20] (Fig. 2a and b, yellow residues). We then compared these two maps to a map of the surface residues that are highly conserved under the assumption that highly conserved surfaces are involved in functionally significant interactions (Fig. 2c–f and Fig. S1a).
Fig. 2.
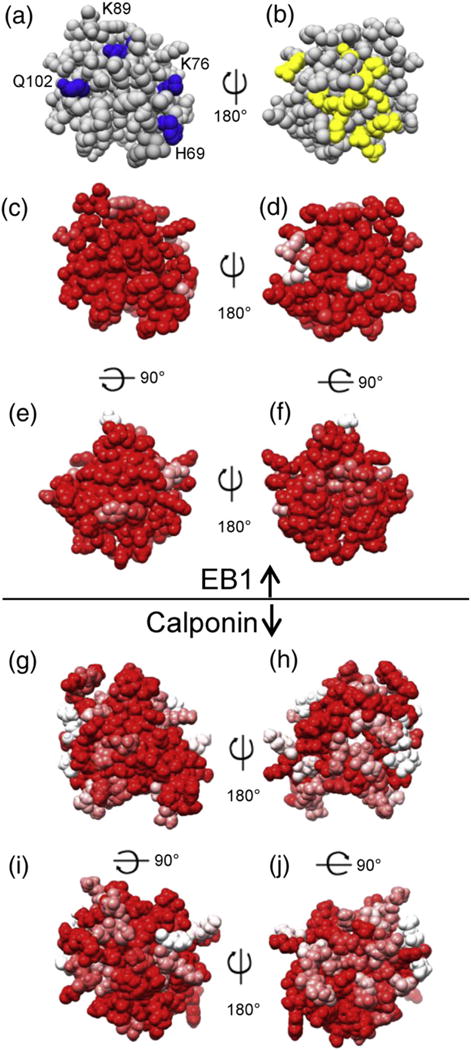
Functionally significant surfaces of EB1. (a and b) A set of amino acids that are crucial for MT tracking are shown in blue [19], while those mutated without effect on MT tracking are shown in yellow [20], mapped onto the previously determined EB1 crystal structure (PDB ID: 1PA7) [21]. (c–f) EB1 conservation map, based on 10 vertebrate model organisms (see Materials and Methods). Red residues are 100% conserved, while pink and white are 70% and 50% conserved, respectively. These data indicate that the face opposite the MT binding interface is evolutionarily constrained and suggest that this region is important for EB1 function. (g–j) Calponin CH domain conservation (same species as in c–f) mapped on the crystal structure (PDB ID: 1WYP). The increased amount of pink and white surface in these panels as compared to (c)–(f) shows that the CH domain of calponin is not as conserved as that of EB1.
Fig. 3.
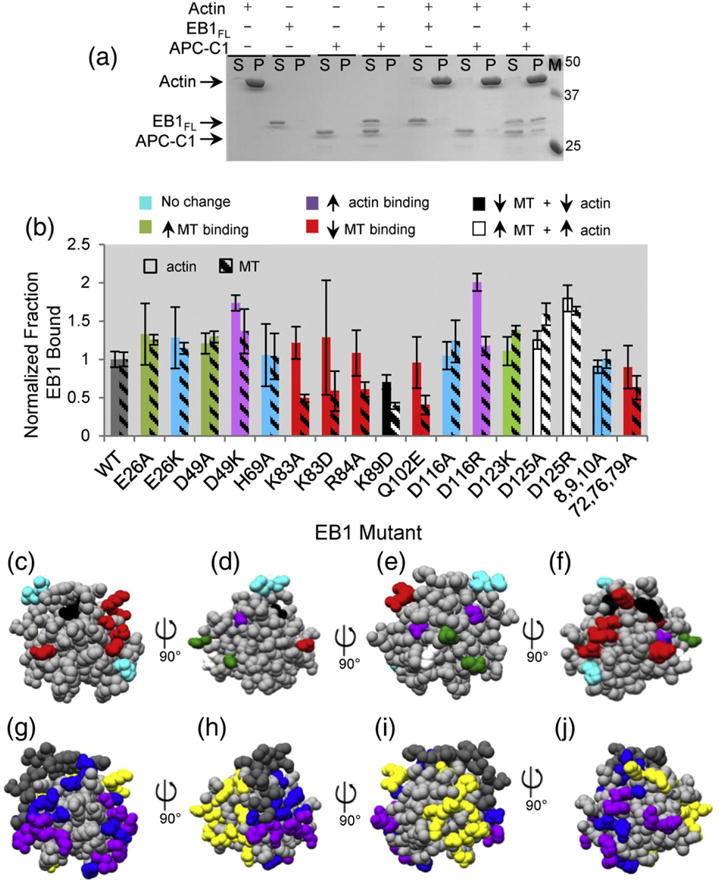
Characterization of EB1 and EB1 mutants. (a) EB1:F-actin binding assay in which 2 μM EB1FL and/or 2 μM APC-C1 were incubated with/without 7 μM pre-assembled F-actin (all concentrations calculated as monomer), centrifuged, and the resulting supernatant (S) and pellet (P) fractions were analyzed by SDS-PAGE. F-actin sedimented as expected, and neither EB1FL nor APC-C1 nor a mixture of EB1FL and APC-C1 sedimented by themselves. In addition, neither EB1FL nor APC-C1 alone co-sedimented with F-actin. However, when EB1FL was incubated with APC-C1 to relieve auto-inhibition and the mixture was incubated with F-actin, significant amounts of both EB1FL and APC-C1 were found in the pellet fractions. These results provide a foundation for characterizing the effects of mutations on EB1:F-actin binding. (b) Summary of F-actin and MT binding assays performed with the EB1 mutants. Filled bars depict the normalized fraction of the indicated EB1FL construct (2 μM) that co-sedimented with F-actin (7 μM), while shaded bars show the normalized fraction of the same EB1FL construct (2 μM) that bound to MTs (5 μM). Bars are colored as indicated in the key according to the binding behavior. (c–f) Position of different classes of mutants as determined in (b), mapped onto the EB1 CH domain crystal structure (1PA7). As in (b), the amino acid residues are colored according to their binding behavior [see key in (b)]. Each panel is a 90° rotation about the y-axis. (g–j) Summary of previously defined EB1:MT interfaces mapped on to the EB1 CH domain crystal structure (1PA7). Amino acid residues found to be important for MT interactions in multiple studies are colored purple [19,20,22]. Residues identified only by Maurer et al. are colored blue [19]. Amino acid residues shown to be not important for MT tracking are yellow [20] (g–j). Zhang et al. noted that part of the EB N-terminus differed between their cryo-EM structure and a previous crystal structure [23], suggesting that some subset of the amino acids in this region might be involved in MT binding; this region has been colored dark gray.
When we compared these maps, we observed that the whole surface of the EB1 CH domain is well conserved across vertebrates, including the face opposite the well-characterized MT binding interface (compare Fig. 2b and d) [19,20]. On the basis of these data, we hypothesized that this highly conserved back surface of EB1 might be involved in F-actin binding. The strong conservation of the EB1 surface is all the more striking when compared to the much weaker conservation of calponin, the protein for which CH domains are named (Fig. 2g–j). We initially thought that we might be able to predict the actin binding surface of EB1 by aligning the EB1 CH domain to the region of the calponin CH that binds to actin, but this surface has not yet been determined; indeed, it is presently unclear whether the calponin CH does bind to actin (calponin’s actin binding seems to be mediated by other parts of the protein) [24]. Comparison to other actin binding CH domains also gave ambiguous results (data not shown).
Therefore, to test the hypothesis that the back surface of EB1 is involved in binding to F-actin, we identified and mutated highly conserved, charged, surface residues on the MT binding surface of EB1 and in the face opposite (Table S1). We specifically mutated charged amino acids due to the electrostatic nature of the EB1:F-actin interaction (Fig. 1d). We made the mutations in EB1FL as opposed to EB1248 because the full-length protein is the most physiologically relevant construct. However, this introduced a problem with assaying the binding activity of the mutated EB1 because EB1FL has relatively weak actin binding, likely due to auto-inhibition as concluded from the data in Fig. 1c. Therefore, to assay the activity of the EB1 mutants, we mixed the EB1 with a fragment of APC (APC-C1) that binds to the EB1 tail in order to relieve its auto-inhibition. [25,26].
As predicted, EB1FL WT (wild type) and APC-C1 co-pelleted significantly (~50%) with F-actin when mixed together but not when incubated individually with F-actin (Fig. 3a). We then used this assay to test the EB1 mutants for their ability to co-sediment with F-actin. The fraction of EB1 bound was calculated for each mutant (Fig. S2a and b) and normalized against the fraction of EB1FL WT bound under these conditions (Fig. 3b). We then classified the 20 mutant EB1 proteins according to their effect on F-actin and MT binding (Table S1).
Of the 20 EB1 mutants generated, one was found to bind both F-actin and MTs more weakly (K89D), while six were found to bind MTs more weakly without significantly affecting F-actin binding [K83A, K83D, R84A, Q102E, and (I72,K76,Q79A)] (Fig. 3b–f; note that colors in the figure are coordinated across panels according to the effect of the mutant). In addition, some mutants bound one or both filament types more strongly (E26A, D49K, D116R, and D123K). Several mutations of conserved surface residues had no effect on binding to F-actin or MTs (E26K, D116A, and (T8,S9,V10A)) (Fig. 3b–f and Table S1). The mutants that showed decreased binding were tested to ensure that were properly folded using circular dichroism. Of the seven mutants tested, five of them had indistinguishable spectra compared to EB1FL WT consistent with the idea that they are properly folded (Fig. S3a). Two mutants [R84D and (55,58,59A)] showed decreased α-helical content and therefore were not used for EB1 mutagenesis analysis (Fig. S3a).
To allow comparison between our mutagenesis data and previous work, we have mapped on to the EB1 crystal structure amino acid residues previously found to be important for the EB1:MT interaction. Residues defined by Maurer et al. [19], Zhang et al. [22], and Slep and Vale [20] are colored purple. Residues defined only by Maurer et al. [19] are colored blue. Those residues not important for MT tracking are colored yellow [20] (Fig. 3g–j). Zhang et al. also noted that part of the EB N-terminus differed between their cryo-electron microscopy (EM) structure and a previous crystal structure [23], suggesting that some subset of amino acids in this region might be involved in MT binding; this region has been colored dark gray.
The lysine at position 89 has been previously found to make important contacts with tubulin and to be a crucial amino acid for MT tracking [19]. We confirmed that the K89D mutation significantly reduced MT binding. Interesting to note, Zhang et al. did not find this residue making any important contacts on their most recent cryo-EM work [22]. We were intrigued to see that the K89D also interfered with F-actin binding. This observation suggests that the F-actin and MT binding interfaces overlap, contrary to our original hypothesis.
We found that some of our other mutations agreed with previously published work, but others did not. More specifically, Q102E and cluster mutant I72,K76,Q79A decreased MT binding (Fig. S3b), as expected [19,20,22]. However, when we changed the histidine at position 69 to an alanine, we did not observe the reduction in MT binding expected from the idea that that this residue is in the MT binding interface [19,22]. This difference in results could be due to the differences in functional assays used (co-sedimentation versus plus-end tracking assays) or the MT analogs used (GDP-Tx-MTs versus GTPγS-MTs) [19,22]. Another interesting observation is that mutations in the amino acids K83 and R84 were previously found to have no effect on plus-end tracking in vivo [20], but when we mutated these residues, we found that they displayed decreased MT binding in our in vitro assays. Again, this observation could be due to the differences in the functional assay or MT analogs used. The observation that several mutations affect binding to only MTs indicates that the overlap between the actin binding sites and MT binding sites is only partial.
We were surprised to see that some mutants (D49K, D116R, and D125A/R) increased binding to MTs, F-actin, or to both F-actin and MTs, and we were intrigued to see that these clustered on the conserved face opposite the MT binding interface. We speculate that this surface of EB1 may be making contacts with the C-terminal region of EB1 during auto-inhibition and that the mutations generated disrupt normal auto-inhibition.
Upon finalizing our mutant analysis, we wanted to ask whether the amino acid positions discussed above are conserved across a broader array of organisms. To do this, we widened our bioinformatics analysis to include several basal animals, as well as a few selected unicellular eukaryotes. These sequences were aligned with the EB1 vertebrates and shown in Fig. 4. When we examined the conservation at these positions, we found (as expected) that almost all of the residues previously established as being involved in MT binding (Fig. 4; K83 and R84 are boxed red and K89 is boxed black) are very highly conserved among all of the organisms examined. Q102 is particularly well conserved (Fig. 4, red box). The most intriguing was the strong conservation of D49 and D116 (Fig. 4, yellow boxes), two positions at which mutations caused increased binding. These two amino acids are conserved to a similar degree as Q102 and are located on the face opposite of the MT binding interface, suggesting that whatever function this surface has, it is highly conserved across eukaryotes.
Fig. 4.
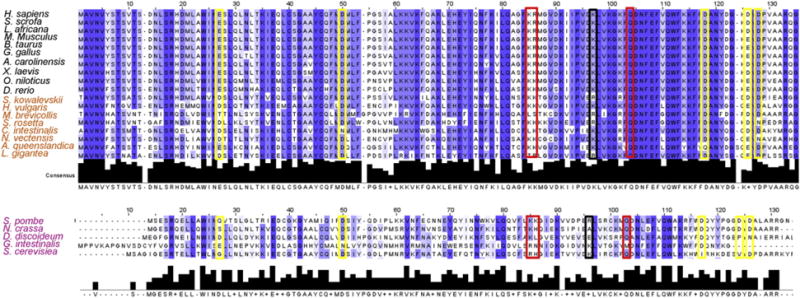
Bioinformatic analysis of more divergent EB1 proteins. EB sequences from eight basal animals and several model unicellular eukaryotes were added to the alignment from Fig. S1 and re-aligned (black names, vertebrates; orange names, basal animals; purple names, unicellular eukaryotes). Amino acids that were mutated in this study are boxed. Yellow boxes indicate the positions of mutations that showed increased polymer binding (either MT or F-actin); red boxes indicate mutations that showed decreased MT binding; black boxes indicate mutations that decreased both MT and F-actin binding.
MTs compete with actin for binding to EB1
The evidence that the F-actin and MT binding surfaces of EB1 overlap suggests that MTs might compete with F-actin for binding to EB1. To test this hypothesis, we had to devise an assay capable of assessing F-actin binding in the presence of MTs; the standard co-sedimentation assay would not work because proteins binding to either filament would end up in the pellet. After trying a series of different approaches (data not shown), we developed an assay based on the observation that incubation of EB1248 with actin causes formation of F-actin bundles (Fig. 5a). It is important to note that the goal of this assay is to determine whether EB1 is binding to F-actin under a given set of conditions (±MTs). We are not implying that F-actin bundling is a normal EB1 activityor suggesting that Taxol-MTs are the optimal EB1 substrate, only that bundling of F-actin by EB1248 requires EB1:F-actin interactions.
Fig. 5.
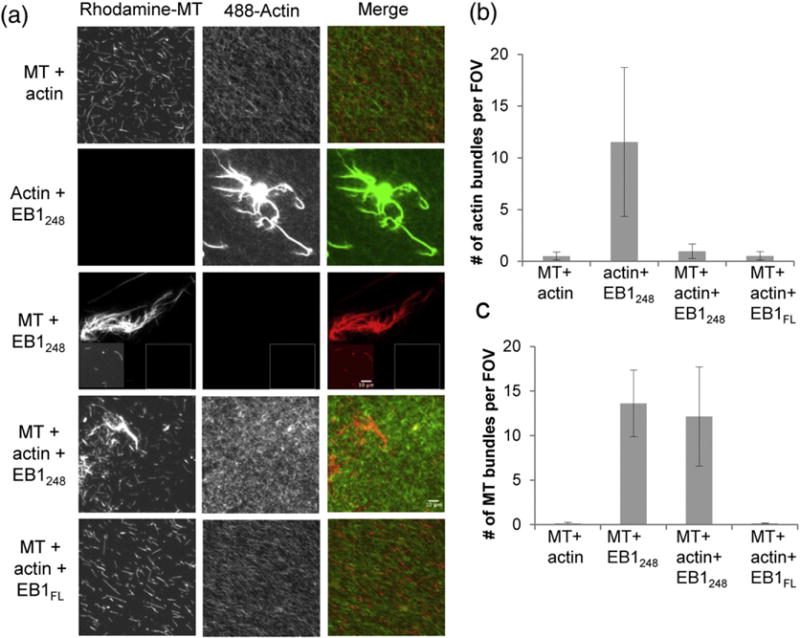
EB1:F-actin and MT binding is mutually exclusive. (a) Representative fluorescence microscopy images of EB1 incubated with rhodamine MTs, F-actin labeled with Alexa-488-phalloidin, or both as indicated; each image in a given column is adjusted to the same levels, except in row 3, where the main image was adjusted to allow visualization of the bundle, and the inset is normalized the same as the rest of the column. (b and c) Quantification of the microscopy data. The number of F-actin bundles per field of view (b) or MT bundles per field of view (c) counted in n = 3 observer blind experiments. These data show that little bundling is observed when MTs and F-actin are incubated without EB1, but when EB1248 is incubated with F-actin or MTs, many large bundles are observed. When MTs, F-actin, and EB1248 are incubated together, the number of F-actin bundles decreased significantly, while the number of MT bundles was similar to experiments without actin. When EB1FL is incubated with MTs and F-actin, bundling of neither filament is seen, consistent with the notion that EB1FL is auto-inhibited. Note that, in the fluorescence images, the MT bundles rarely co-localize with the F-actin, suggesting that they are not cross-linked together.
Initial experiments established that EB1 does bundle F-actin (Fig. 5a, second row). We then tested how adding MTs affected the ability of EB1 to promote F-actin bundling. The idea was that if binding of EB1 to F-actin and MTs is mutually exclusive, the presence of MTs should interfere with the ability of EB1 to bundle F-actin. However, if EB1 can bind both F-actin and MTs at the same time, then addition of MTs should not alter bundling of F-actin by EB1. Moreover, since EB1 also bundles MTs, one would predict that the F-actin and MTs would be co-bundled if EB1 can bind both filaments simultaneously but that the filaments should remain separate if binding is mutually exclusive.
We chose to perform the experiments in a blinded matter (see Materials and Methods) to ensure that observer bias did not influence the results. As expected, bundles were not observed when F-actin and MTs were incubated alone (Fig. 5a, top row). When we mixed 5 μM actin with 1 μM EB1248, we observed frequent bundles in a background of unbundled F-actin (Fig. 5a, second row). EB1 also promoted the formation of MT bundles, some of which were extremely large (Fig. 5a, third row). However, when EB1248 was mixed with both F-actin (5 μM) and MTs (0.5 μM), F-actin bundles became rare (Fig. 5a, fourth row; see also Fig. 4b). In contrast, the effect of F-actin on MT bundling by EB1 was more difficult to discern (Fig. 5a, fourth row; see also Fig. 5c). Qualitatively, blinded observers noted that F-actin reduced the size of the MT bundles though that effect was difficult to quantify (data not shown). EB1FL had little effect on bundling of either F-actin or MTs (Fig. 5a, fifth row; see also Fig. 5b and c), consistent with the idea that EB1FL is auto-inhibited.
These observations support the hypothesis that F-actin and MTs compete for binding to EB1. This hypothesis further predicts that EB1 should fail to co-bundle F-actin and MTs. When labeled F-actin and MTs were mixed in the presence of unlabeled EB1248, the filament networks remained separate, consistent with this idea (Fig. 5a, fourth row; note lack of co-localization between red MTs and green F-actin). The sum of these results lead us to conclude that EB1 can bind to F-actin or MTs, but not both simultaneously.
Is binding of EB1 to F-actin physiologically significant?
The affinity of EB1 for F-actin is relatively strong in 50 mM total KCl; examination of Fig. 1d shows that approximately half of the EB1 is bound at 7 μM F-actin, indicating that the apparent KD is in the range 7 μM; 50 mM is a salt concentration commonly used in F-actin binding assays. However, the binding is weaker at more physiological salt concentrations (Fig. 1d, compare 50 mM salt to 75 mM or 125 mM salt, where only ~20% of the protein is bound at 7 μM F-actin). At first glance, these data might be interpreted to imply that the interaction is not physiologically significant. However, it is important to remember that the local concentration of F-actin can be extraordinarily high in some regions of the cell, especially near the cell boundary. For example, the concentration of F-actin in the lamellipodium of a migrating cell has been estimated to be >500 μM [27,28]. A protein with a KD of 50 μM would be >90% bound to actin in an environment with >500 μM F-actin (assuming simple binding). This reasoning suggests that EB1:F-actin interactions could be relevant in contexts where the local concentration of F-actin is high, such as in the leading edge of a migrating cell where one might expect coordination between the actin and MT cytoskeletons.
This information, together with our evidence (above) that MTs and F-actin compete for binding to EB1 (Fig. 5), leads us to propose a model where EB1 interacts primarily with MTs in the relatively actin-poor interior of the cell but is competed away from MTs, onto F-actin, in the F-actin-rich periphery of cells. In other words, we suggest that high concentrations of F-actin may act as a passive sink for EB1, helping to promote MT de-polymerization in actin-rich areas, for example, near the cell edge (Fig. 6). We suggest this hypothesis because it has been shown that MTs grow persistently in the interior of cells and then display dynamic instability near the edge [28]. Alternatively, EB1’s weak actin binding could become more significant in the context of a complex with other +TIP interacting proteins (e.g., formins, spectraplakins) that themselves bind actin [14,30], or they could be involved in other as-yet uncharacterized aspects of cross-talk between the actin cytoskeleton and components of the +TIP network. These ideas are compatible with the idea that high concentrations of F-actin might compete EB1 off of MTs.
Fig. 6.
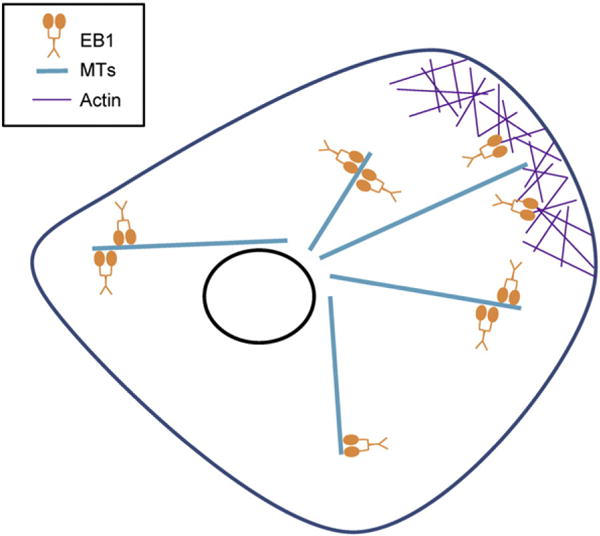
Proposed model of EB1 cytoskeletal regulation. EB1 binds to and tracks the plus ends of MTs in the interior of the cell, where the MTs grow persistently, in part because of polymerization-promoting factors recruited by EB1 [9,29]. As the MTs encounter the actin-rich cell periphery, the EB1 is competed off the MTs, promoting MT de-polymerization.
One prediction of this model is that EB1 +TIP localization will be reduced in regions with high actin concentrations, for example, the lamellipodium. For technical reasons including incompatibilities between EB-labeling methods and lamellipodium-labeling methods, it is difficult to address this question; thus, whether this prediction will be validated remains a focus for future work. Another question raised here is whether weak binding to actin might be a general feature of MT binding CH domains. Given that actin binding CH domains can use different surfaces to bind actin [11] and MT binding CH domains can also use different surfaces to bind tubulin [22], it seems unlikely that one can make generalizations about the binding activities of CH domains. This too remains an interesting question for future study.
Conclusions
We have shown that the MT binding CH domain of EB1 can also bind to F-actin and that, contrary to our expectations, the surfaces that bind MTs and F-actin partially overlap. Consistent with this observation, we have provided evidence that MTs and F-actin compete for binding to EB1. We have shown that the affinity of the EB1:F-actin interaction is weak, but we suggest that it could be significant in the periphery of the cell, where the concentration of F-actin is very high. One possible role for this interaction would be to destabilize MTs by recruiting away EB1 as the MTs approach the F-actin-rich cortex of the cell; it remains possible that the F-actin binding activity of EB1 also has a more direct role in actin function mediated through formation of tripartite complexes with other proteins that bind both EB1 and actin (e.g., formins and APC).
Materials and methods
Bioinformatics
To find the sequences for the amino acid alignments, we performed a BLASTp search with human EB1 or human calponin as the query. The EB1 or calponin sequences of 10 vertebrates were chosen as representatives of vertebrate diversity and independently aligned with ClustalX (for this initial work, we used only this subset of organisms in order to avoid misinterpretations caused by the varied gene duplications that have happened in many organisms, particularly, at the base of vertebrate radiation). Similar alignments were obtained with other alignment programs such as Muscle (data not shown). The model vertebrates include human (GI: 6,912,494), chicken (GI: 71,894,959), cow (GI: 115,496,618), zebrafish (GI: 41,054,091), frog (GI: 147,905,448), mouse (GI: 7,106,301), lizard (GI: 327,289,281), pig (GI: 113,205,898), fish (GI: 348,517,001), and elephant (GI: 344,279,857). The conservation of EB1 or calponin was aligned on to the crystal structure of the CH domain of human EB1 (PDB ID: 1PA7) or human calponin (PDB ID: 1WYP) using the structure analysis and presentation program Chimera [31].
For the analysis of the more divergent EB1 proteins, we identified from National Center for Biotechnology Information a set of early-diverging organisms (both basal animals and model unicellular eukaryotes) that have only one EB1 protein, again chosen to avoid misinterpretations caused by gene duplications as follows: Saccoglossus kowalevskii, Hydra vulgaris, Monosiga brevicollis, Salpingoeca rosetta, Ciona intestinalis, Nematostella vectensis, Amphimedon queenslandica, Lottia gigantea, Schizosaccharomyces pombe, Neurospora crassa, Dictyostelium discoideum, Giardia intestinalis, and Saccharomyces cerevisiae. The sequences for the first eight organisms were aligned against the model EB1 vertebrate sequences. A separate alignment of the last organisms was generated. Both alignments were made in ClustalX. The amino acids are colored based on percent identity in Jalview.
Mutagenesis and purification
Highly conserved surface residues were selected either in the known MT binding interface as determined from previous EM and mutagenesis [19] or in the face opposite the MT interface. Amino acids were either mutated to an alanine or a charged amino acid that resulted in a charge reversal. Mutants were generated through site-directed mutagenesis (Agilent QuikChange II) and confirmed by DNA sequencing. Proteins (WT or mutant) were purified through previously described methods [32]. Briefly, non-tagged proteins were isolated using classical ion-exchange techniques. Lysates were exchanged on to sequential cation-exchange and anion-exchange columns with a desalting column in between. The protein was dialyzed into PEM buffer [100 mM Pipes, 1 mM ethylene glycol bis(β-aminoethyl ether) N,N′-tetraacetic acid (EGTA), and 2 mM MgCl2, pH 6.8], flash frozen, and stored at −80 °C. EB1 proteins for the low-salt experiments were dialyzed into TK buffer (10 mM Tris–HCl, 50 mM KCl, and 1 mM DTT, pH 7.5).
APC-C1 was bacterially expressed and purified using a nickel-NTA column [25]. APC-C1 was dialyzed in to PEM buffer, flash frozen, and stored at −80 °C.
Actin was purified from rabbit muscle acetone powder through filament cycling [33] and stored in calcium buffer G (2 mM Tris–HCl, 0.2 mM ATP, 0.5 mM DTT, 0.1 mM CaCl2, and 1 mM sodium azide at pH 8). For F-actin studies, the globular actin G-actin was converted into MG-actin by adding 5 mM MgCl2 and 0.2 mM EGTA for 5 min at room temperature. To polymerize the actin, we added 50 mM KCl, 1 mM MgCl2, 1 mM EGTA, and 10 mM imidazole-HCl (pH 7) and allowed them to incubate 1 h at room temperature. After polymerization, 0.8 μM phalloidin was added to stabilize the filaments.
For Fig. 1c, actin was purchased from Cytoskeleton Inc. (Denver, CO) and stored in G buffer (10 mM Tris–HCl, 0.1 mM CaCl2, 0.2 mM ATP, and 0.5 mM DTT at pH 7.5). Actin was centrifuged (200,000g, 15 min at 4 °C) immediately prior to use to remove any aggregates.
Tubulin was purified as previously described [10]; briefly, the tubulin was purified form porcine brain through two rounds of polymerization and de-polymerization. MTs were polymerized with Taxol (paclitaxel; Sigma) as previously described [10]. Tubulin and MTs were frozen and stored at −80 °C.
To measure EB1 (calculated as EB1 monomer) and MT (calculated as tubulin dimer) concentration, we used BSA standard curves in conjunction with Bradford dye (Bio-Rad). To determine the actin concentration, we measured an optical density at 290 nm and used an extinction coefficient of 26,600 M−1 cm−1.
Binding studies
Low-salt F-actin binding
Initial experiments utilized 2 μM F-actin and 2 μM any other proteins (EB1, EB1 fragments, or controls as indicted, stored in TK buffer, see above). For the initial co-sedimentation assays, proteins as indicated were incubated with F-actin in Mg-G buffer (10 mM Tris–HCl, 0.1 mM MgCl2, 0.2 mM ATP, and 0.5 mM DTT at pH 7.5) in the presence of phalloidin at room temperature for 1 h. After centrifugation (200,000g), supernatant (top 50 μl) and pellet fractions were separated by SDS-PAGE. The bottom 50-μl supernatant was discarded and not used for analysis.
Salt sensitivity
EB1248 was diluted to 2 μM in calcium buffer G along with 7 μM F-actin in the presence of 0.8 μM phalloidin. The amount of KCl added to each reaction was calculated so that the total amount of KCl from the F-actin, EB1, and buffer equaled 25 mM, 50 mM, 75 mM, 125 mM, or 175 mM. The reactions were incubated for 25 min at room temperature and then centrifuged at 150,000g for 15 min at 22 °C to sediment the F-actin. The supernatant and pellet fractions were separated as above and analyzed by SDS-PAGE. Densitometry (ImageJ) was used to determine the fraction of EB1248 bound; in some experiments, a small amount of EB1 sedimented by itself and this amount was subtracted from the fraction of EB1 bound to F-actin.
MT and actin comparison study
For the MT binding experiments, EB1FL WT or mutant proteins (2 μM) were incubated with 5 μM MTs stabilized with 10 μM Taxol. For the F-actin binding experiments, EB1FL WT or mutant proteins (2 μM) and APC-C1 (2 μM; added to release EB1 auto-inhibition) were incubated with 7 μM F-actin stabilized with 0.8 μM phalloidin. In all the comparison study experiments, the binding reactions were incubated in PEM 50 (50 mM Pipes, 2 mM MgCl2, and 1 mM EGTA at pH 6.8) for 25 min at 37 °C. Proteins were then centrifuged at 150,000g for 15 min at 37 °C to sediment any filaments (F-actin, MTs, or both) present in the reaction. The supernatant and pellet fractions were separated and analyzed by SDS-PAGE. Densitometry (ImageJ) was used to determine the fraction of EB1FL WT or mutant bound to MTs or F-actin. Experiments with EB1FL WT or mutant proteins by themselves were included to ensure that the proteins did not sediment on their own. Both F-actin and MT concentrations were chosen so that approximately 50% of the EB1FL WT was bound in each case. The fraction bound data were normalized against the fraction of EB1FL WT bound under the indicated conditions.
Labeled MTs for microscopy
A total of 20 μM pure tubulin, 2 μM rhodamine-labeled tubulin (Cytoskeleton Inc.), and 1 mM GTP were incubated in BRB80 (80 mM Pipes, 2 mM MgCl2, and 0.5 mM EGTA at pH 6.9) and polymerized with Taxol as previously described [10]. After incubation, the MTs were centrifuged (200,000g, 15 min at 37 °C). The MT pellet was washed with PEM and then re-suspended by half-reaction volume of PEM buffer with addition of 10 μM Taxol. The concentration of polymerized rhodamine-labeled MTs was measured by Bradford assay, frozen by liquid nitrogen, and stored at −80 °C.
Microscopy
F-actin and MT bundling were observed by fluorescence microscopy. A total of 10 μM Taxol, 1.5 μM Alexa-488-phalloidin, and 3.5 μM unlabeled phalloidin were incubated with 5.0 μM G-actin and/or 0.5 μM rhodamine MTs in the presence or absence of 1 μM EB1 (EB1248 or EB1FL as indicated) for 25 min at room temperature in PEM buffer. Calcium buffer G and PEM were added as buffer controls. EB1FL was used as a negative control. Experiments were performed in a blinded manner to prevent biased data interpretation (microscopist did not know the identity of the samples being analyzed). To visualize actin and MT bundles, we used a 60× objective, 1.5× optivar, and 1.4 N.A. on a TE2000 inverted microscope (Nikon). Images were obtained by a Hamamatsu CMOS camera controlled by NIS-Elements BR 413.04 64-bit software (Nikon). Data were further processed using ImageJ (National Institutes of Health).
Supplementary Material
Acknowledgments
The authors wish to thank the members of the Goodson laboratory for critical evaluation of the manuscript and the members of both the Kovar and Gardner laboratories for experimental advice. We would like to thank Dr. Erin Jonasson for both her advice and encouragement throughout the project.
Funding Sources: American Heart Association Predoctoral Fellowship (14PRE20490078) to E.O.A. and National Science Foundation Grant (NSF MCB 1244593) to H.V.G.
Abbreviations
- MT
microtubule
- EM
electron microscopy
- APC
adenomatous polyposis coli
- EGTA
ethylene glycol bis(β-aminoethyl ether) N,N′-tetraacetic acid
Appendix A. Supplementary data
Supplementary data to this article can be found online at http://dx.doi.org/10.1016/j.jmb.2016.01.032.
References
- 1.Rodriguez OC, Schaefer AW, Mandato CA, Forscher P, Bement WM, Waterman-storer CM. Conserved microtubule–actin interactions in cell movement and morphogenesis. Nat Cell Biol. 2003;5:599–609. doi: 10.1038/ncb0703-599. [DOI] [PubMed] [Google Scholar]
- 2.Zumbrunn J, Kinoshita K, Hyman AA, Näthke IS. Binding of the adenomatous polyposis coli protein to microtubules increases microtubule stability and is regulated by GSK3β phosphorylation. Curr Biol. 2001;11:44–49. doi: 10.1016/s0960-9822(01)00002-1. http://dx.doi.org/10.1016/S0960-9822(01)00002-1. [DOI] [PubMed] [Google Scholar]
- 3.Wittmann T, Waterman-Storer CM. Spatial regulation of CLASP affinity for microtubules by Rac1 and GSK3B in migrating epithelial cells. J Cell Biol. 2005;169:929–939. doi: 10.1083/jcb.200412114. http://dx.doi.org/10.1083/jcb.200412114. [DOI] [PMC free article] [PubMed] [Google Scholar]
- 4.Bashour AM, Fullerton AT, Hart MJ, Bloom GS. IQGAP1, a Rac- and Cdc42-binding protein, directly binds and cross-links microfilaments. J Cell Biol. 1997;137:1555–1566. doi: 10.1083/jcb.137.7.1555. ( http://www.pubmedcentral.nih.gov/articlerender.fcgi?artid=2137827&tool=pmcentrez&rendertype=abstract) [DOI] [PMC free article] [PubMed] [Google Scholar]
- 5.Suozzi KC, Wu X, Fuchs E. Spectraplakins: Master orchestrators of cytoskeletal dynamics. J Cell Biol. 2012;197:465–475. doi: 10.1083/jcb.201112034. http://dx.doi.org/10.1083/jcb.201112034. [DOI] [PMC free article] [PubMed] [Google Scholar]
- 6.Bartolini F, Ramalingam N, Gundersen GG. Actin-capping protein promotes microtubule stability by antagonizing the actin activity of mDia1. Mol Biol Cell. 2012;23:4032–4040. doi: 10.1091/mbc.E12-05-0338. http://dx.doi.org/10.1091/mbc.E12-05-0338. [DOI] [PMC free article] [PubMed] [Google Scholar]
- 7.Bartolini F, Moseley JB, Schmoranzer J, Cassimeris L, Goode BL, Gundersen GG. The formin mDia2 stabilizes microtubules independently of its actin nucleation activity. J Cell Biol. 2008;181:523–536. doi: 10.1083/jcb.200709029. http://dx.doi.org/10.1083/jcb.200709029. [DOI] [PMC free article] [PubMed] [Google Scholar]
- 8.Akhmanova A, Hoogenraad CC. Microtubule plus-end-tracking proteins: Mechanisms and functions. Curr Opin Cell Biol. 2005;17:47–54. doi: 10.1016/j.ceb.2004.11.001. http://dx.doi.org/10.1016/j.ceb.2004.11.001. [DOI] [PubMed] [Google Scholar]
- 9.Vaughan KT. TIP maker and TIP marker: EB1 as a master controller of microtubule plus ends. J Cell Biol. 2005;171:197–200. doi: 10.1083/jcb.200509150. http://dx.doi.org/10.1083/jcb.200509150. [DOI] [PMC free article] [PubMed] [Google Scholar]
- 10.Zhu ZC, Gupta KK, Slabbekoorn AR, Paulson BA, Folker ES, Goodson HV. Interactions between EB1 and microtubules: Dramatic effect of affinity tags and evidence for cooperative behavior. J Biol Chem. 2009;284:32651–32661. doi: 10.1074/jbc.M109.013466. http://dx.doi.org/10.1074/jbc.M109.013466. [DOI] [PMC free article] [PubMed] [Google Scholar]
- 11.Sjöblom B, Ylänne J, Djinović-Carugo K. Novel structural insights into F-actin-binding and novel functions of calponin homology domains. Curr Opin Struct Biol. 2008;18:702–708. doi: 10.1016/j.sbi.2008.10.003. http://dx.doi.org/10.1016/j.sbi.2008.10.003. [DOI] [PubMed] [Google Scholar]
- 12.Sundin LJR, Guimaraes GJ, Deluca JG. The NDC80 complex proteins Nuf2 and Hec1 make distinct contributions to kinetochore-microtubule attachment in mitosis. Mol Biol Cell. 2011;22:759–768. doi: 10.1091/mbc.E10-08-0671. http://dx.doi.org/10.1091/mbc.E10-08-0671. [DOI] [PMC free article] [PubMed] [Google Scholar]
- 13.Moseley JB, Bartolini F, Okada K, Wen Y, Gundersen GG, Goode BL. Regulated binding of adenomatous polyposis coli protein to actin. J Biol Chem. 2007;282:12661–12668. doi: 10.1074/jbc.M610615200. http://dx.doi.org/10.1074/jbc.M610615200. [DOI] [PubMed] [Google Scholar]
- 14.Applewhite DA, Grode KD, Keller D, Zadeh AD, Slep KC, Rogers SL. The spectraplakin short stop is an actin-microtubule cross-linker that contributes to organization of the microtubule network. Mol Biol Cell. 2010;21:1714–1724. doi: 10.1091/mbc.E10-01-0011. http://dx.doi.org/10.1091/mbc.E10. [DOI] [PMC free article] [PubMed] [Google Scholar]
- 15.Schober JM, Cain JM, Komarova YA, Borisy GG. Migration and actin protrusion in melanoma cells are regulated by EB1 protein. Cancer Lett. 2009;284:30–36. doi: 10.1016/j.canlet.2009.04.007. http://dx.doi.org/10.1016/j.canlet.2009.04.007. [DOI] [PubMed] [Google Scholar]
- 16.King JS, Veltman DM, Georgiou M, Baum B, Insall RH. SCAR/WAVE is activated at mitosis and drives myosin-independent cytokinesis. J Cell Sci. 2010;123:2246–2255. doi: 10.1242/jcs.063735. http://dx.doi.org/10.1242/jcs.063735. [DOI] [PMC free article] [PubMed] [Google Scholar]
- 17.Rehberg M, Graf R. Dictyostelium EB1 is a genuine centrosomal component required for proper spindle formation. Mol Biol Cell. 2002;13:2301–2310. doi: 10.1091/mbc.E02-01-0054. http://dx.doi.org/10.1091/mbc.E02. [DOI] [PMC free article] [PubMed] [Google Scholar]
- 18.Hayashi I, Wilde A, Mal TK, Ikura M. Structural basis for the activation of microtubule assembly by the EB1 and p150Glued complex. Mol Cell. 2005;19:449–460. doi: 10.1016/j.molcel.2005.06.034. http://dx.doi.org/10.1016/j.molcel.2005.06.034. [DOI] [PubMed] [Google Scholar]
- 19.Maurer SP, Fourniol FJ, Bohner G, Moores CA, Surrey T. EBs recognize a nucleotide-dependent structural cap at growing microtubule ends. Cell. 2012;149:371–382. doi: 10.1016/j.cell.2012.02.049. http://dx.doi.org/10.1016/j.cell.2012.02.049. [DOI] [PMC free article] [PubMed] [Google Scholar]
- 20.Slep KC, Vale RD. Structural basis of microtubule plus end tracking by XMAP215, CLIP-170, and EB1. Mol Cell. 2007;27:976–991. doi: 10.1016/j.molcel.2007.07.023. http://dx.doi.org/10.1016/j.molcel.2007.07.023. [DOI] [PMC free article] [PubMed] [Google Scholar]
- 21.Hayashi I, Ikura M. Crystal structure of the amino-terminal microtubule-binding domain of end-binding protein 1 (EB1) J Biol Chem. 2003;278:36430–36434. doi: 10.1074/jbc.M305773200. http://dx.doi.org/10.1074/jbc.M305773200. [DOI] [PubMed] [Google Scholar]
- 22.Zhang R, Alushin GM, Brown A, Nogales E. Mechanistic origin of microtubule dynamic instability and its modulation by EB proteins. Cell. 2015;162:849–859. doi: 10.1016/j.cell.2015.07.012. http://dx.doi.org/10.1016/j.cell.2015.07.012. [DOI] [PMC free article] [PubMed] [Google Scholar]
- 23.Komarova Y, De Groot CO, Grigoriev I, Gouveia SM, Munteanu EL, Schober JM, et al. Mammalian end binding proteins control persistent microtubule growth. J Cell Biol. 2009;184:691–706. doi: 10.1083/jcb.200807179. http://dx.doi.org/10.1083/jcb.200807179. [DOI] [PMC free article] [PubMed] [Google Scholar]
- 24.Gimona M, Mital R. The single CH domain of calponin is neither sufficient nor necessary for F-actin binding. J Cell Sci. 1998;111(Pt 1):1813–1821. doi: 10.1242/jcs.111.13.1813. [DOI] [PubMed] [Google Scholar]
- 25.Gupta KK, Alberico EO, Näthke IS, Goodson HV. Promoting microtubule assembly: A hypothesis for the functional significance of the +TIP network. Bioessays. 2014;36:818–826. doi: 10.1002/bies.201400029. http://dx.doi.org/10.1002/bies.201400029. [DOI] [PubMed] [Google Scholar]
- 26.Dikovskaya D, Khoudoli G, Newton IP, Chadha GS, Klotz D, Visvanathan A, et al. The adenomatous polyposis coli protein contributes to normal compaction of mitotic chromatin. PLoS One. 2012;7 doi: 10.1371/journal.pone.0038102. http://dx.doi.org/10.1371/journal.pone.0038102. [DOI] [PMC free article] [PubMed] [Google Scholar]
- 27.Abraham VC, Krishnamurthi V, Taylor DL, Lanni F. The actin-based nanomachine at the leading edge of migrating cells. Biophys J. 1999;77:1721–1732. doi: 10.1016/S0006-3495(99)77018-9. http://dx.doi.org/10.1016/S0006-3495(99)77018-9. [DOI] [PMC free article] [PubMed] [Google Scholar]
- 28.Koestler SA, Rottner K, Lai F, Block J, Vinzenz M, Small JV. F- and G-actin concentrations in lamellipodia of moving cells. PLoS One. 2009;4:e4810. doi: 10.1371/journal.pone.0004810. http://dx.doi.org/10.1371/journal.pone.0004810. [DOI] [PMC free article] [PubMed] [Google Scholar]
- 29.Akhmanova A, Steinmetz MO. Tracking the ends: A dynamic protein network controls the fate of microtubule tips. Nat Rev Mol Cell Biol. 2008;9:309–322. doi: 10.1038/nrm2369. http://dx.doi.org/10.1038/nrm2369. [DOI] [PubMed] [Google Scholar]
- 30.Chesarone M, Dupage AG, Goode B. Unleashing formins to remodel the actin and microtubule cytoskeletons. Nat Rev Mol Cell Biol. 2010;11:62–74. doi: 10.1038/nrm2816. [DOI] [PubMed] [Google Scholar]
- 31.Pettersen EF, Goddard TD, Huang CC, Couch GS, Greenblatt DM, Meng EC, et al. UCSF Chimera—A visualization system for exploratory research and analysis. J Comput Chem. 2004;25:1605–1612. doi: 10.1002/jcc.20084. http://dx.doi.org/10.1002/jcc.20084. [DOI] [PubMed] [Google Scholar]
- 32.Alberico EO, Lyons DF, Murphy RJ, Philip JT, Duan AR, Correia JJ, et al. Biochemical evidence that human EB1 does not bind preferentially to the microtubule seam. Cytoskeleton (Hoboken) 2013;327:317–327. doi: 10.1002/cm.21108. http://dx.doi.org/10.1002/cm.21108. [DOI] [PMC free article] [PubMed] [Google Scholar]
- 33.Kovar DR, Kuhn JR, Tichy AL, Pollard TD. The fission yeast cytokinesis formin Cdc12p is a barbed end actin filament capping protein gated by profilin. J Cell Biol. 2003;161:875–887. doi: 10.1083/jcb.200211078. http://dx.doi.org/10.1083/jcb.200211078. [DOI] [PMC free article] [PubMed] [Google Scholar]
Associated Data
This section collects any data citations, data availability statements, or supplementary materials included in this article.