Abstract
Since the year 2000, a concerted campaign against malaria has led to unprecedented levels of intervention coverage across sub-Saharan Africa. Understanding the effect of this control effort is vital to inform future control planning. However, the effect of malaria interventions across the varied epidemiological settings of Africa remains poorly understood owing to the absence of reliable surveillance data and the simplistic approaches underlying current disease estimates. Here we link a large database of malaria field surveys with detailed reconstructions of changing intervention coverage to directly evaluate trends from 2000 to 2015 and quantify the attributable effect of malaria disease control efforts. We found that Plasmodium falciparum infection prevalence in endemic Africa halved and the incidence of clinical disease fell by 40% between 2000 and 2015. We estimate that interventions have averted 663 (542–753 credible interval) million clinical cases since 2000. Insecticide-treated nets, the most widespread intervention, were by far the largest contributor (68% of cases averted). Although still below target levels, current malaria interventions have substantially reduced malaria disease incidence across the continent. Increasing access to these interventions, and maintaining their effectiveness in the face of insecticide and drug resistance, should form a cornerstone of post-2015 control strategies.
In the midst of an escalating malaria public health disaster, the year 2000 marked a turning point in multilateral commitment to malaria control in sub-Saharan Africa, catalysed by the Roll Back Malaria initiative and the wider development agenda around the United Nations Millennium Development Goals (MDGs). The 15 years since have seen international financing for malaria control increase approximately twentyfold1, enabling widespread but uneven scale-up of coverage of the main contemporary malaria control interventions: insecticide-treated bednets (ITNs), indoor residual spraying (IRS), and prompt treatment of clinical malaria cases with artemisinin-based combination therapy (ACT).
As part of this reinvigorated effort, a series of international goals were set with a target year of 2015, in particular the MDG to “halt by 2015 and begin to reverse the incidence of malaria” and the more ambitious target defined later by the World Health Organization (WHO) of reducing case incidence by 75% relative to 2000 levels2. While these targets were important for motivating action and mobilising funds, no explicit plan was put in place to reliably measure progress towards them. Now that the benchmark year of 2015 has been reached, the international community must define a post-2015 agenda for malaria control that will shape the technical, financial, and political landscape in which the battle against the disease will be fought. This agenda is being defined around two key policy initiatives for the 2016-2030 period: the Global Technical Strategy3 and Action and Investment to Defeat Malaria4, led by WHO and the Roll Back Malaria Partnership. In this context, it is imperative that the achievements of 2015 can be robustly evaluated and, more broadly, that the patterns, causes, and implications of changing malaria endemicity over the past 15 years can be understood to inform an optimal strategy for the future.
The effect of malaria control is poorly understood
Despite its importance, current knowledge on the nature and drivers of changing endemicity in sub-Saharan Africa is remarkably weak. National health records in 32 highly endemic countries (together accounting for about 90% of the global malaria burden) are considered inadequate to assess trends in malaria cases1. This stems from low care-seeking rates (many malaria cases are not seen at formal health facilities), incomplete record keeping and curation (many recorded cases are never captured in surveillance databases), and historically poor access to parasitological diagnosis (malaria cases were often diagnosed presumptively with poor specificity). As systems have begun to improve, for example owing to greater use of rapid diagnostic testing in health facilities1, these biases have been mitigated, but that presents further challenges for comparison of data through time and evaluation of trends5. For these countries, the WHO has previously adopted a “cartographic” burden measurement approach whereby a map of climatic suitability for malaria transmission is first used to stratify likely incidence rates across the continent, with these rates then progressively downgraded as intervention coverage increases according to effect sizes measured in randomized control trials. One acknowledged limitation of this approach is its reliance on the central assumption that effects observed in a limited number of short-term trials can be extrapolated to sustained continent-wide implementation. This assumption has never been validated beyond local or national-level analyses6. In reality, the individual or combined efficacy of interventions will vary by setting and be contingent on many local factors including vector ecology, health systems, and coverage levels7,8. Other studies have investigated effects using cross-sectional community surveys7,9. These studies capture a wider range of real-world settings, but yield only a single pooled estimate across diverse disease transmission settings that, again, has unknown validity when extrapolated across Africa.
Since its first use, component parts of the cartographic burden framework have incrementally improved. Climatic suitability maps have been superseded by empirical endemicity maps10-12 that use model-based geostatistics to create surfaces of risk based on thousands of geolocated cross-sectional surveys measuring infection prevalence (termed Plasmodium falciparum parasite rate, PfPR). Improvements have also been made in the estimation of clinical incidence rates as a function of PfPR13-15, allowing clinical incidence rates, which are notoriously difficult to measure in the field, to be estimated geographically using mapped surfaces of PfPR14,16. All these earlier studies, however, preceded the most intense period of control effort (from 2010 to the present), and none were designed to formally evaluate temporal changes in disease burden or explicitly consider the effect of interventions.
A framework to measure malaria risk in Africa
Here, we provide the first formal quantification, with rigorously defined uncertainty, of P. falciparum infection prevalence and disease incidence across sub-Saharan Africa from the year 2000 to the benchmark year of 2015, and of the role the major control interventions have had in causing these changes. Our approach evaluates not only point estimates, but also presents a full treatment of uncertainty through a Bayesian hierarchical model. Components contributing to uncertainty in outputs included the sample size and spatiotemporal density of PfPR surveys, uncertainty in the fitted relationships between PfPR and the suite of environmental and intervention covariates, uncertainty in the input data on observed clinical incidence rates, and uncertainty in the mechanistic model parameters defining the prevalence-incidence relationship. By linking all components together in a Bayesian framework, these distinct sources of uncertainty are formally propagated through the predictive model and represented as predictive posterior distributions around all output results.
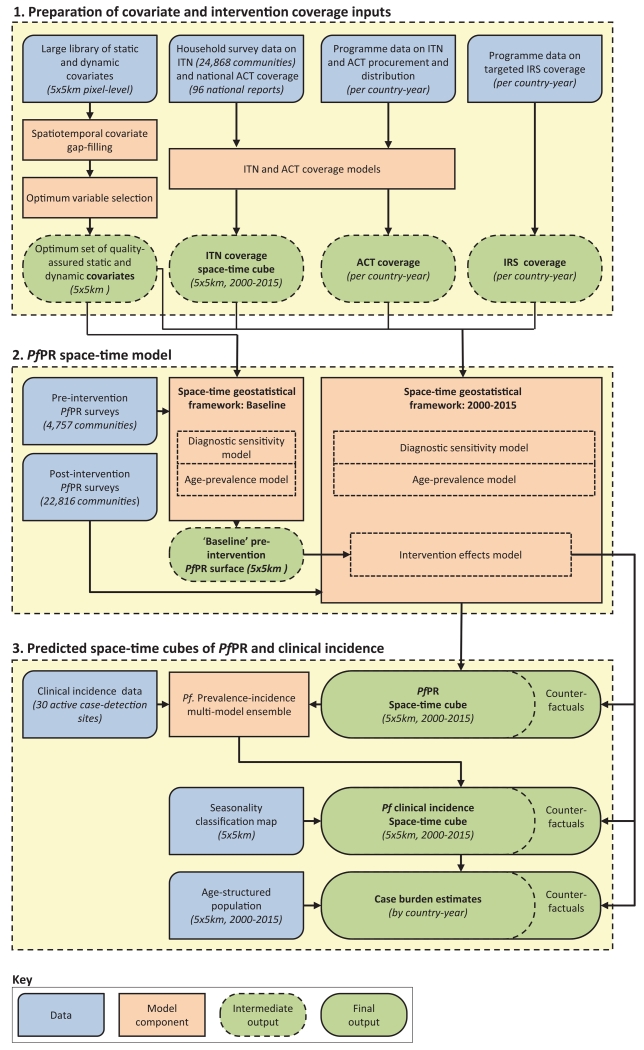
The analytical framework is shown schematically in Extended Data Fig. 1. Data on ITN use and access to ACTs from over one million households were combined with national malaria control programme data1 on ITN, ACT, and IRS provision to develop time-series models of coverage of these interventions within each country1. These were combined within a spatiotemporal Bayesian geostatistical model17 with PfPR data from 27,573 georeferenced population clusters between 1995 and 2014, along with an optimised suite of temporally dynamic environmental and sociodemographic covariates18. The model adjusted PfPR observations by age19, season, and type of diagnostic used, and fitted flexible functional forms to capture the effect of each intervention on declining PfPR as a function of coverage reached and the starting (pre-intervention) PfPR in 2000 (Extended Data Fig. 2). Following earlier work10,11,19 we chose to model PfPR in the 2-up-to-10 year age range, since this is associated with a plateau in the age-prevalence relationship and thus acts as a standardised comparison. The model was used to predict a spatio-temporal “cube” of age-structured PfPR at 5×5 km resolution across all endemic African countries for each year from 2000 to 2015. Using the empirically observed effect of each intervention, it was possible to generate counterfactual maps estimating contemporary PfPR under hypothetical scenarios without interventions. We chose to evaluate this ‘no intervention’ counterfactual to allow estimation of the total effect of interventions.
For the 32 high-burden countries of Africa, an ensemble model was developed to predict incidence rates of clinical malaria as a function of community PfPR20. This brought together three independently developed mathematical malaria transmission models14,15,21 that were re-fitted to a common data set of age-structured clinical incidence measured longitudinally at 30 sites22, allowing an ensemble model to be defined to predict age-specific incidence at all locations given prevalence, seasonality, level of treatment, and probable immune status of populations. We used a definition of ‘clinical malaria’ as an attributable febrile episode (body temperature in excess of 37.5 C), censored by a 30-day window (that is, multiple bouts of symptoms occurring within the same 30-day period are counted as a single episode). The ensemble model was then combined with the PfPR cube and underlying population surfaces23 to predict clinical incidence by country and year for both the real and counterfactual scenarios. For the remaining eleven low-burden countries in Africa (accounting for around 3% of cases) where national reporting systems are more robust, we generated clinical incidence estimates with an existing approach that uses national case reports while adjusting for care-seeking behaviour, low diagnostic testing rates, and underreporting1,24.
Infection prevalence and clinical incidence decline
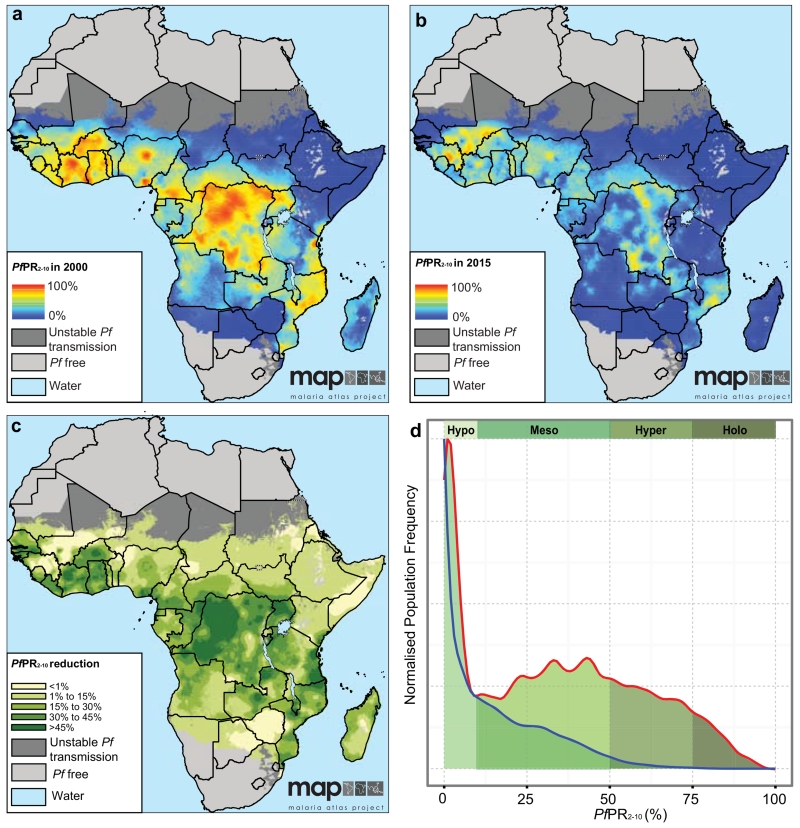
We found that infection prevalence in children age 2-up-to-10 across endemic Africa has halved since the year 2000 (population-weighted mean PfPR2-10: year 2000 = 33%, 95% credible interval 31–35%; year 2015 = 16%, 14–19%), with around three-quarters of this decline occurring after 2005. Across Africa the rate of decline in PfPR2-10 rose steadily to a peak yearly decline of 9% in 2011, after which there was a slowing between 2011 and 2013 followed by resurgence in recent years back to the current rate of 5% annual decline in PfPR. Our predicted surfaces of PfPR2-10 demonstrate the geographical pattern of this reduction across the continent (Fig. 1a–c), with hyper- or holo-endemic transmission (where PfPR exceeds 50% and 75%, respectively, see Fig. 1d) common in 2000 across large swathes of central and western Africa, but limited to isolated pockets by 2015. This decline meant a marked shift in the distribution of exposure level (Fig. 1d), with the proportion of the endemic population exposed to hyper- or holo-endemic malaria falling from 33% (30-37%) to just 9% (5-13%) (Table 1). Crucially, for the feasibility of post-2015 elimination efforts, the population of stable endemic Africa experiencing very low transmission (Pf PR2-10 less than 1%) has increased six-fold since 2000 (far outpacing the 50% underlying population growth over the period) meaning there are now 121 (110-133) million people living in settings where elimination campaigns can be considered.
Figure 1. Changes in infection prevalence 2000–2015.
a, PfPR2-10 for the year 2000 predicted at 5×5 km resolution. b, PfPR2-10 for the year 2015 predicted at 5×5 km resolution. c, Absolute reduction in PfPR2-10 from 2000 to 2015. d, Smoothed density plot showing the relative distribution of endemic populations by PfPR2-10 in the years 2000 (red line) and 2015 (blue line). The frequencies on the vertical axis have been scaled to make the densities visually comparable. The classical endemicity categories are shown for reference in green shades. Results shown in all panels are derived from a Bayesian geostatistical model fitted to: n = 27,573 PfPR survey points; n = 24,868 ITN survey points; n = 96 national survey reports of ACT coverage; n = 688 country-year reports on ITN, ACT and IRS distribution by national programs; and n = 20 environmental and socioeconomic covariate grids. Maps in a–c are available from the Malaria Atlas Project (http://www.map.ox.ac.uk/) under the CreativeCommons Attribution 3.0 Unported License.
Table 1. Changing distribution of malaria endemicity across stable endemic Africa, 2000 to 2015.
| Population (%) | Area (%) | |||||
|---|---|---|---|---|---|---|
| Endemicity class | 2000 | 2015 | Change (%) | 2000 | 2015 | Change (%) |
| Holo (PfPR2-10 ≥75%) | 11.57 | 1.32 | −88.57 | 11.81 | 1.38 | −88.32 |
| Hyper (PfPR2-10 50–75%) | 21.51 | 7.46 | −65.31 | 20.18 | 7.88 | −60.93 |
| Meso (PfPR2-10 10–50%) | 41.32 | 42.41 | +2.64 | 40.98 | 41.06 | +0.19 |
| Hypo (PfPR2-10 <10%) | 25.60 | 48.80 | +90.63 | 27.02 | 49.67 | +83.84 |
| Total | 100.00 | 100.00 | 100.00 | 100.00 | ||
| Pre-elimination or eliminating (PfPR2-10<1%) | 3.82 | 13.61 | +255.93 | 3.48 | 11.39 | +227.51 |
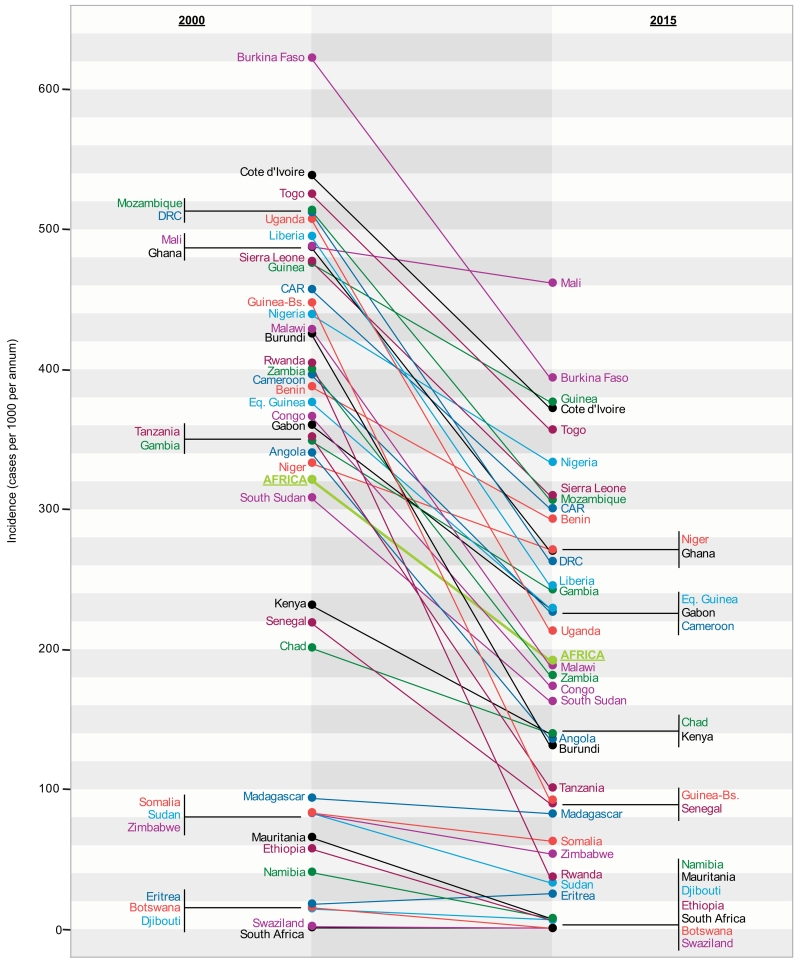
We estimated that there were 187 (132–259) million clinical cases of P. falciparum malaria in Africa in 2015. Case incidence declined by 40% from 321 (253–427) per 1000 persons per annum in 2000 to 192 (135–265) per 1000 persons p.a. in 2015, with all but one of the 43 mainland endemic countries meeting the MDG target of reversing incidence trends by 2015, 19 (17-25) achieving a >50% decline, and 7 (6-7) declining by > 75% (Extended Data Fig. 3).
The model has been able to predict changes in mean PfPR across Africa with considerable precision, reflecting the increasing abundance of PfPR surveys, their relatively large signal-to-noise ratio, the adjustments for diagnostic type, and the informative covariate suite, all of which contributed to strong predictive performance of the geostatistical model. Credible intervals around the continental clinical incidence estimates were proportionately much larger and this reflected primarily the residual uncertainty around the modelled relationship between infection prevalence and clinical incidence.
Attributable effect of malaria control interventions
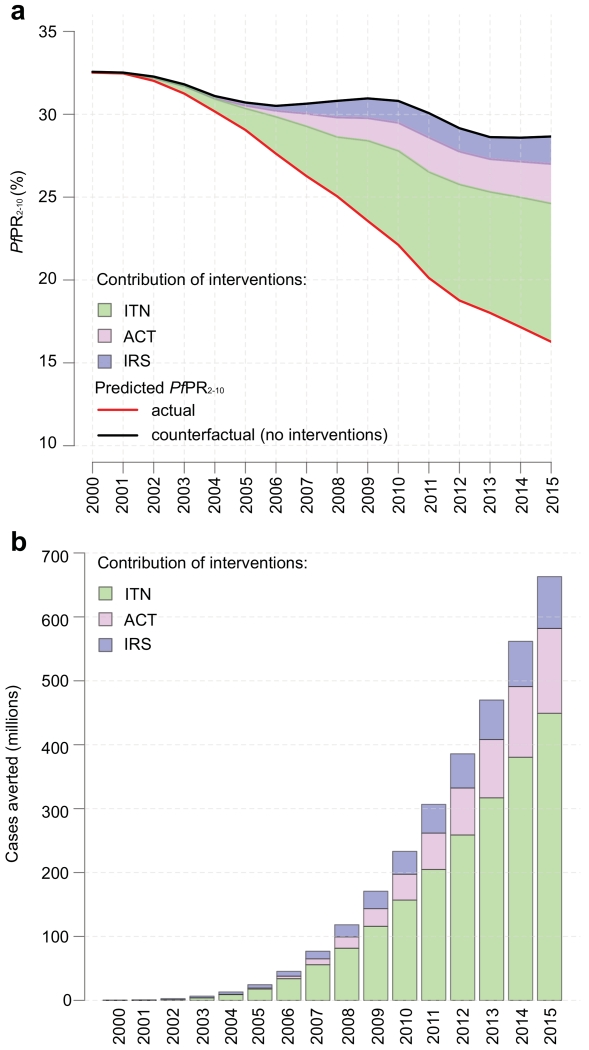
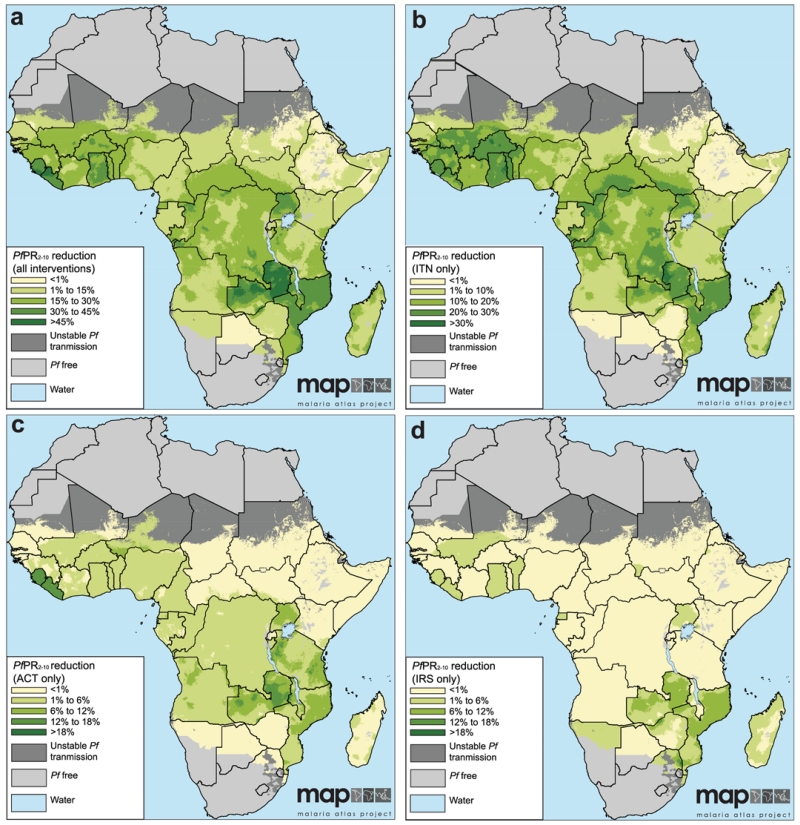
Changes in prevalence largely followed patterns of increasing ITN coverage, and ITNs were by far the most important intervention across Africa, accounting for an estimated 68 (62-72)% of the declines in PfPR seen by 2015 (Fig. 2a). We estimated ACT and IRS contributed 19 (15-24)% and 13 (11-16)% respectively, although these interventions had larger proportional contributions where their coverage was high (Extended Data Fig. 4). It is important to emphasise that these proportional contributions do not necessarily reflect the comparative effectiveness of different intervention strategies but, rather, are driven primarily by how early and at what scale the different interventions were deployed. In total, we estimated that malaria control interventions have averted 663 (542–753) million clinical cases since 2000, of which 68 (62-73)%, 22 (17-28)% and 10 (5-14)% were contributed by ITNs, ACTs, and IRS, respectively (Fig. 2b).
Figure 2. Changing endemicity and effect of interventions 2000–2015.
a, Predicted time series of population-weighted mean PfPR2-10 across endemic Africa. The red line shows the actual prediction and the black line a ‘counterfactual’ prediction in a scenario without coverage by ITNs, ACTs, or IRS. The coloured regions indicate the relative contribution of each intervention in reducing PfPR2-10 throughout the period. b, The predicted cumulative number of clinical cases averted by interventions at the end of each year, with the specific contribution of each intervention distinguished. Results shown in both panels are derived from a Bayesian geostatistical model fitted to: n = 27,573 PfPR survey points; n = 24,868 ITN survey points; n = 96 national survey reports of ACT coverage; n = 688 country-year reports on ITN, ACT and IRS distribution by national programs; and n = 20 environmental and socioeconomic covariate grids. Panel b additionally incorporates data from n = 30 active-case detection studies reporting P. falciparum clinical incidence.
Discussion
Here, for the first time, the rapidly changing landscape of malaria risk in Africa has been quantified across the 15-year span of the Millennium Development Goals. Our approach is primarily data driven, informed by empirical observations in the field rather than theoretical models or extrapolated experimental results. Our modelling framework requires few prior assumptions and allows patterns of change and attribution to be identified with rigorously defined metrics of uncertainty.
We have shown that remarkable and widespread reductions in infection prevalence and case incidence have occurred across Africa since 2000, and that malaria control interventions have been responsible for most of the decline even though they remain well below international targets for universal coverage1. ITNs have had by far the largest effect, but have also been generally present for longer and at higher levels of coverage. IRS and ACTs have both made important contributions to reducing prevalence and incidence where they have been implemented at scale (although it is important to note that the primary role of ACTs is in averting severe disease and death rather than reducing transmission and uncomplicated cases).
This analysis has focused on evaluating changes in infection prevalence and clinical incidence, and we have not addressed effects on malaria mortality. Data on malaria deaths are sparse both spatially and temporally, and concerted efforts must be made to both increase data collection and improve the sensitivity and specificity of malaria death attribution. Integrating the results of the current study with existing malaria mortality estimation processes 1,25,26, to yield improved understanding of lives saved by malaria control, is an immediate priority.
The modelling framework presented here has been necessitated in part by the absence of detailed and robust surveillance data collected routinely by health systems across Africa. The development of more robust surveillance systems to deliver geographically detailed and timely data on malaria incidence will be an increasingly important strand of malaria control efforts, particularly if prevalence continues to decline and identification and rapid response to individual malaria cases becomes critical to achieve elimination.
The efforts of the international community over the past 15 years have reduced malaria risk levels for many millions of people, and large regions of Africa are now in a position to consider elimination strategies. Despite this progress, many millions of people remain at risk of malaria disease and death in Africa in 2015. This analysis demonstrates that current malaria interventions have been highly effective at reducing prevalence and incidence across the continent, and provides strong support for sustaining and increasing access to these interventions as a cornerstone of post-2015 control strategies. This will need to be coupled with a redoubling of efforts to delay the spread of drug and insecticide resistance, tools for addressing the residual transmission that persists in some regions despite high vector control coverage, and concerted local programs to systematically detect and eliminate the remaining parasites.
Extended Data
Extended Data Figure 1. Schematic overview of main input data, model components, and outputs.
Each component is detailed in the Supplementary Information.
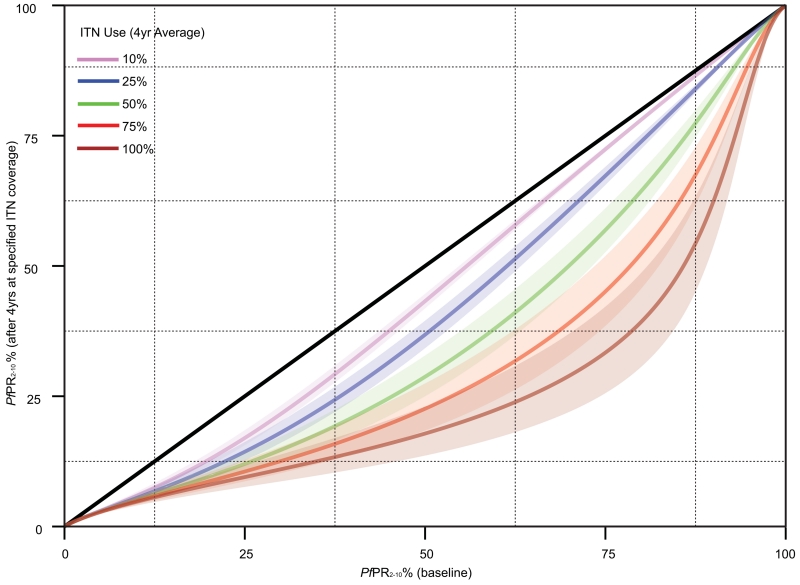
Extended Data Figure 2. Fitted function representing effect of ITNs.
Curves illustrate the predicted effect of ITNs as a function of coverage (five example coverage levels are shown, specified as mean coverage over preceding 4-year period) and baseline transmission. The baseline PfPR is shown on the horizontal axis and the suppressed PfPR given the ITN coverage level shown on the vertical axis. The diagonal line (representing zero ITN effect) is shown in black, and parameter uncertainty around each ITN effect line is illustrated by the semi-transparent envelopes. Results shown are derived from a Bayesian geostatistical model fitted to: n = 27,573 PfPR survey points; n = 24,868 ITN survey points; n = 96 national survey reports of ACT coverage; n = 688 country-year reports on ITN, ACT and IRS distribution by national programs; and n = 20 environmental and socioeconomic covariate grids.
Extended Data Figure 3. Changing incidence rate by country, 2000–2015.
Estimated country-level rates of all-age clinical incidence are shown for 2000 and 2015. For Sudan and South Sudan, we used the post-2011 borders throughout the time period to allow comparability. Results shown are derived from a Bayesian geostatistical model fitted to: n = 27,573 PfPR survey points; n = 24,868 ITN survey points; n = 96 national survey reports of ACT coverage; n = 688 country-year reports on ITN, ACT and IRS distribution by national programs; n = 20 environmental and socioeconomic covariate grids; and n = 30 active-case detection studies reporting P. falciparum clinical incidence.
Extended Data Figure 4. Decline in infection prevalence attributable to main malaria control interventions.
a–d, Each map shows absolute decline in PfPR2-10 between 2000 and 2015 within areas of stable transmission attributable to the combined effect of ITNs, ACTs, and IRS (a); and the individual effect of ITNs (b); ACTs (c); and IRS (d) Note that the colour scaling differs between the panels. Results shown in all panels are derived from a Bayesian geostatistical model fitted to: n = 27,573 PfPR survey points; n = 24,868 ITN survey points; n = 96 national survey reports of ACT coverage; n = 688 country-year reports on ITN, ACT and IRS distribution by national programs; and n = 20 environmental and socioeconomic covariate grids. Maps in this figure are available from the Malaria Atlas Project (http://www.map.ox.ac.uk/) under the Creative Commons Attribution 3.0 Unported License.
Supplementary Material
Acknowledgements
The authors acknowledge assistance from M. Renshaw in providing information from the Roll Back Malaria Harmonization Working Group Programmatic Gap Analysis and other guidance in the interpretation of our results. We thank members of the Roll Back Malaria Monitoring and Evaluation Reference Group and the World Health Organization Surveillance Monitoring and Evaluation Technical expert Group for their feedback and suggestions. We thank C. Burgert of the DHS (Demographic and Health Surveys) Program for her assistance with DHS Survey access and interpretation. PWG is a Career Development Fellow (#K00669X) jointly funded by the UK Medical Research Council (MRC) and the UK Department for International Development (DFID) under the MRC/DFID Concordat agreement and receives support from the Bill and Melinda Gates Foundation (#OPP1068048, #OPP1106023). These grants also support EC, SB, BM, UD, DJW, DB, and AH. The Swiss TPH component was supported through the project #OPP1032350 funded by the BMGF. D.L.S. is funded by the BMGF (OPP1110495). SIH is funded by a Senior Research Fellowship from the Wellcome Trust (#095066), which also supports KEB, and grants from the BMGF (nos. OPP1119467, OPP1106023 and OPP1093011). S.I.H. and D.L.S. also acknowledge funding support from the RAPIDD program of the Science & Technology Directorate, Department of Homeland Security, and the Fogarty International Center, National Institutes of Health. JTG is funded by an MRC Fellowship (#G1002284). EAW and PAE are funded by the Global Good Fund.
Footnotes
Supplementary Information is linked to the online version of the paper at www.nature.com/nature.
References
- 1.World Health Organization . World Malaria Report 2014. World Health Organization; Geneva: 2014. [Google Scholar]
- 2.Roll Back Malaria Partnership. World Health Organization . Global Malaria Action Plan 1 (2000-2015) World Health Organization; Geneva: 2008. [Google Scholar]
- 3.World Health Organization . Global Technical Strategy for Malaria 2016–2030. World Health Organization; Geneva: 2015. [Google Scholar]
- 4.Roll Back Malaria Partnership. World Health Organization . Action and Investment to Defeat Malaria 2016-2030. World Health Organization on behalf of the Roll Back Malaria Partnership Secretariat; Geneva: 2015. [Google Scholar]
- 5.Rowe AK, et al. Caution is required when using health facility-based data to evaluate the health impact of malaria control efforts in Africa. Malar. J. 2009;8:209. doi: 10.1186/1475-2875-8-209. [DOI] [PMC free article] [PubMed] [Google Scholar]
- 6.Chizema-Kawesha E, et al. Scaling up malaria control in Zambia: Progress and impact 2005-2008. Am. J. Trop. Med. Hyg. 2010;83:480–488. doi: 10.4269/ajtmh.2010.10-0035. [DOI] [PMC free article] [PubMed] [Google Scholar]
- 7.Lim SS, et al. Net benefits: a multicountry analysis of observational data examining associations between insecticide-treated mosquito nets and health outcomes. PLoS Med. 2011;8:e1001091. doi: 10.1371/journal.pmed.1001091. [DOI] [PMC free article] [PubMed] [Google Scholar]
- 8.Lengeler C. Insecticide-treated bed nets and curtains for preventing malaria. Cochrane database Syst. Rev. 2004:CD000363. doi: 10.1002/14651858.CD000363.pub2. [DOI] [PubMed] [Google Scholar]
- 9.Giardina F, et al. Effects of vector-control interventions on changes in risk of malaria parasitaemia in sub-Saharan Africa: a spatial and temporal analysis. Lancet Glob. Heal. 2014;2:e601–e615. doi: 10.1016/S2214-109X(14)70300-6. [DOI] [PubMed] [Google Scholar]
- 10.Hay SI, et al. A world malaria map: Plasmodium falciparum endemicity in 2007. PLoS Med. 2009;6:e1000048. doi: 10.1371/journal.pmed.1000048. [DOI] [PMC free article] [PubMed] [Google Scholar]
- 11.Gething PW, et al. A new world malaria map: Plasmodium falciparum endemicity in 2010. Malar. J. 2011;10:378. doi: 10.1186/1475-2875-10-378. [DOI] [PMC free article] [PubMed] [Google Scholar]
- 12.Noor AM, et al. The changing risk of Plasmodium falciparum malaria infection in Africa: 2000-10: a spatial and temporal analysis of transmission intensity. Lancet. 2014;383:1739–47. doi: 10.1016/S0140-6736(13)62566-0. [DOI] [PMC free article] [PubMed] [Google Scholar]
- 13.Patil AP, et al. Defining the relationship between Plasmodium falciparum parasite rate and clinical disease: statistical models for disease burden estimation. Malar. J. 2009;8:186. doi: 10.1186/1475-2875-8-186. [DOI] [PMC free article] [PubMed] [Google Scholar]
- 14.Griffin JT, Ferguson NM, Ghani AC. Estimates of the changing age-burden of Plasmodium falciparum malaria disease in sub-Saharan Africa. Nat. Commun. 2014;5:3136. doi: 10.1038/ncomms4136. [DOI] [PMC free article] [PubMed] [Google Scholar]
- 15.Smith T, et al. Ensemble modeling of the likely public health impact of a pre-erythrocytic malaria vaccine. PLoS Med. 2012;9:e1001157. doi: 10.1371/journal.pmed.1001157. [DOI] [PMC free article] [PubMed] [Google Scholar]
- 16.Hay SI, et al. Estimating the global clinical burden of Plasmodium falciparum malaria in 2007. PLoS Med. 2010;7:14. doi: 10.1371/journal.pmed.1000290. [DOI] [PMC free article] [PubMed] [Google Scholar]
- 17.Diggle P, Ribeiro P. Model-based Geostatistics. Springer; New York: 2007. [Google Scholar]
- 18.Weiss DJ, et al. Re-examining environmental correlates of Plasmodium falciparum malaria endemicity: a data-intensive variable selection approach. Malar. J. 2015;14:68. doi: 10.1186/s12936-015-0574-x. [DOI] [PMC free article] [PubMed] [Google Scholar]
- 19.Smith DL, Guerra CA, Snow RW, Hay SI. Standardizing estimates of the Plasmodium falciparum parasite rate. Malar. J. 2007;6:131. doi: 10.1186/1475-2875-6-131. [DOI] [PMC free article] [PubMed] [Google Scholar]
- 20.Cameron E, et al. Defining the relationship between infection prevalence and clinical incidence of Plasmodium falciparum malaria. Nat. Commun. doi: 10.1038/ncomms9170. in press. [DOI] [PMC free article] [PubMed] [Google Scholar]
- 21.Wenger EA, Eckhoff PA. A mathematical model of the impact of present and future malaria vaccines. Malar J. 2013;12:10. doi: 10.1186/1475-2875-12-126. [DOI] [PMC free article] [PubMed] [Google Scholar]
- 22.Battle KE, et al. Global database of Plasmodium falciparum and P.vivax incidence records. Sci. Data. 2015;2:150012. doi: 10.1038/sdata.2015.12. [DOI] [PMC free article] [PubMed] [Google Scholar]
- 23.WorldPop WorldPop gridded population distributions. 2015 www.worldpop.org.uk.
- 24.Cibulskis RE, Aregawi M, Williams R, Otten M, Dye C. Worldwide incidence of malaria in 2009: estimates, time trends, and a critique of methods. PLoS Med. 2011;8:e1001142. doi: 10.1371/journal.pmed.1001142. [DOI] [PMC free article] [PubMed] [Google Scholar]
- 25.Liu L, et al. Global, regional, and national causes of child mortality in 2000–13, with projections to inform post-2015 priorities: an updated systematic analysis. Lancet. 2014;385:430–440. doi: 10.1016/S0140-6736(14)61698-6. [DOI] [PubMed] [Google Scholar]
- 26.Global, regional, and national age–sex specific all-cause and cause-specific mortality for 240 causes of death, 1990–2013: a systematic analysis for the Global Burden of Disease Study 2013. Lancet. 2014;385:117–171. doi: 10.1016/S0140-6736(14)61682-2. [DOI] [PMC free article] [PubMed] [Google Scholar]
Associated Data
This section collects any data citations, data availability statements, or supplementary materials included in this article.


