

Abstract
Cytopathic effects are currently believed to contribute to hepatitis C virus (HCV)-induced liver injury and are readily observed in Huh7.5 cells infected with the JFH-1 HCV strain, manifesting as apoptosis highly correlated with growth arrest. Reactive oxygen species, which are induced by HCV infection, have recently emerged as activators of AMP-activated protein kinase. The net effect is ATP conservation via on/off switching of metabolic pathways that produce/consume ATP. Depending on the scenario, this can have either pro-survival or pro-apoptotic effects. We demonstrate reactive oxygen species-mediated activation of AMP-activated kinase in Huh7.5 cells during HCV (JFH-1)-induced growth arrest. Metabolic labeling experiments provided direct evidence that lipid synthesis is attenuated, and β-oxidation is enhanced in these cells. A striking increase in nuclear peroxisome proliferator-activated receptor α, which plays a dominant role in the expression of β-oxidation genes after ligand-induced activation, was also observed, and we provide evidence that peroxisome proliferator-activated receptor α is constitutively activated in these cells. The combination of attenuated lipid synthesis and enhanced β-oxidation is not conducive to lipid accumulation, yet cellular lipids still accumulated during this stage of infection. Notably, the serum in the culture media was the only available source for polyunsaturated fatty acids, which were elevated (2-fold) in the infected cells, implicating altered lipid import/export pathways in these cells. This study also provided the first in vivo evidence for enhanced β-oxidation during HCV infection because HCV-infected SCID/Alb-uPA mice accumulated higher plasma ketones while fasting than did control mice. Overall, this study highlights the reprogramming of hepatocellular lipid metabolism and bioenergetics during HCV infection, which are predicted to impact both the HCV life cycle and pathogenesis.
Keywords: AMP-activated kinase (AMPK), β-oxidation, hepatitis C virus (HCV), lipogenesis, oxidative stress
Introduction
With ∼200 million people infected worldwide, hepatitis C virus (HCV)2 is a global health problem and a major cause of viral hepatitis. Persistent infection occurs in ∼70% of infected patients leading to inflammation, insulin resistance, steatosis, fibrosis, and hepatocellular carcinoma (1). Current direct-acting antivirals are predicted to be a cure for most patients, but the high cost of this treatment means that the pathological consequences of persistent HCV infection will remain a concern. Although the pathology associated with chronic HCV infection was initially thought to be due to HCV-specific immune responses (2), the current opinion is that direct cytopathic effects in virally infected cells also contribute to HCV-associated liver injury (3, 4). The cellular mechanisms by which HCV replication might mediate liver injury are unclear, but there is no doubt that oxidative/nitrosative stress in HCV-infected cells plays an important role in the initiation and progression of liver damage (3, 5, 6). Oxidative/nitrosative stress essentially arises when the production of reactive oxygen (and nitrogen) species (ROS and RNS, respectively) exceeds cellular antioxidant defenses. HCV-induced oxidative/nitrosative stress has been observed in vivo and in vitro (5–9) and has been assigned to almost all HCV proteins (i.e. core, E1, E2, NS3/4A, NS4B, and NS5A) (5), with core being the most potent inducer (10, 11). Several mechanisms have been identified by which HCV infection can lead to the induction of ROS/RNS, including mitochondrial alterations (12–16); redistribution of calcium between the ER, cytoplasm, and mitochondria (17–23); increased expression of NADPH oxidases (24, 25); enhanced expression of CYP2E1 (26–29); as well as ER stress and the unfolded protein response (10, 18, 22, 30, 31). Oxidative stress also impacts the HCV life cycle at the level of replication and translation and can lead to viral genome heterogeneity, possibly facilitating viral escape from immune detection (32–36). A better understanding of the cellular events that accompany oxidative/nitrosative stress is likely to contribute to our understanding of the pathogenesis of HCV, as well as provide insight into the HCV life cycle.
Oxidative/nitrosative stress has recently emerged as a key activator of the AMP-activated protein kinase (AMPK) signaling system in several cell types, including hepatocytes (37). AMPK is a ubiquitously expressed heterotrimeric serine/threonine kinase complex, consisting of a catalytic α-subunit and two regulatory β- and γ-subunits. Once activated, AMPK serves as a “metabolic master switch,” promoting cellular adaptation and survival in response to environmental or nutritional stressors (38). Full activation of AMPK requires specific phosphorylation (Thr-172) within the activation loop of the catalytic domain of the α-subunit by upstream kinases (39). Regardless of the stimulus, activated AMPK turns on ATP-producing processes, such as fatty acid oxidation, and turns off ATP-consuming processes, such as de novo lipogenesis (DNL) (40). Thus, the conservation of ATP is the net effect of AMPK activation.
Disturbances in lipid metabolism have long been associated with chronic HCV infection (41–47), and the discovery of a specific HCV strain based on genotype 2 (JFH-1; Japanese fulminant hepatitis-1) that efficiently infects and replicates in cultured Huh7.5/7.5.1 hepatoma cells (48–51) has provided considerable insight regarding the intimate link between host cell lipids and HCV infection, at virtually each stage of the HCV replication cycle (45). Providing there are sufficient levels of viral replication, an HCV-induced cytopathic effect is readily observed with this system and is characterized by massive cell death due to apoptosis, which strongly correlates with cell cycle arrest and the induction of numerous genes involved in anti-oxidative stress response (7, 9, 52–54). Rapidly proliferating cells require a constant supply of lipids for membrane biogenesis and protein modifications (55), and HCV replication is expected to increase this demand further (45). However, the demand for lipid synthesis is expected to be lower in growth-arrested cells (55), albeit with predictable consequences to the viral life cycle. This study examines the hypothesis that reprogramming of hepatic lipid metabolism occurs in infected cells undergoing HCV-induced cell cycle arrest in response to oxidative/nitrosative stress through the activation of AMPK. The link between oxidative/nitrosative stress and altered lipid metabolism is predicted to impact both the HCV life cycle and pathogenesis.
Experimental Procedures
Materials
Fatty acid-free bovine serum albumin (BSA), oleic acid (OA), glycerol, leupeptin, phenylmethanesulfonyl fluoride (PMSF), protease inhibitor mixture, cholesteryl oleate, l-α-phosphatidylcholine, heptane, isopropyl ether, GW7647, α-tocopherol, N-acetylcysteine (NAC), and digitonin were obtained from Sigma. Thin layer chromatography plates (catalog no. WHT4860-820) were from Fisher. Dulbecco's modified Eagle's medium (DMEM), TRIzol, Platinum Quantitative PCR SuperMix-UDG, Lipofectamine 2000, 2′,7′-dichlorodihydrofluorescein diacetate (H2DCFDA), Click-iT EdU Alexa Fluor 488 flow cytometry kit, and penicillin/streptomycin mixture 2000 were purchased from Invitrogen. OxiSelect hydrogen peroxide/peroxidase assay kit was from Cell Biolabs, Inc. (San Diego). The antibodies were obtained from the following sources: rabbit anti-human CPT1A and rabbit anti-human ACADL polyclonal antibodies were from GeneTex Inc. (Irvine, CA); mouse anti-core C7-50 monoclonal antibody and mouse monoclonal IgG1 (isotype control, ab170190) were from Affinity BioReagents (Rockford, IL); mouse anti-NS5A NE10 monoclonal antibody (NE10) was a gift (Timothy L. Tellinghuisen, Dept. of Infectious Diseases, The Scripps Research Institute); rabbit anti-human PPARα polyclonal antibody was purchased from Applied Biological Materials Inc. (Richmond, British Columbia, Canada); rabbit anti-histone H2B (ab18977) was from Abcam (San Francisco, CA), rabbit anti-AMPKα and anti-phospho AMPKα (Thr-172) monoclonal antibodies (D5A2 and 40H9, respectively), acetyl-CoA carboxylase rabbit monoclonal antibody (C83B10), and phospho-acetyl-CoA carboxylase (Ser-79) (D7D11) rabbit mAb were from Cell Signaling Technology, Inc. (Danvers, MA); anti-human actin (clone C4) mouse monoclonal antibody was from Millipore (Billerica, MA); HRP-conjugated anti-mouse IgG antibody was from MP Biomedical (Solon, OH); HRP-conjugated donkey anti-rabbit IgG was from Jackson ImmunoResearch (West Grove, PA); Alexa Fluor goat anti-rabbit IR dye 680 and goat anti-mouse IR dye 750 were from Invitrogen. Micro BCA protein assay reagent kit was obtained from Pierce; [9,10-3H]oleic acid, [1-14C]oleic acid, and [3H]acetic acid were obtained from PerkinElmer Life Sciences. Western blotting detection reagents and HyperfilmTM ECL were from GE Healthcare. PPRE CignalTM Reporter system was from SABiosciences via Qiagen (Toronto, Ontario, Canada). ENLITEN ATP assay system bioluminescence detection kit and Dual-Luciferase reporter assay system were from Promega (Madison, WI). qScriptTM cDNA SuperMix was from Quanta Biosciences (Gaithersburg, MD). All DNA primer synthesis was performed by IDT (Coralville, IA). Cell proliferation kit I (MTT) was from Roche Applied Science.
Cells and Cell Culture
Huh7.5 cells, a mutant line of Huh7 cells that support HCV replication with high efficiency (56, 57), and pJFH-1, used to transfect Huh7.5 cells to generate infectious virus stocks, were generously provided by Dr. Charles M. Rice (Rockefeller University, New York). Unless otherwise indicated, cells were maintained in DMEM containing 10% FBS, 100 units/ml penicillin, and 100 μg/ml streptomycin at 37 °C in humidified air containing 5% CO2.
Generation of Viral Stocks and Infected Cell Cultures
Viral stocks were collected from Huh7.5 cells transfected with Japanese fulminant hepatitis (JFH)-1 HCV RNA between 3 and 40 days post-transfection essentially as described (53, 58). Infected cell cultures were generated by inoculating low passage Huh7.5 cells with viral stocks at a multiplicity of infection (m.o.i.) = 0.01 infectious virions/cell essentially as described (53, 58). The percentage of HCV-infected cells and the production of viral RNA and infectivity titers were determined periodically by immunocytochemistry with anti-HCV core immunostaining, quantitative RT-PCR, and limiting dilution assays essentially as described (58, 59). No split was necessary after 10 days due to cytopathic effects (53). Instead, these were enrolled into experiments as “infected” cells. “Naive” cells used in experiments were derived from the same Huh7.5 cell stocks as infected cells (58). Sequencing of the viral genome (Molecular Biology Services Unit, Dept. of Biological Sciences, University of Alberta) confirmed the absence of adaptive mutation G451R previously demonstrated to confer enhanced infectivity (53) from all infected cells enrolled into experiments.
Flow Cytometry Analysis
The number of cells progressing through S-phase was determined by flow cytometry using Click-iT EdU Alexa Fluor 488 flow cytometry kit according to the supplied protocol. Flow cytometry was performed on a BD FACSCalibur machine (BD Biosciences) with analysis done using FlowJo software (version 8.7.1).
Cellular Viability
Cellular viability was estimated using cell proliferation kit I (MTT) according to the manufacturer's instructions.
Detection of ROS/RNS
Production of ROS/RNS was monitored using the cell-permeant H2DCFDA according to the manufacturer's instructions. Upon cleavage of the acetate groups by intracellular esterases and oxidation by intracellular H2O2, low molecular weight peroxides, peroxynitrites, and nitric oxide (60–64), the nonfluorescent H2DCFDA is converted to the highly fluorescent 2′,7′-dichlorofluorescein. Thus, fluorescence intensity is proportional to the amount of oxidants produced by the cells. Cellular H2O2 levels were determined using the OxiSelect hydrogen peroxide/peroxidase assay kit according to the manufacturer's instructions. In the presence of HRP, the 10-acetyl-3,7-dihydroxyphenoxazine reagent reacts with H2O2 in a 1:1 stoichiometry to produce highly fluorescent resorufin. Fluorescence values are proportional to the H2O2 within the samples. The H2O2 content in unknown samples was determined by comparison with its respective standard curve.
Quantitative Immunoblot Analysis
Whole cell lysates were obtained by directly lysing cell pellets with RIPA buffer followed by sonication. Post-nuclear supernatants and nuclear extracts were prepared essentially as described (65). Whole cell lysates, post-nuclear supernatants, or nuclear extracts were separated on SDS-polyacrylamide gel, transferred to nitrocellulose membranes, and blocked with 3% BSA in PBS. Membranes were then incubated for 1 h at room temperature with appropriate dilutions of primary antibodies followed by 1:10,000 appropriate IR dye-conjugated IgG secondary antibodies. All immunoreactive bands were quantified using the Odyssey CLx Infrared Imaging System from LI-COR Biosciences (Lincoln, NE).
Malonyl-CoA Assay
Reversed phase high performance liquid chromatography was used for the determination of malonyl-CoA levels. Details of this method are supplied elsewhere (66).
De Novo Lipogenesis
Cells were seeded in 60- mm culture dishes and allowed to adhere for 4 h prior to incubating for 4 h in 2 ml of DMEM containing 10 μCi of [3H]acetate and 100 μm sodium acetate. Cells were washed twice with PBS and collected. Lipids were extracted and resolved by TLC in neutral lipid solvent, and the bands corresponding to triacylglycerol (TAG), free cholesterol (FC), cholesteryl ester (CE), free fatty acids (FFAs), and phospholipids (PL) were scraped and analyzed as described below under “Lipid Analysis.”
Release of 3H2O from the β-Oxidation of [9,10-3H]Oleic Acid
These experimental conditions were adapted from studies conducted by Hansson et al. (67). Cells were seeded in 60-mm culture dishes and allowed to adhere for 4 h prior to pulse labeling for 4 h with 2 ml of serum-free DMEM containing 5 μCi of [9,10-3H]OA and 0.4 mm OA complexed to 0.4% BSA (pulse) to stimulate neutral lipid synthesis. After 4 h, the pulse media were removed by aspiration and retained for analysis, and cells were washed three times with serum-free DMEM containing 0.4% fatty acid-free BSA and then incubated with 2 ml of serum-free DMEM for an additional 4 h (chase) prior to collecting the chase media for analysis. Pulse and chase media samples were centrifuged at 2,500 × g for 5 min to remove cell debris. Labeled fatty acids were precipitated out from media samples by the addition of 30 μl of 20% BSA and 16 μl of 70% perchloric to 200 μl of culture media. Media were then centrifuged at 25,000 × g for 5 min before an aliquot of the supernatant was counted for radioactivity. The cells were washed with ice-cold PBS, and cell homogenates were prepared in the same buffer, and protein concentration was measured.
14CO2 production from the complete β-oxidation of [1-14C]oleic acid was performed as described previously (68). Briefly, [1-14C]oleic acid stock (2.5 μCi) bound to 0.4 mm OA, 0.5% BSA in 10 ml DMEM was placed in T150 flasks containing cell cultures and fitted with a center vial with a filter paper moistened with 1 m KOH to absorb CO2. The flasks were sealed with rubber septa, and the cells were incubated at 37 °C. After 4 h of incubation, the cells were lysed by the injection of 1 ml of perchloric acid through the flask seal, which also results in the liberation of CO2. Then 0.4 ml of 1 m KOH was added to a center well suspended in the sealed flask. The incubations were continued for a further 1 h at room temperature to allow the CO2 to be absorbed onto the filter paper and KOH. The filter papers and KOH were removed, added to 4 ml of scintillation fluid, and counted.
Fatty Acid Uptake
Cumulative uptake of oleic acid was measured as described previously (69). Adherent cells were incubated with [9,10-3H]oleic acid (2.5 μCi/ml) mixed with 0.4 mm OA, 0.5% FFA-free BSA at 37 °C for 1, 5, 10, 20, or 30 min. Cells were washed with ice-cold 0.5% BSA in PBS three times and then in PBS alone three times. Cells were lysed with 1 m NaOH, and aliquots were used for scintillation counting and protein determination.
ATP Assay
ATP was measured in cells using the Promega ENLITEN ATP assay system bioluminescence detection kit according to manufacturer's instructions.
PPRE Reporter Assay
PPRE reporter assay was performed according to the CignalTM reporter assay handbook. Briefly, cells were transfected with tandem PPRE-firefly luciferase and control Renilla luciferase using Lipofectamine 2000. GW7647 was added 24 h after the start of transfection for an additional 24 h, at which time the cells were harvested and processed according to the Dual-Luciferase reporter assay manufacturer's instructions. Luminescence was measured with the Enspire 2300 multilabel reader (PerkinElmer Life Sciences), and firefly luciferase signal was normalized to internal control Renilla luciferase signal.
Quantitative RT-PCR
Primer sequences used for quantitative RT-PCR are immediately below. Total RNA was isolated using TRIzol reagent and reverse-transcribed with a mixture of random hexamers and oligo(dT) using qScriptTM cDNA SuperMix according to manufacturer's instructions. The transcripts were detected by real time PCR using a Qiagen Rotorgene 3000 instrument. Reaction mixtures contained Platinum Quantitative-PCR SuperMix-UDG with 400 nm concentrations for each primer in a total volume of 20 μl. Following a 3-min initial denaturation at 94 °C, PCR amplification of all genes proceeded for 40 PCR cycles of 95 °C for 20 s, 56 °C for 20 s, and then 72 °C for 20 s. Data analysis was performed with the Corbett Rotor-Gene software using the standard curves method. All transcripts values were normalized to β-actin.
The primers used for quantitative RT-PCR are as follows: CPT1 F, 5′-CGTCTTTTGGGATCCACGATT-3′, and CPT1 R, 5′-TGTGCTGGATGGTGTCTGTCTC-3′; actin F, 5′-CCAACCGCGAGAAGATGA-3′, and actin R, 5′-TCCATCACGATGCCAGTG-3′; VLCAD F, 5′-AAAATTCACAACTTTGGGCTGA-3′, and VLCAD R, 5′-CCCTGGTCCATGTTAGCACT-3′; LCAD F, 5′-TGCCCATGGTATTAGCCTTT-3′, and LCAD R, 5′-CAAAGAATAGTTCTGCGGTATCC-3′; MCAD F, 5′-GCACAAAGAGCTTTGGATGA-3′, and MCAD R, 5′-CAGCATAAATGATATTGCTTGGTG-3′; ACO F, 5′-GGCACCACTGCTCAGAAAG-3′, and ACO R, 5′-AGCCTCGAAGGTGGGTTC-3′; and PPARα F, 5′-ACTGAGAAGCTGTCACCACAGT-3′, and PPARα R, 5′-GCCGAGCTCCAAGCTACTC-3′.
Animal Care and Procedures
Severe combined immunodeficiency disorder, (SCID)/albumin (Alb)-urokinase plasminogen activator (uPA) (SCID/Alb-uPA) mice were housed in a virus- and antigen-free facility supported by the Health Sciences Laboratory Animal Services at the University of Alberta and were cared for in accordance with the Canadian Council on Animal Care guidelines. All experimental protocols involving mice were reviewed and approved by the University of Alberta Health Sciences Animal Welfare Committee. Serum from HCV-infected patients was obtained following informed consent of all donors and with ethics approval from the University of Alberta Faculty of Medicine and Dentistry Research Ethics Review Board. Littermates were transplanted at 10–14 days old with cryopreserved human hepatocytes from a single donor as described previously (70). Replacement of the mouse liver parenchyma with human hepatocytes was estimated by serum levels of human α1 anti-trypsin (hAAT) (71) beginning at 8 weeks post-transplant. Eight transplanted mice having similar and high levels of liver repopulation with human hepatocytes were selected for infection studies and were segregated into naive (n = 4) and infected (n = 4) treatment groups. Four mice were inoculated with infectious serum obtained from a genotype 1A HCV-infected patient. Naive mice did not receive the inoculation. After 2 weeks, all experimental mice were fasted for 16 h prior to blood draw for serum analysis of ketone bodies (see below), hAAT, and HCV RNA essentially as described (72–74).
Plasma Ketone Bodies
Plasma ketone body levels were measured via the cyclic enzymatic method using Autokit Total Ketone Bodies (Wako Chemicals, code no. 415-73301).
Indirect Immunohistochemistry
Engrafted human hepatocytes in paraffin-embedded liver sections were identified using the Super Sensitive ISH detection system (Biogenex, San Ramon, CA) with fluoresceinated Alu probe (catalog no. HK844-2K, Biogenex, San Ramon, CA) according to the manufacturer's instructions. For simultaneous detection of HCV antigens and human hepatocytes, the primary antibody solution provided with the ISH kit was supplemented with anti-core C7–50 and anti-NS5A NE10 antibodies (1:50 of each). For detection of only HCV antigens, the primary antibody solution was replaced with anti-HCV antibodies (core and NS5A) in a PBS solution (containing 1% BSA as carrier, same solution as that provided for anti-HRP mouse monoclonal from Biogenex). Mouse monoclonal IgG1 was used as an isotype control.
Lipid Analysis
Cells were harvested in phosphate-buffered saline (PBS), sonicated on ice, and centrifuged at 1,500 rpm for 5 min in a microcentrifuge to pellet cell debris. Supernatant (cell homogenate) was collected, and lipids were extracted from cell homogenates with chloroform/methanol (2:1, v/v) in the absence (mass determination) or presence (metabolic studies) of nonradioactive lipid carriers (phosphatidylcholine, oleic acid, dioleoylglycerol, trioleoylglycerol, and cholesteryl oleate) as described previously (75). The chloroform phase containing lipids was dried under nitrogen and re-dissolved in a small volume of chloroform for scintillation counting. Alternatively, the re-dissolved lipids were applied to Silica Gel H thin layer chromatography plates. The plates were developed in heptane/isopropyl ether/acetic acid 60:40:4 (by volume) to separate neutral lipids (FA, TG, free cholesterol, and cholesteryl esters). Lipid classes were visualized by exposure to iodine vapor; bands were scraped, and the associated radioactivity was determined by scintillation counting. To analyze lipid mass, lipid extractions were carried out with cell homogenates in the absence of lipid carriers and in the presence of known amounts of tridecanoylglycerol (internal standard). Lipids were processed and analyzed by gas chromatography as described previously (65).
Fatty Acid Composition
For analysis of total lipid-associated FAs, total cell lipids were extracted with chloroform/methanol (2:1, v/v). The organic (chloroform) phases were dried under nitrogen and dissolved in chloroform containing 5 μg of internal standard C17:0. The FAs were converted to FA methyl esters by incubation with 1.5 ml of 6% H2SO4 in methanol for 2 h at 80 °C. Resulting FA methyl esters were analyzed by gas chromatography as described previously (75).
Statistical Analysis
Unless stated otherwise, means ± S.E. were determined for a minimum of n = 4 independent experiments. The results were statistically analyzed by the Student's t test or two-way analysis of variance. p values less than 0.05 were considered to be significant.
Other Methods
Protein concentrations were determined using the Pierce micro BCA assay Kit according to the supplied protocol.
Results
HCV-induced Cell Cycle Arrest Is Associated with ROS Accumulation
A mutant line of Huh7 cells (Huh7.5) that supports JFH-1 (genotype 2a) HCV infection with high replication efficiency (56) and exhibits HCV-mediated growth arrest (7, 9, 53, 54) was used to examine whether oxidative stress was associated with this stage of infection. After HCV infection, the percentage of HCV-infected cells and the production of viral RNA and infectious virions were determined periodically by immunocytochemistry with anti-HCV core immunostaining, quantitative RT-PCR, and limiting dilution assays essentially as described (58, 59). Infected cell cultures were enrolled into experiments as “infected cells” at 10 days post-infection (m.o.i. =0.01), when they appeared to grow more slowly relative to their naive counterparts, with more dead cells appearing in the culture media. These cultures were characterized by high levels of HCV infection, producing >107 IU of HCV RNA per mg of cellular RNA with infectivity titers >105 focus-forming units/ml. Importantly, >95% of the infected cells were HCV core-positive (Fig. 1A), thereby minimizing the contribution of non-infected cells present in infected cultures to experimental outcomes (76). The numbers of cells progressing through S-phase were enumerated by flow cytometry (Fig. 1B). This analysis revealed that >80% of the infected cells were growth-arrested, because <20% exhibited evidence of EdU incorporation, as opposed to >75% with naive cells (Fig. 1B). Despite their reduced proliferative capacity, the surviving infected cells remained sufficiently healthy with viabilities >90% (Fig. 1C). H2DCFDA is sensitive to both H2O2 and NO-based radicals and can be oxidized to 2′,7′-dichlorofluorescein by various ROS and RNS, including H2O2, although the OxiSelect reagent is specifically sensitive to H2O2 (60–64). Intracellular ROS/RNS levels were examined using H2DCFDA as the detection reagent (Fig. 1D). This analysis revealed that infected cells have ∼5-fold more intracellular ROS/RNS than naive cells, indicating that HCV-induced cell cycle arrest is associated with more oxidative/nitrosative stress. At least some of this increase is due to elevated H2O2 production, because infected cells were also found to have higher H2O2 levels than naive cells.
FIGURE 1.

HCV-mediated cell cycle arrest. A, expression of HCV core in naive and infected Huh7.5 (at 10 days post-infection with JFH-1, m.o.i. = 0.01). HCV-positive cells were detected using an anti-core antibody (red), whereas all cell nuclei are shown using DAPI (blue). Micrographs are representative of all naive and infected cell cultures enrolled in the studies herein. B, analysis of proliferating cells in infected Huh7.5 cell cultures (at 10 days post-infection with JFH-1, m.o.i. = 0.01). Naive cells were used as controls. Following a 3-h pulse with EdU to label cells in S-phase, cells were enumerated by flow cytometry. Results are expressed as means ± S.E. for n = 4 independent experiments. C, analysis of cell viability of infected Huh7.5 cells (at 10 days post-infection with JFH-1, m.o.i. = 0.01). Naive cells were used as controls. Cell viability was determined by MTT assay. Results are expressed as means ± S.E. for n = 4 independent experiments. D, analysis of ROS levels in infected Huh7.5 (at 10 days post-infection with JFH-1, m.o.i. = 0.01). Naive cells were used as controls. Intracellular ROS/RNS and H2O2 levels were examined using H2DCF-DA and OxiSelect detection reagents, respectively. Results are expressed as means ± S.E. for n = 4 independent experiments.
HCV-induced Cell Cycle Arrest Is Associated with ROS/RNS-mediated AMPK Activation
Full activation of AMPK requires specific phosphorylation (at Thr-172) within the catalytic domain of the α-subunit by upstream kinases (38), and this signaling system is activated by oxidative stress in various cell types, including liver cells (37). The possibility that AMPK might be activated in infected cells was examined by immunoblot analysis (Fig. 2A). The levels of AMPK were found to be similar between naive and infected cells, but infected cells contained substantially more Thr-172 phosphorylated AMPK (p-AMPK) than naive cells, indicating that more of the AMPK is activated in these cells. To examine the contribution of ROS/RNS to AMPK activation, two different antioxidants were used (Fig. 2B). α-Tocopherol is membrane-soluble and functions primarily as an inhibitor of lipid peroxidation by virtue of its chain-breaking and free radical scavenger actions. In contrast, NAC is a small water-soluble molecule directly providing –SH groups for adduction or oxidation, and it is a precursor of glutathione (77). Pre-treatment of infected cells with either α-tocopherol or NAC led to a reduction in cellular ROS/RNS production by ∼30% (Fig. 2B). The cellular levels of p-AMPK were also reduced by ∼30% when infected cells were pre-treated with α-tocopherol, whereas total AMPK levels remained unchanged (Fig. 2C). This is an indication that oxidative/nitrosative stress plays some role in the activation of AMPK in Huh7.5 cells during HCV-induced cell cycle arrest. Although the levels of p-AMPK were also found to be reduced by ∼30% in infected cells pre-treated with NAC, these reduced levels did not reach statistical significance (data not shown).
FIGURE 2.

ROS-dependent activation of AMPK in infected cells. A, cellular levels of AMPK and AMPK phosphorylated on Thr-172 (P-AMPK) in infected Huh7.5 cells (at 10 days post-infection with JFH-1, m.o.i. = 0.01) were determined by immunoblot analysis. Naive cells were used as controls. Blots were stripped and re-probed for HCV NS5A (infection control) and actin (loading control). Immunoblots are representative of four independent experiments. B, analysis of ROS levels in infected Huh7.5 cells (at 10 days post-infection with JFH-1, m.o.i. = 0.01). Intracellular ROS levels in infected Huh7.5 cells (at 10 days post-infection with JFH-1, m.o.i. = 0.01) were examined after pre-treatment with or without α-tocopherol (±100 μm) or NAC (±5 mm) for 24 h. H2DCF-DA was used as the detection reagent. Results are expressed as means ± S.E. for n = 4 independent experiments. C, cellular levels of AMPK and AMPK phosphorylated on Thr-172 (P-AMPK) in infected Huh7.5 cells (at 10 days post-infection with JFH-1, m.o.i. = 0.01) were determined by immunoblot analysis after pretreatment for 1 h with or without α-tocopherol (±100 μm). Blots were stripped and re-probed for HCV core (infection control) and actin (loading control). Immunoblots are representative of four independent experiments. AMPK and p-AMPK bands were quantified using the Odyssey CLx Infrared Imaging System and normalized to actin (right). Results are expressed as means ± S.E. for n = 4 independent experiments.
HCV-induced Cell Cycle Arrest Is Associated with Attenuated DNL Activity
Acetyl-CoA carboxylase (ACC) catalyzes the conversion of acetyl-CoA to malonyl-CoA, which is the first committed intermediate formed during fatty acid synthesis. Two separate genes encode different ACC isoforms in hepatocytes as follows: ACC1 is localized in the cytosol and is committed to DNL, and ACC2 is anchored to the mitochondrial membrane and is involved in the control of fatty acid oxidation via allosteric inhibition of CPT1, which is also present on the mitochondrial surface, by locally produced malonyl-CoA (38). Both ACC isoforms are phosphorylated by AMPK (at Ser-79 and Ser-220 for ACC1 and ACC2, respectively) in hepatocytes (including Huh7 cells (78)), thereby inhibiting malonyl-CoA production in both compartments (79, 80). Because HCV-mediated growth arrest was associated with activated AMPK, the expression of ACC1/2 and the presence of their AMPK-phosphorylated derivatives were examined by immunoblot analysis using antibodies that were selected based on their ability to detect both ACC1 (265 kDa) and ACC2 (280 kDa) isoforms and their AMPK-phosphorylated derivatives (Fig. 3A). However, only a single ACC species (∼265 kDa) was detected in naive and infected Huh7.5 cells when these antibodies were used. Although this is consistent with what has previously been reported with Huh7.5 cells when the same antibodies were used (81), both ACC isoforms are present in Huh7 cells and have predictable mobility on SDS-PAGE (78). The reason for this disparity is not understood, but because alternative promoter usage and exon splicing can result in several ACC1 and ACC2 variants ranging from 253 to 280 kDa (82), we also performed immunoblot analysis using ACC1- and ACC2-specific antibodies (data not shown). This analysis revealed that both ACC species are present in naive and infected cells, albeit with similar mobility on SDS-PAGE (i.e. ∼265 kDa). Furthermore, there was no apparent difference in the levels of ACC1 or ACC2 between naive and infected cells. In agreement with having higher p-ACC levels, infected cells had just 50% of the malonyl-CoA present in naive cells (Fig. 3B).
FIGURE 3.

Increased inhibition of ACC correlates with attenuated malonyl-CoA levels in infected cells. A, cellular levels of ACC and ACC phosphorylated on Ser-79 (P-ACC) in infected Huh7.5 cells (at 10 days post-infection with JFH-1, m.o.i. = 0.01) were determined by immunoblot analysis. Naive cells were used as controls. Blots were stripped and re-probed for HCV NS5A (infection control) and actin (loading control). Immunoblots are representative of four independent experiments. ACC and p-ACC bands were quantified using the Odyssey CLx infrared imaging system and normalized to actin (right). Results are expressed as means ± S.E. for n = 4 independent experiments. B, analysis of malonyl-CoA levels in ROS levels in infected Huh7.5 cells infected with JFH-1 (10 days post-infection, m.o.i. = 0.01). Naive cells were used as controls. Results are expressed as means ± S.E. for n = 4 independent experiments.
HCV replication has been shown to suppress glucose uptake through the down-regulation of cell surface glucose transporters (83). To rule out the possible contribution of altered substrate supply to the drop in malonyl-CoA levels, infected cells were supplied with [3H]acetate. This offers an alternate pathway of producing acetyl-CoA via acetyl-CoA synthetase instead of from pyruvate via the pyruvate dehydrogenase complex. Thus, any change in the incorporation of [3H]acetate into cellular lipids is due to altered catalytic efficiency, for which ACC activity has major influence. As expected with higher p-ACC levels, infected cells incorporated less [3H]acetate into FFA and their esterified derivatives (TAG, PL, and CE) than naive cells (Fig. 4). In addition, infected cells incorporated less [3H]acetate into free cholesterol (FC) than naive cells, indicating that these cells also have reduced cholesterol biosynthetic activity. These results demonstrate unequivocal association between HCV-induced cell cycle arrest and attenuated DNL activity.
FIGURE 4.
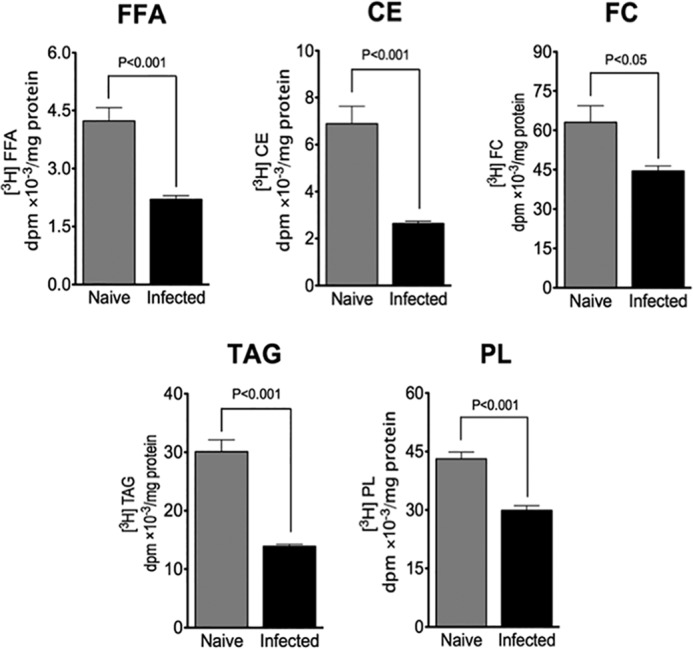
Attenuated DNL in infected cells. DNL activity was measured in infected Huh7.5 cells (at 10 days post-infection with JFH-1, m.o.i. = 0.01) by the incorporation of [3H]acetate into cellular lipids. Naive cells were used as controls. TAG, triacylglycerol; CE, cholesteryl ester; PL, phospholipid; FC, free cholesterol; FFA, free fatty acid. Results are expressed as means ± S.E. for n = 4 independent experiments.
HCV-induced Cell Cycle Arrest Is Associated with Enhanced β-Oxidation Activity
A drop in malonyl-CoA is expected to increase β-oxidation activity through the disinhibition of CPT1 (79, 80, 84, 85). To examine this possibility, mitochondrial β-oxidation was monitored by the release of 3H2O from [9,10-3H]oleic acid (Fig. 5A), an assay for long- and medium-chain fatty acid oxidation (86). By the end of the labeling period (pulse), infected cells had released significantly more 3H2O into the media than had naive cells. Naive and infected cells released substantially less 3H2O into the media after oleic acid was withdrawn from the culture media (chase), indicating that exogenous fatty acids enter a pool that is tightly coupled to mitochondrial β-oxidation. However, infected cells continued to release more 3H2O into the media than did naive cells even after fatty acids were withdrawn from the culture media. This indicates that the mobilization of TAG in preformed storages pools (e.g. lipid droplets) for β-oxidation occurs more readily with the infected cells. Infected cells also released considerably more 14CO2 due to the complete β-oxidation of [1-14C]oleic acid than naive cells (Fig. 5B), indicating that the complete oxidation of long-chain fatty acids is more efficient in the infected cells (86). It is noteworthy that infected and naive cells had taken up similar levels of labeled oleic acid within the first 10 min of the labeling period (Fig. 5C), ruling out the possibility that enhanced β-oxidation observed with the infected cells was due to altered cellular uptake of labeled oleic acid. Reduced levels of labeled oleic acid in infected cells observed at later time points (10–20 min) is likely a reflection of enhanced β-oxidation rather than reduced uptake. As expected with enhanced mitochondrial β-oxidation, infected cells exhibited higher cellular ATP levels than their naive counterparts (Fig. 5D). These results demonstrate an unequivocal association between HCV-induced cell cycle arrest and enhanced β-oxidation activity.
FIGURE 5.

Enhanced β-oxidation in infected cells. A, JFH-1-infected Huh7. 5 cells (at 10 days post-infection, m.o.i. = 0.01) were incubated with [9,10-3H]oleic acid for 4 h (pulse), followed by incubation in DMEM (chase). Naive cells were used as controls. Media equivalent to 500 μg of cell protein were analyzed for radioactivity in the form of 3H2O as described under “Experimental Procedures.” Results are expressed as means ± S.E. for n = 4 independent experiments. B, JFH-1-infected Huh7.5 cells (at 10 days post-infection, m.o.i. = 0.01) were incubated with [1-14C]oleic acid for 4 h, and the 14CO2 production from the complete β-oxidation of [1-14C]oleic acid was analyzed as described under “Experimental Procedures.” Naive cells were used as a control. Results are expressed as means ± S.E. for n = 4 independent experiments. C, JFH-1-infected cells (at 10 days post-infection, m.o.i. = 0.01) were incubated with [9,10-3H]oleic acid for the indicated times and then lysed, and the amount of radioactivity in lysates was determined by scintillation counting. Naive cells were used as a control. Results are expressed as means ± S.E. for n = 4 independent experiments. D, cellular ATP levels were analyzed in JFH-1-infected cells (at 10 days post-infection, m.o.i. =0.01). Naive cells were used as a control. Results are expressed as means ± S.E. for n = 4 independent experiments.
HCV-induced Cell Cycle Arrest Is Associated with Elevated Nuclear PPARα and PPARα Target Gene Expression
PPARα is a type II nuclear receptor localized to the nucleus as part of an inhibitory complex prior to ligand-induced activation (87). Ligand-induced activation of PPARα leads to the enhanced expression of PPARα target genes, many of which have important roles in β-oxidation (including CPT1) (87). However, several kinase-dependent processes also appear to lead to the activation of PPARα, including AMPK (88). Because AMPK was activated in infected cells, PPARα and CPT1 expression levels were examined by immunoblot analysis using nuclear and whole cell extracts, respectively. PPARα was readily detected in nuclear extracts of infected cells (Fig. 6A). By contrast, very little (if any) PPARα was detected in nuclear extracts from naive cells (Fig. 6A). Infected cells contained ∼2-fold more CPT1 than naive cells (Fig. 6B). To examine the activation status of nuclear PPARα, a PPARα-selective agonist (GW7647) was administered to cells following transient transfection with a PPAR-responsive luciferase reporter gene (Fig. 6C). Without GW7647, naive and infected cells exhibited similar activities of the luciferase reporter gene. It is not known which of the three PPAR (α, β/δ, and γ) family members contribute to this baseline activity because each of these is present in liver (87). Furthermore, there is evidence that HCV infection can lead to the increased expression and activation of PPARγ in hepatoma cells (41). Importantly, a 1.5-fold increase in reporter activity was observed with naive cells in response to GW7647, indicating that at least some of the PPARα was unactivated prior to administration of GW7647. Despite having substantially more nuclear PPARα than naive cells, no appreciable change in reporter activity was observed when GW7647 was administered to infected cells. This is an indication that PPARα is constitutively active in infected cells. In support of this, a significant up-regulation of several PPARα gene targets with important roles in fatty acid oxidation was observed with infected cells compared with naive cells (Fig. 6D). These included CPT1, medium- and long-chain acyl-CoA dehydrogenase (MCAD and LCAD, respectively), acyl-CoA oxidase (ACO), and PPARα genes.
FIGURE 6.

Increased nuclear PPARα correlates with increased cellular CPT1 and enhanced expression of β-oxidation genes in infected cells. A, nuclear PPARα levels in infected Huh7.5 cells (at 10 days post-infection with JFH-1, m.o.i. = 0.01) were analyzed by immunoblot analysis. Naive cells were used as a control. Blots were stripped and re-probed for histone (H2B, loading control). Immunoblot is representative of n = 4 independent experiments. B, cellular CPT1 levels in infected Huh7.5 cells (at 10 days post-infection with JFH-1, m.o.i. = 0.01) were analyzed by quantitative immunoblot analysis (right). Immunoblot is representative of n = 4 experiments, and results are expressed as means ± S.E. for n = 4 independent experiments. Naive cells were used as a control. Blots were stripped and re-probed for actin (loading control) and HCV core (infection control). C, infected Huh7.5 cells (at 10 days post-infection with JFH-1, m.o.i. = 0.01) were transfected with the PPAR reporter supplied by the CignalTM PPAR reporter (luc) kit. After 24 h of transfection, the media were changed to DMEM containing 10% FBS with (300 μm) or without (0 mm) GW7647 in DMSO. The final DMSO concentration did not exceed 0.1% (v/v). Dual luciferase assay was performed 24 h post-treatment, and promoter activity values are expressed as arbitrary units using a Renilla reporter for internal normalization. Naive cells were used as a control. Results are expressed as means ± S.E. for n = 4 independent experiments. D, expression of genes encoding CPT1, acetyl-CoA carboxylase 2 (ACC2), very long-, long-, and medium-chain acyl-CoA dehydrogenase (VLCAD, LCAD, and MCAD, respectively), acyl-CoA oxidase, and PPARα were quantified by quantitative RT-PCR in infected Huh7.5 cells (at 10 days post-infection with JFH-1, m.o.i. = 0.01) and normalized to actin. Naive cells were used as a control. Results are expressed as means ± S.E. for n = 4 independent experiments.
HCV Infection Is Associated with Enhanced β-Oxidation in the Humanized Livers of SCID/uPA Mice
The SCID/Alb-uPA mouse model is the first small animal model capable of supporting the entire HCV life cycle. Their use in HCV research and other areas of biomedical research has been extensively reviewed, and they continue to be the preferred model for in vivo studies of HCV infection (89, 90). A genomic study of the host response to HCV infection with this model has uncovered a potential link between disturbances in lipid metabolism and oxidative stress (8). Specifically, mice that showed evidence of HCV-mediated oxidative stress also exhibited induction of several genes with important roles in β-oxidation, including PPARα (8). Steatosis is frequently observed in the histologically integrated human hepatocytes that make up the humanized livers of these mice, independent from HCV infection (Fig. 7A). This has been attributed to enhanced DNL arising from an inherent deficiency in this mouse model for human growth hormone (91). Although this is expected to limit interpretations regarding the impact of HCV infection on DNL, we considered using this model to examine hepatic β-oxidation during HCV infection because in the starved state, hepatic β-oxidation results in the production of ketone bodies, which in turn are used as an energy source, particularly by the brain (92). Eight mice (111–115 days old) that were transplanted with donor-matched cryopreserved human hepatocytes (10–14 days of age) and having similar high levels of liver repopulation with human hepatocytes (as determined by serum-based ELISA for hAAT at weaning) were selected for infection studies and then segregated into naive (n = 4 mice) and infected (n = 4 mice) treatment groups. For the infected group, mice were inoculated with serum obtained from a genotype 1A HCV-infected patient. Naive mice did not receive the inoculation. At 2 weeks post-inoculation, all experimental mice were fasted for 16 h prior to blood draw for serum analysis of ketone bodies, hAAT, and HCV RNA titers and liver sampling for detection of HCV antigens (core and NS5A) using immunohistochemistry (Fig. 7B). Following 16 h of fasting, the circulating levels of ketone bodies were found to be ∼2-fold higher in infected mice versus naive mice (Fig. 7B). Hepatocytes expressing HCV-specific antigen have been detected in liver biopsies previously using immunohistochemistry or fluorescence microscopy, but HCV antigens are recognized by either technique only at or near the limits of sensitivity (93–96). Using immunohistochemistry, we identified cells that labeled positively for HCV antigens (core and NS5A) in the livers from all infected mice. This diffuse and weak labeling was localized to histologically integrated human hepatocytes (brown nuclei) and was absent when immunohistochemistry was performed using an isotype control antibody. A more sensitive method, with larger numbers of mice, is required to examine whether there is a correlation between the proportion of HCV-infected human hepatocytes in the chimeric livers of SCID/Alb-uPA mice and the production of ketone bodies in the starved state. The results of this experiment provide encouraging in vivo evidence that hepatic mitochondrial β-oxidation is enhanced during HCV infection.
FIGURE 7.

SCID/Alb-uPA mice infected with HCV exhibit enhanced β-oxidation. A, engrafted human hepatocytes (brown nuclei) in paraffin-embedded liver sections were distinguished from mouse hepatocytes and other murine constituents (blue nuclei) by hybridization with fluoresceinated Alu probe. A representative liver from SCID/uPA mice transplanted with cryopreserved human hepatocytes and sacrificed at 111–115 days after transplantation is shown. For comparison, a representative liver from a non-transplanted littermate and donor-matched transplanted littermate that had been inoculated with serum from an HCV genotype 1A-infected patient 2 weeks prior to sacrifice are also shown. The HCV serum titer at time of sacrifice was 5.25 × 10⁶ HCV RNA/ml. ×5 and ×10 magnifications display large areas of the liver sections that exhibit cytoplasmic vacuolations (within red border) localized to areas dominated by engrafted human hepatocytes. By contrast, these cytoplasmic vacuolations are absent from non-transplanted mice and regions dominated by murine constituents. These vacuolations have been characterized previously (91) and are due to hepatic steatosis (91). B, SCID/Alb-uPA mice (n = 8) were transplanted with cryopreserved human hepatocytes at 10–14 days after birth. Half of the mice (n = 4) were inoculated with serum obtained from an HCV genotype 1a patient (10E5 IU RNA in 50 μl). The remaining mice (n = 4) were not inoculated (naive). At 2 weeks post-inoculation, naive and infected mice were fasted for 16 h prior to blood collection for serum hAAT, serum HCV RNA, and plasma ketone analysis. The outcomes are supplied in the table (left), and the plasma ketone analysis is expressed as means ± S.E. for n = 4 mice (right). HCV antigens (core and NS5A) and human hepatocytes (brown) were detected in paraffin-embedded liver sections by hybridization with fluoresceinated Alu probe and indirect immunohistochemical staining. Serial sections were processed for simultaneous detection of HCV antigens and Alu-positive hepatocytes (Alu + HCV), HCV antigens (HCV), and Alu-positive hepatocytes (Alu). As a control for background staining, isotype control antibody was used for the primary incubation. Representative micrographs are shown for transplanted naive mice (mouse B.A213) and transplanted mice infected with HCV (mouse B.A217).
Cellular Lipids Accumulate in Huh7.5 Cells during HCV-induced Cell Cycle Arrest
HCV infection is associated with the hepatic accumulation of lipids, and this feature contributes to the development of hepatic steatosis in the clinical setting and to various aspects of the viral life cycle in vitro (41). Because the combination of attenuated DNL and enhanced β-oxidation is not conducive to lipid accumulation, cellular lipid levels were investigated in naive versus infected cells. Cellular levels of TAG, PL, CE, and FC were determined by gas chromatography (Fig. 8A). Surprisingly, each of these lipid classes was significantly elevated in infected cells when compared with naive cells. A comprehensive fatty acid profile of total lipids was also obtained (Table 1). This analysis revealed significant alterations in the fatty acid composition of cellular lipids in infected versus naive cells (boldface). The ratios of specific fatty acids, typically regarded as indices of desaturation/elongation (97), were also determined (Fig. 8B). Relative to naive cells, infected cells had higher 18:0/16:0 and 20:4/18:2 ratios indicating increases in elongase and Δ6 desaturase activities, respectively. The lower 18:1/18:0 ratio observed with infected cells is an indication of reduced stearoyl-CoA desaturase activity. Monounsaturated oleic acid (18:1) and saturated palmitic and stearic acids (16:0 and 18:0) were the major cellular fatty acids, accounting for ∼70% of the fatty acids present in naive and infected cells. Compared with naive cells, the fatty acid composition of infected cells was characterized by slight increases in saturated and monounsaturated fatty acids, respectively, and a larger increase in PUFAs (∼2-fold) (Fig. 8C).
FIGURE 8.

Lipids accumulate in infected cells with changes in fatty acid composition and derived fatty acid indices. Lipids were extracted from infected Huh7.5 cells (at 10 days post-infection with JFH-1, m.o.i. = 0.01). Naive cells were used as a control. A, cellular levels of FC, CE, PL, and TAG were determined via gas chromatography. Results are expressed as means ± S.E. for n = 4 independent experiments. B, corresponding fatty acids were converted to fatty acid methyl esters and analyzed by gas-liquid chromatography. The relative contributions of saturated and monounsaturated fatty acids and PUFA to the total fatty acids are shown. Results are expressed as means ± S.E. for n = 4 independent experiments. C, elongase activity index (18:0/16:0), SCD1 activity index (18:1n-9/18:0), and Δ6 desaturase activity index (20:4n-6/18:2n-6). Results are expressed as means ± S.E. for n = 4 independent experiments.
TABLE 1.
Fatty acid composition of cellular lipids
Fatty acids present in total cellular lipids extracted from infected Huh7.5 cells (at 10 days post-infection with JFH-1, m.o.i. = 0.01) were converted to fatty acid methyl esters and then analyzed by gas-liquid chromatography. Naive cells were used as a control. Results are expressed as means ± S.E. for n = 4 independent experiments. Values in bold were considered significantly different when p < 0.05.
| Fatty acid | Naive | Infected | p value |
|---|---|---|---|
| μg of fatty acid/mg cell protein (mean ± S.E.) | |||
| 14:0 (myristic) | 2.282 ± 0.196 | 1.9 ± 0.073 | 0.093 |
| 15:0 (pentadecylic) | 0.560 ± 0.038 | 0.574 ± 0.007 | 0.679 |
| 16:0 (palmitic) | 23.834 ± 0.855 | 27.514 ± 0.417 | 0.008 |
| 16:1 (palmitoleic) | 5.563 ± 2.023 | 7.291 ± 0.053 | 0.264 |
| 17:1 (heptadecenoic) | 0.536 ± 0.272 | 0.979 ± 0.025 | 0.111 |
| 18:0 (stearic acid) | 19.910 ± 0.656 | 32.885 ± 0.475 | <0.001 |
| 18:1n-9 (oleic acid) | 18.633 ± 9.910 | 40.409 ± 1.016 | 0.038 |
| 18:1n-7 (vaccinic) | 4.210 ± 1.026 | 9.276 ± 0.189 | 0.038 |
| 18:2n-6 (linoleic) | 1.922 ± 0.101 | 3.193 ± 0.106 | 0.202 |
| 18:3n-3 (linolenic) | 0.186 ± 0.101 | 1.069 ± 0.021 | <0.001 |
| 19:0 (nonadecanoic) | 0.341 ± 0.171 | 0.641 ± 0.014 | 0.091 |
| 20:1 (eicosenoic) | 0.290 ± 0.089 | 0.444 ± 0.010 | 0.099 |
| 20:2n-6 (eicosadienoic) | 0.260 ± 0.137 | 0.766 ± 0.046 | 0.011 |
| 20:3n-6 (eicosatrienoic) | 0.509 ± 0.303 | 0.674 ± 0.011 | 0.62 |
| 20:3n-3 (eicosatrienoic) | 0.605 ± 0.460 | 2.225 ± 0.321 | 0.030 |
| 20:4n-6 (arachidonic) | 2.352 ± 1.342 | 9.337 ± 0.426 | 0.002 |
| 22:0 (docosanoic) | 3.388 ± 1.729 | 8.698 ± 0.309 | 0.016 |
| 22:3 (docosatrienoic) | 0.264 ± 0.145 | 0.934 ± 0.041 | 0.003 |
| 22:4 (docosatetraenoic) | Below detection limit | 0.893 ± 0.354 | 0.08 |
| 22:6 (docasahexaenoic) | 0.782 ± 0.520 | 3.549 ± 0.244 | 0.003 |
Discussion
Here, we show that HCV-induced growth arrest is associated with ROS/RNS-mediated AMPK activation. We found that the activation of AMPK was more sensitive to α-tocopherol than to NAC. The reasons for this are not understood, but AMPK is targeted to biological membranes via myristoylation, and this promotes phosphorylation of the Thr-172 site by upstream kinases, suggesting possible preferential activation of AMPK at membrane sites (98). This raises the possibility that local scavenging of ROS/RNS by α-tocopherol residing in biological membranes and/or the different scavenging capacities of α-tocopherol and NAC for various ROS/RNS species (99) may have contributed to this phenomenon. The attenuated DNL and enhanced β-oxidation observed during this stage of infection likely reflect AMPK-mediated lowering of both ACC1- and ACC2-derived malonyl-CoA pools (79, 80). In addition to ACC activity, malonyl-CoA decarboxylase plays an important role in the turnover of malonyl-CoA and is also activated by AMPK in liver, resulting in increased fatty acid oxidation (100). This raises the possibility that malonyl-CoA decarboxylase also contributed to lower malonyl-CoA levels and therefore enhanced β-oxidation in these cells.
Very little is known about the role PPARα has in HCV-induced liver disease. Although histological data provide indirect evidence for the down-regulation of PPARα (101–103), it is uncertain whether any of the liver tissue contained HCV infected hepatocytes. A direct role for PPARα in the development of hepatic steatosis and hepatocellular carcinoma has come from studies that combine mice with a homozygous deletion of PPARα with mice having hepatic expression of the HCV core protein (104, 105). Although the physiological relevance is questionable in the absence of viral replication, these phenomena were found to be associated with sustained PPARα activation. In our study, the relatively higher abundance of nuclear PPARα in infected cells was associated with increased expression of several PPARα target genes involved in β-oxidation (including PPARα and CPT1). This is a strong indication that PPARα also contributed to the increase in β-oxidation activity in these cells. Furthermore, we provide evidence that PPARα is persistently activated during this stage of infection. Aside from AMPK, activators of ERK-MAPK, JNK, and p38 MAPK, PKA, and PKC enhance PPARα activity, whereas GSK inhibits PPARα activity (88). Although the mechanism remains to be determined, several opportunities exist for HCV-mediated PPARα activation because HCV can modulate each of these pathways in a manner that is expected to enhance PPARα activity (106–109). Furthermore, HCV-induced growth arrest was associated with elevated PUFA levels (see below), which serve as natural ligands for PPARα (87), representing yet another opportunity for HCV-induced PPARα activation.
This study also provided the first in vivo evidence for the up-regulation of mitochondrial β-oxidation during HCV infection because SCID/Alb-uPA mice accumulated higher plasma ketones in the fasted state when they were antecedently infected with the patient-derived genotoype-1A HCV. Although the variation of ketone production within naive and infected groups warrants a more expanded study with larger numbers of mice, and more HCV genotypes, the results of this in vivo study are encouraging given that a link between oxidative stress and increased expression of several β-oxidation genes (including PPARα) has already been established in this HCV mouse model (8).
Finally, we found a significant accumulation of lipids in Huh7.5 cells during HCV-mediated growth arrest, with changes in FA composition characterized by increases in saturated and monounsaturated fatty acids and even larger increases in PUFA. Although HCV-mediated dysregulation of enzymatic fatty acid conversion steps can account for some of these changes, hepatocytes are incapable of deriving PUFA from DNL (97). Defective TAG export as VLDL has been demonstrated with JFH-1-infected Huh7.5 cells using the same culture conditions as those used herein (58). Because PUFAs are a constituent of TAG (110), defective VLDL assembly/secretion would account for at least some of the elevated PUFA levels associated with infected cells during this stage of infection. The peroxidation of PUFAs, regulated in part through sphingosine kinase-2, has recently been shown to severely restrict the replication of all HCV strains with a demonstrated ability to induce cell cycle arrest (32, 54). Thus the accumulation and peroxidation of PUFAs may attenuate HCV replication in stressed tissue, including cells undergoing HCV-mediated cell cycle arrest, possibly facilitating long term viral persistence and cellular survival.
In contrast with the results reported herein, AMPK inhibition has been reported with JFH-1-infected Huh7 cells at 48 h post-infection (m.o.i. = 0.5), and this promoted cellular lipid accumulation and viral replication (111). In this scenario, AMPK inhibition was mediated by the phosphorylation of AMPK at Ser-485 through activation of the (PI3K)-AKT pathway (111). Despite the possibility that ROS accumulated in these cells (11, 112, 113), this scenario does not contradict the ROS-mediated AMPK activation observed during HCV-induced growth arrest because phosphorylation of AMPK at Ser-485 has been shown to prevent subsequent phosphorylation at Thr-172, and hence full activation of AMPK (114). AMPK inhibition was also reported with JFH-1-infected Huh7 cells at 5 days post-infection (m.o.i. = 10), when replication had already been established (115). In this scenario, HCV-mediated ER stress and the unfolded protein response induced autophagy through inhibition of the AKT/mammalian target of rapamycin pathway. ROS are an important consequence of HCV-induced ER stress, and ROS inhibit mammalian target of rapamycin through activation of AMPK and inhibition of AKT, leading to apoptosis (116). A complicated issue is whether ROS contributed to ER stress-induced autophagy in this scenario because ER stress-induced suppression of mTOR excluded regulation by AMPK. Indeed, others have shown that ER stress-induced deactivation of the AKT/mTOR pathway excludes the involvement of AMPK (117). Although the precise regulatory pathway is still enigmatic, available evidence indicates that inositol-requiring ER-to-nucleus signal kinase-1 (IRE1), PRK (RNA-dependent protein kinase)-like ER kinase, and increased [Ca2+] are distinct initiators of ER stress-induced autophagy in mammalian cells (118–120). Furthermore, HCV-induced apoptosis, which strongly correlates with cell cycle arrest and viral replication (9, 54), was not observed in Huh7 cultures undergoing HCV-induced autophagy (115). Although this may have been due to the low JFH-1 replication efficiency when Huh7 cells are used, this is an indication that the severity of ER stress and ROS levels was insufficient for the induction of apoptosis, raising the possibility that ROS-mediated activation of AMPK occurs at a later stage, when more ROS accumulates.
Proteomic profiling of HCV-infected Huh7.5 cells has provided strong evidence that the delay in cell cycle progression during HCV infection is accompanied by an adaptive metabolic response aimed at channeling substrates from synthetic to energetic purposes (7). The shift from AMPK inhibition observed prior to HCV-induced cell cycle arrest to AMPK activation observed with growth-arrested infected cells agrees with this concept. In addition to AMPK inhibition, the increased expressions of sterol regulatory element-binding protein and fatty acid synthase, both important for intracellular lipid synthesis, are thought to enhance lipogenesis after HCV gains entry into cells (121, 122). Lipid droplets, which serve as important organelles for HCV assembly (123), are also targeted for degradation by HCV-induced autophagy (124, 125). Moreover, it has become increasingly evident that lipids play important roles in the autophagy process itself, both at the level of regulation of autophagy and as membrane constituents required for formation of autophagic vesicles (126). Thus, AMPK inhibition after HCV gains cellular entry would help support virion production while supplying the lipids necessary for autophagy and continued cellular proliferation. However, activation of the AMPK signaling system is essential for the survival of cells under oxidative stress, and various studies indicate that ROS promote cell survival by increasing mitochondrial biogenesis and the expression of genes involved in antioxidant defense through the AMPK pathway (127–130). Thus, as infection progresses and cell stress increases, ROS-induced AMPK activation would promote metabolic homeostasis and rebalancing of the redox tone, thereby allowing HCV to fully exploit the lipid-laden and energy-rich cell to nourish replication and virus assembly. How HCV induces cell cycle arrest in hepatoma cells is not understood, but prolonged AMPK activation in response to ROS has been shown to trigger caspase activation and onset of the intrinsic mitochondrial apoptosis pathway (57, 131, 132), which are characteristic of the HCV-mediated cytopathic effects observed with Huh7.5 cells (9, 54). Furthermore, cancer cells are dependent on ACC activity to provide sufficient fatty acids for proliferation and survival (55, 133, 134). Likewise, inhibition of ACC activity results in cell cycle arrest and triggers apoptosis (55), raising the possibility that ROS-mediated AMPK activation may have a role in HCV-induced cell cycle arrest and apoptosis (9, 54). Such a mechanism is likely to promote dissemination of the infection.
In conclusion, this study firmly establishes that ROS-induced activation of AMPK, attenuated DNL, and increased β-oxidation are associated with HCV-induced cell cycle arrest. Building on previous studies demonstrating AMPK inhibition prior to HCV-induced cell cycle arrest (111, 115), these results strongly support the HCV-induced metabolic reprogramming predicted by genomic and proteomic studies (7, 8), which are likely to contribute to the pathophysiology of HCV infection.
Author Contributions
D. N. D. conceived and coordinated the study, wrote the paper, and designed the experiments. N. M. K. coordinated the study, interpreted the data, provided study supervision and administrative support, and performed critical revision of the manuscript for important intellectual content. R. L. provided study supervision, provided interpretation and supervision for lipid analyses, interpreted the data, and performed critical revision of the manuscript for important intellectual content. C. H. P. performed cell culture experiments and data analysis and prepared figures. J. T. L. and G. L. performed experiments with mice. R. B. assisted with RT-PCRs and data analysis. A. A.-M. performed ROS determinations and performed critical revision of the manuscript for important intellectual content. M. L. and W. R. A. performed critical revision of the manuscript for important intellectual content.
Acknowledgments
We thank Drs. Jason Dyck and Gary Lopaschuk (University of Alberta) for helpful discussions throughout the course of these studies.
This work was supported by an operating grant from the Canadian Institute of Health Research (CIHR/IRSC) (to N. M. K., D. N. D., and R. L.). The authors declare that they have no conflicts of interest with the contents of this article.
- HCV
- hepatitis C virus
- ROS
- reactive oxygen species
- RNS
- reactive nitrogen species
- AMPK
- AMP-activated kinase
- PPAR
- peroxisome proliferator-activated receptor
- Alb-uPA
- albumin-urokinase plasminogen activator
- ER
- endoplasmic reticulum
- OA
- oleic acid
- H2DCFDA
- 2′,7′-dichlorodihydrofluorescein diacetate
- FFA
- free fatty acid
- MTT
- 3-(4,5-dimethylthiazol-2-yl)-2,5-diphenyltetrazolium bromide
- NAC
- N-acetylcysteine
- DNL
- de novo lipogenesis
- m.o.i.
- multiplicity of infection
- TAG
- triacylglycerol
- FC
- free cholesterol
- CE
- cholesteryl ester
- PL
- phospholipid
- ACC
- acetyl-CoA carboxylase
- hAAT
- human α1 anti-trypsin
- SCID
- severe combined immunodeficiency disorder
- MCAD
- medium-chain acyl-CoA dehydrogenase
- LCAD
- long-chain acyl-CoA dehydrogenase
- FA
- fatty acid
- PPRE
- peroxisome proliferator response element
- EdU
- 5-ethynyl-2′-deoxyuridine.
References
- 1. Alter M. J., Margolis H. S., Krawczynski K., Judson F. N., Mares A., Alexander W. J., Hu P. Y., Miller J. K., Gerber M. A., and Sampliner R. E. (1992) The natural history of community-acquired hepatitis C in the United States. The Sentinel Counties Chronic non-A, non-B Hepatitis Study Team. N. Engl. J. Med. 327, 1899–1905 [DOI] [PubMed] [Google Scholar]
- 2. Nelson D. R. (2001) The immunopathogenesis of hepatitis C virus infection. Clin. Liver Dis. 5, 931–953 [DOI] [PubMed] [Google Scholar]
- 3. Mengshol J. A., Golden-Mason L., and Rosen H. R. (2007) Mechanisms of disease: HCV-induced liver injury. Nat. Clin. Pract. Gastroenterol. Hepatol. 4, 622–634 [DOI] [PubMed] [Google Scholar]
- 4. Thomas D. L., and Seeff L. B. (2005) Natural history of hepatitis C. Clin. Liver Dis. 9, 383–398 [DOI] [PubMed] [Google Scholar]
- 5. Ivanov A. V., Bartosch B., Smirnova O. A., Isaguliants M. G., and Kochetkov S. N. (2013) HCV and oxidative stress in the liver. Viruses 5, 439–469 [DOI] [PMC free article] [PubMed] [Google Scholar]
- 6. Paracha U. Z., Fatima K., Alqahtani M., Chaudhary A., Abuzenadah A., Damanhouri G., and Qadri I. (2013) Oxidative stress and hepatitis C virus. Virol. J. 10, 251. [DOI] [PMC free article] [PubMed] [Google Scholar]
- 7. Diamond D. L., Syder A. J., Jacobs J. M., Sorensen C. M., Walters K. A., Proll S. C., McDermott J. E., Gritsenko M. A., Zhang Q., Zhao R., Metz T. O., Camp D. G. 2nd, Waters K. M., Smith R. D., Rice C. M., and Katze M. G. (2010) Temporal proteome and lipidome profiles reveal hepatitis C virus-associated reprogramming of hepatocellular metabolism and bioenergetics. PLoS Pathog. 6, e1000719. [DOI] [PMC free article] [PubMed] [Google Scholar]
- 8. Walters K. A., Joyce M. A., Thompson J. C., Smith M. W., Yeh M. M., Proll S., Zhu L. F., Gao T. J., Kneteman N. M., Tyrrell D. L., and Katze M. G. (2006) Host-specific response to HCV infection in the chimeric SCID-beige/Alb-uPA mouse model: role of the innate antiviral immune response. PLoS Pathog. 2, e59. [DOI] [PMC free article] [PubMed] [Google Scholar]
- 9. Walters K. A., Syder A. J., Lederer S. L., Diamond D. L., Paeper B., Rice C. M., and Katze M. G. (2009) Genomic analysis reveals a potential role for cell cycle perturbation in HCV-mediated apoptosis of cultured hepatocytes. PLoS Pathog. 5, e1000269. [DOI] [PMC free article] [PubMed] [Google Scholar]
- 10. Ivanov A. V., Smirnova O. A., Ivanova O. N., Masalova O. V., Kochetkov S. N., and Isaguliants M. G. (2011) Hepatitis C virus proteins activate NRF2/ARE pathway by distinct ROS-dependent and independent mechanisms in HUH7 cells. PLoS ONE 6, e24957. [DOI] [PMC free article] [PubMed] [Google Scholar]
- 11. Pal S., Polyak S. J., Bano N., Qiu W. C., Carithers R. L., Shuhart M., Gretch D. R., and Das A. (2010) Hepatitis C virus induces oxidative stress, DNA damage and modulates the DNA repair enzyme NEIL1. J. Gastroenterol. Hepatol. 25, 627–634 [DOI] [PMC free article] [PubMed] [Google Scholar]
- 12. Okuda M., Li K., Beard M. R., Showalter L. A., Scholle F., Lemon S. M., and Weinman S. A. (2002) Mitochondrial injury, oxidative stress, and antioxidant gene expression are induced by hepatitis C virus core protein. Gastroenterology 122, 366–375 [DOI] [PubMed] [Google Scholar]
- 13. Korenaga M., Wang T., Li Y., Showalter L. A., Chan T., Sun J., and Weinman S. A. (2005) Hepatitis C virus core protein inhibits mitochondrial electron transport and increases reactive oxygen species (ROS) production. J. Biol. Chem. 280, 37481–37488 [DOI] [PubMed] [Google Scholar]
- 14. Piccoli C., Scrima R., Quarato G., D'Aprile A., Ripoli M., Lecce L., Boffoli D., Moradpour D., and Capitanio N. (2007) Hepatitis C virus protein expression causes calcium-mediated mitochondrial bioenergetic dysfunction and nitro-oxidative stress. Hepatology 46, 58–65 [DOI] [PubMed] [Google Scholar]
- 15. Ando M., Korenaga M., Hino K., Ikeda M., Kato N., Nishina S., Hidaka I., and Sakaida I. (2008) Mitochondrial electron transport inhibition in full genomic hepatitis C virus replicon cells is restored by reducing viral replication. Liver Int. 28, 1158–1166 [DOI] [PubMed] [Google Scholar]
- 16. Wang T., Campbell R. V., Yi M. K., Lemon S. M., and Weinman S. A. (2010) Role of hepatitis C virus core protein in viral-induced mitochondrial dysfunction. J. Viral. Hepat. 17, 784–793 [DOI] [PMC free article] [PubMed] [Google Scholar]
- 17. Presser L. D., Haskett A., and Waris G. (2011) Hepatitis C virus-induced furin and thrombospondin-1 activate TGF-β1: role of TGF-β1 in HCV replication. Virology 412, 284–296 [DOI] [PMC free article] [PubMed] [Google Scholar]
- 18. Li S., Ye L., Yu X., Xu B., Li K., Zhu X., Liu H., Wu X., and Kong L. (2009) Hepatitis C virus NS4B induces unfolded protein response and endoplasmic reticulum overload response-dependent NF-κB activation. Virology 391, 257–264 [DOI] [PubMed] [Google Scholar]
- 19. Li Y., Boehning D. F., Qian T., Popov V. L., and Weinman S. A. (2007) Hepatitis C virus core protein increases mitochondrial ROS production by stimulation of Ca2+ uniporter activity. FASEB J. 21, 2474–2485 [DOI] [PubMed] [Google Scholar]
- 20. Dionisio N., Garcia-Mediavilla M. V., Sanchez-Campos S., Majano P. L., Benedicto I., Rosado J. A., Salido G. M., and Gonzalez-Gallego J. (2009) Hepatitis C virus NS5A and core proteins induce oxidative stress-mediated calcium signalling alterations in hepatocytes. J. Hepatol. 50, 872–882 [DOI] [PubMed] [Google Scholar]
- 21. Robinson L. C., and Marchant J. S. (2008) Enhanced Ca2+ leak from ER Ca2+ stores induced by hepatitis C NS5A protein. Biochem. Biophys. Res. Commun. 368, 593–599 [DOI] [PMC free article] [PubMed] [Google Scholar]
- 22. Benali-Furet N. L., Chami M., Houel L., De Giorgi F., Vernejoul F., Lagorce D., Buscail L., Bartenschlager R., Ichas F., Rizzuto R., and Paterlini-Bréchot P. (2005) Hepatitis C virus core triggers apoptosis in liver cells by inducing ER stress and ER calcium depletion. Oncogene 24, 4921–4933 [DOI] [PubMed] [Google Scholar]
- 23. Bergqvist A., Sundström S., Dimberg L. Y., Gylfe E., and Masucci M. G. (2003) The hepatitis C virus core protein modulates T cell responses by inducing spontaneous and altering T-cell receptor-triggered Ca2+ oscillations. J. Biol. Chem. 278, 18877–18883 [DOI] [PubMed] [Google Scholar]
- 24. Boudreau H. E., Emerson S. U., Korzeniowska A., Jendrysik M. A., and Leto T. L. (2009) Hepatitis C virus (HCV) proteins induce NADPH oxidase 4 expression in a transforming growth factor β-dependent manner: a new contributor to HCV-induced oxidative stress. J. Virol. 83, 12934–12946 [DOI] [PMC free article] [PubMed] [Google Scholar]
- 25. de Mochel N. S., Seronello S., Wang S. H., Ito C., Zheng J. X., Liang T. J., Lambeth J. D., and Choi J. (2010) Hepatocyte NAD(P)H oxidases as an endogenous source of reactive oxygen species during hepatitis C virus infection. Hepatology 52, 47–59 [DOI] [PMC free article] [PubMed] [Google Scholar]
- 26. Nakai K., Tanaka H., Hanada K., Ogata H., Suzuki F., Kumada H., Miyajima A., Ishida S., Sunouchi M., Habano W., Kamikawa Y., Kubota K., Kita J., Ozawa S., and Ohno Y. (2008) Decreased expression of cytochromes P450 1A2, 2E1, and 3A4 and drug transporters Na+-taurocholate-cotransporting polypeptide, organic cation transporter 1, and organic anion-transporting peptide-C correlates with the progression of liver fibrosis in chronic hepatitis C patients. Drug Metab. Dispos. 36, 1786–1793 [DOI] [PubMed] [Google Scholar]
- 27. Wen F., Abdalla M. Y., Aloman C., Xiang J., Ahmad I. M., Walewski J., McCormick M. L., Brown K. E., Branch A. D., Spitz D. R., Britigan B. E., and Schmidt W. N. (2004) Increased prooxidant production and enhanced susceptibility to glutathione depletion in HepG2 cells co-expressing HCV core protein and CYP2E1. J. Med. Virol. 72, 230–240 [DOI] [PubMed] [Google Scholar]
- 28. Otani K., Korenaga M., Beard M. R., Li K., Qian T., Showalter L. A., Singh A. K., Wang T., and Weinman S. A. (2005) Hepatitis C virus core protein, cytochrome P450 2E1, and alcohol produce combined mitochondrial injury and cytotoxicity in hepatoma cells. Gastroenterology 128, 96–107 [DOI] [PubMed] [Google Scholar]
- 29. Avadhani N. G., Sangar M. C., Bansal S., and Bajpai P. (2011) Bimodal targeting of cytochrome P450s to endoplasmic reticulum and mitochondria: the concept of chimeric signals. FEBS J. 278, 4218–4229 [DOI] [PMC free article] [PubMed] [Google Scholar]
- 30. Merquiol E., Uzi D., Mueller T., Goldenberg D., Nahmias Y., Xavier R. J., Tirosh B., and Shibolet O. (2011) HCV causes chronic endoplasmic reticulum stress leading to adaptation and interference with the unfolded protein response. PLoS ONE 6, e24660. [DOI] [PMC free article] [PubMed] [Google Scholar]
- 31. Chan S. W., and Egan P. A. (2005) Hepatitis C virus envelope proteins regulate CHOP via induction of the unfolded protein response. FASEB J. 19, 1510–1512 [DOI] [PubMed] [Google Scholar]
- 32. Yamane D., McGivern D. R., Wauthier E., Yi M., Madden V. J., Welsch C., Antes I., Wen Y., Chugh P. E., McGee C. E., Widman D. G., Misumi I., Bandyopadhyay S., Kim S., Shimakami T., et al. (2014) Regulation of the hepatitis C virus RNA replicase by endogenous lipid peroxidation. Nat. Med. 20, 927–935 [DOI] [PMC free article] [PubMed] [Google Scholar]
- 33. Choi J., Forman H. J., Ou J. H., Lai M. M., Seronello S., and Nandipati A. (2006) Redox modulation of the hepatitis C virus replication complex is calcium dependent. Free Radic. Biol. Med. 41, 1488–1498 [DOI] [PubMed] [Google Scholar]
- 34. Choi J., Lee K. J., Zheng Y., Yamaga A. K., Lai M. M., and Ou J. H. (2004) Reactive oxygen species suppress hepatitis C virus RNA replication in human hepatoma cells. Hepatology 39, 81–89 [DOI] [PubMed] [Google Scholar]
- 35. Seronello S., Montanez J., Presleigh K., Barlow M., Park S. B., and Choi J. (2011) Ethanol and reactive species increase basal sequence heterogeneity of hepatitis C virus and produce variants with reduced susceptibility to antivirals. PLoS ONE 6, e27436. [DOI] [PMC free article] [PubMed] [Google Scholar]
- 36. Forns X., and Bukh J. (1999) The molecular biology of hepatitis C virus. Genotypes and quasispecies. Clin. Liver Dis. 3, 693–716 [DOI] [PubMed] [Google Scholar]
- 37. Zou M. H., Kirkpatrick S. S., Davis B. J., Nelson J. S., Wiles W. G. 4th., Schlattner U., Neumann D., Brownlee M., Freeman M. B., and Goldman M. H. (2004) Activation of the AMP-activated protein kinase by the anti-diabetic drug metformin in vivo. Role of mitochondrial reactive nitrogen species. J. Biol. Chem. 279, 43940–43951 [DOI] [PubMed] [Google Scholar]
- 38. Viollet B., Foretz M., Guigas B., Horman S., Dentin R., Bertrand L., Hue L., and Andreelli F. (2006) Activation of AMP-activated protein kinase in the liver: a new strategy for the management of metabolic hepatic disorders. J. Physiol. 574, 41–53 [DOI] [PMC free article] [PubMed] [Google Scholar]
- 39. Hardie D. G. (2004) The AMP-activated protein kinase pathway–new players upstream and downstream. J. Cell Sci. 117, 5479–5487 [DOI] [PubMed] [Google Scholar]
- 40. Towler M. C., and Hardie D. G. (2007) AMP-activated protein kinase in metabolic control and insulin signaling. Circ. Res. 100, 328–341 [DOI] [PubMed] [Google Scholar]
- 41. Alvisi G., Madan V., and Bartenschlager R. (2011) Hepatitis C virus and host cell lipids: an intimate connection. RNA Biol. 8, 258–269 [DOI] [PubMed] [Google Scholar]
- 42. Bartosch B. (2009) Hepatitis C virus and its complex interplay with hepatic glucose and lipid metabolism. J. Hepatol. 50, 845–847 [DOI] [PubMed] [Google Scholar]
- 43. Miyoshi H., Moriya K., Tsutsumi T., Shinzawa S., Fujie H., Shintani Y., Fujinaga H., Goto K., Todoroki T., Suzuki T., Miyamura T., Matsuura Y., Yotsuyanagi H., and Koike K. (2011) Pathogenesis of lipid metabolism disorder in hepatitis C: polyunsaturated fatty acids counteract lipid alterations induced by the core protein. J. Hepatol. 54, 432–438 [DOI] [PubMed] [Google Scholar]
- 44. Popescu C. I., Riva L., Vlaicu O., Farhat R., Rouillé Y., and Dubuisson J. (2014) Hepatitis C virus life cycle and lipid metabolism. Biology 3, 892–921 [DOI] [PMC free article] [PubMed] [Google Scholar]
- 45. Schaefer E. A., and Chung R. T. (2013) HCV and host lipids: an intimate connection. Semin. Liver Dis. 33, 358–368 [DOI] [PubMed] [Google Scholar]
- 46. Syed G. H., Amako Y., and Siddiqui A. (2010) Hepatitis C virus hijacks host lipid metabolism. Trends Endocrinol. Metab. 21, 33–40 [DOI] [PMC free article] [PubMed] [Google Scholar]
- 47. Wu J. M., Skill N. J., and Maluccio M. A. (2010) Evidence of aberrant lipid metabolism in hepatitis C and hepatocellular carcinoma. HPB 12, 625–636 [DOI] [PMC free article] [PubMed] [Google Scholar]
- 48. Wakita T., Pietschmann T., Kato T., Date T., Miyamoto M., Zhao Z., Murthy K., Habermann A., Kräusslich H. G., Mizokami M., Bartenschlager R., and Liang T. J. (2005) Production of infectious hepatitis C virus in tissue culture from a cloned viral genome. Nat. Med. 11, 791–796 [DOI] [PMC free article] [PubMed] [Google Scholar]
- 49. Lindenbach B. D., Evans M. J., Syder A. J., Wölk B., Tellinghuisen T. L., Liu C. C., Maruyama T., Hynes R. O., Burton D. R., McKeating J. A., and Rice C. M. (2005) Complete replication of hepatitis C virus in cell culture. Science 309, 623–626 [DOI] [PubMed] [Google Scholar]
- 50. Lindenbach B. D., Meuleman P., Ploss A., Vanwolleghem T., Syder A. J., McKeating J. A., Lanford R. E., Feinstone S. M., Major M. E., Leroux-Roels G., and Rice C. M. (2006) Cell culture-grown hepatitis C virus is infectious in vivo and can be recultured in vitro. Proc. Natl. Acad. Sci. U.S.A. 103, 3805–3809 [DOI] [PMC free article] [PubMed] [Google Scholar]
- 51. Zhong J., Gastaminza P., Cheng G., Kapadia S., Kato T., Burton D. R., Wieland S. F., Uprichard S. L., Wakita T., and Chisari F. V. (2005) Robust hepatitis C virus infection in vitro. Proc. Natl. Acad. Sci. U.S.A. 102, 9294–9299 [DOI] [PMC free article] [PubMed] [Google Scholar]
- 52. Mateu G., Donis R. O., Wakita T., Bukh J., and Grakoui A. (2008) Intragenotypic JFH-1 based recombinant hepatitis C virus produces high levels of infectious particles but causes increased cell death. Virology 376, 397–407 [DOI] [PMC free article] [PubMed] [Google Scholar]
- 53. Zhong J., Gastaminza P., Chung J., Stamataki Z., Isogawa M., Cheng G., McKeating J. A., and Chisari F. V. (2006) Persistent hepatitis C virus infection in vitro: coevolution of virus and host. J. Virol. 80, 11082–11093 [DOI] [PMC free article] [PubMed] [Google Scholar]
- 54. Kannan R. P., Hensley L. L., Evers L. E., Lemon S. M., and McGivern D. R. (2011) Hepatitis C virus infection causes cell cycle arrest at the level of initiation of mitosis. J. Virol. 85, 7989–8001 [DOI] [PMC free article] [PubMed] [Google Scholar]
- 55. Beckers A., Organe S., Timmermans L., Scheys K., Peeters A., Brusselmans K., Verhoeven G., and Swinnen J. V. (2007) Chemical inhibition of acetyl-CoA carboxylase induces growth arrest and cytotoxicity selectively in cancer cells. Cancer Res. 67, 8180–8187 [DOI] [PubMed] [Google Scholar]
- 56. Blight K. J., McKeating J. A., and Rice C. M. (2002) Highly permissive cell lines for subgenomic and genomic hepatitis C virus RNA replication. J. Virol. 76, 13001–13014 [DOI] [PMC free article] [PubMed] [Google Scholar]
- 57. Meisse D., Van de Casteele M., Beauloye C., Hainault I., Kefas B. A., Rider M. H., Foufelle F., and Hue L. (2002) Sustained activation of AMP-activated protein kinase induces c-Jun N-terminal kinase activation and apoptosis in liver cells. FEBS Lett. 526, 38–42 [DOI] [PubMed] [Google Scholar]
- 58. Nourbakhsh M., Douglas D. N., Pu C. H., Lewis J. T., Kawahara T., Lisboa L. F., Wei E., Asthana S., Quiroga A. D., Law L. M., Chen C., Addison W. R., Nelson R., Houghton M., Lehner R., and Kneteman N. M. (2013) Arylacetamide deacetylase: a novel host factor with important roles in the lipolysis of cellular triacylglycerol stores, VLDL assembly and HCV production. J. Hepatol. 59, 336–343 [DOI] [PubMed] [Google Scholar]
- 59. Kato T., Date T., Murayama A., Morikawa K., Akazawa D., and Wakita T. (2006) Cell culture and infection system for hepatitis C virus. Nat. Protoc. 1, 2334–2339 [DOI] [PubMed] [Google Scholar]
- 60. Martínez-Flórez S., Gutiérrez-Fernández B., Sánchez-Campos S., González-Gallego J., and Tuñón M. J. (2005) Quercetin attenuates nuclear factor-κB activation and nitric oxide production in interleukin-1β-activated rat hepatocytes. J. Nutr. 135, 1359–1365 [DOI] [PubMed] [Google Scholar]
- 61. Gabriel C., Camins A., Sureda F. X., Aquirre L., Escubedo E., Pallàs M., and Camarasa J. (1997) Determination of nitric oxide generation in mammalian neurons using dichlorofluorescin diacetate and flow cytometry. J. Pharmacol. Toxicol. Methods 38, 93–98 [DOI] [PubMed] [Google Scholar]
- 62. Gunasekar P. G., Kanthasamy A. G., Borowitz J. L., and Isom G. E. (1995) Monitoring intracellular nitric oxide formation by dichlorofluorescin in neuronal cells. J. Neurosci. Methods 61, 15–21 [DOI] [PubMed] [Google Scholar]
- 63. Keston A. S., and Brandt R. (1965) The fluorometric analysis of ultramicro quantities of hydrogen peroxide. Anal. Biochem. 11, 1–5 [DOI] [PubMed] [Google Scholar]
- 64. Possel H., Noack H., Augustin W., Keilhoff G., and Wolf G. (1997) 2,7-Dihydrodichlorofluorescein diacetate as a fluorescent marker for peroxynitrite formation. FEBS Lett. 416, 175–178 [DOI] [PubMed] [Google Scholar]
- 65. Quiroga A. D., Li L., Trötzmüller M., Nelson R., Proctor S. D., Köfeler H., and Lehner R. (2012) Deficiency of carboxylesterase 1/esterase-x results in obesity, hepatic steatosis, and hyperlipidemia. Hepatology 56, 2188–2198 [DOI] [PubMed] [Google Scholar]
- 66. Ussher J. R., Wang W., Gandhi M., Keung W., Samokhvalov V., Oka T., Wagg C. S., Jaswal J. S., Harris R. A., Clanachan A. S., Dyck J. R., and Lopaschuk G. D. (2012) Stimulation of glucose oxidation protects against acute myocardial infarction and reperfusion injury. Cardiovasc. Res. 94, 359–369 [DOI] [PubMed] [Google Scholar]
- 67. Hansson P. K., Asztély A. K., Clapham J. C., and Schreyer S. A. (2004) Glucose and fatty acid metabolism in McA-RH7777 hepatoma cells vs. rat primary hepatocytes: responsiveness to nutrient availability. Biochim. Biophys. Acta 1684, 54–62 [DOI] [PubMed] [Google Scholar]
- 68. Waterfield C. J., Asker D. S., and Timbrell J. A. (1997) Triglyceride disposition in isolated hepatocytes after treatment with hydrazine. Chem. Biol. Interact. 107, 157–172 [DOI] [PubMed] [Google Scholar]
- 69. Stremmel W., Strohmeyer G., and Berk P. D. (1986) Hepatocellular uptake of oleate is energy dependent, sodium linked, and inhibited by an antibody to a hepatocyte plasma membrane fatty acid binding protein. Proc. Natl. Acad. Sci. U.S.A. 83, 3584–3588 [DOI] [PMC free article] [PubMed] [Google Scholar]
- 70. Law M., Maruyama T., Lewis J., Giang E., Tarr A. W., Stamataki Z., Gastaminza P., Chisari F. V., Jones I. M., Fox R. I., Ball J. K., McKeating J. A., Kneteman N. M., and Burton D. R. (2008) Broadly neutralizing antibodies protect against hepatitis C virus quasispecies challenge. Nat. Med. 14, 25–27 [DOI] [PubMed] [Google Scholar]
- 71. Douglas D. N., Kawahara T., Sis B., Bond D., Fischer K. P., Tyrrell D. L., Lewis J. T., and Kneteman N. M. (2010) Therapeutic efficacy of human hepatocyte transplantation in a SCID/uPA mouse model with inducible liver disease. PLoS ONE 5, e9209. [DOI] [PMC free article] [PubMed] [Google Scholar]
- 72. Kneteman N. M., Asthana S., Lewis J., Dibben C., Douglas D., Nourbakhsh M., Tyrrell L. J., and Lund G. (2012) Impact of calcineurin inhibitors with or without interferon on hepatitis C virus titers in a chimeric mouse model of hepatitis C virus infection. Liver Transpl. 18, 38–44 [DOI] [PubMed] [Google Scholar]
- 73. Kneteman N. M., Howe A. Y., Gao T., Lewis J., Pevear D., Lund G., Douglas D., Mercer D. F., Tyrrell D. L., Immermann F., Chaudhary I., Speth J., Villano S. A., O'Connell J., and Collett M. (2009) HCV796: A selective nonstructural protein 5B polymerase inhibitor with potent anti-hepatitis C virus activity in vitro, in mice with chimeric human livers, and in humans infected with hepatitis C virus. Hepatology 49, 745–752 [DOI] [PubMed] [Google Scholar]
- 74. Mercer D. F., Schiller D. E., Elliott J. F., Douglas D. N., Hao C., Rinfret A., Addison W. R., Fischer K. P., Churchill T. A., Lakey J. R., Tyrrell D. L., and Kneteman N. M. (2001) Hepatitis C virus replication in mice with chimeric human livers. Nat. Med. 7, 927–933 [DOI] [PubMed] [Google Scholar]
- 75. Wei E., Gao W., and Lehner R. (2007) Attenuation of adipocyte triacylglycerol hydrolase activity decreases basal fatty acid efflux. J. Biol. Chem. 282, 8027–8035 [DOI] [PubMed] [Google Scholar]
- 76. Meredith L. W., Harris H. J., Wilson G. K., Fletcher N. F., Balfe P., and McKeating J. A. (2013) Early infection events highlight the limited transmissibility of hepatitis C virus in vitro. J. Hepatol. 58, 1074–1080 [DOI] [PubMed] [Google Scholar]
- 77. Aitio M. L. (2006) N-Acetylcysteine–passe-partout or much ado about nothing? Br. J. Clin. Pharmacol. 61, 5–15 [DOI] [PMC free article] [PubMed] [Google Scholar]
- 78. Fullerton M. D., Galic S., Marcinko K., Sikkema S., Pulinilkunnil T., Chen Z. P., O'Neill H. M., Ford R. J., Palanivel R., O'Brien M., Hardie D. G., Macaulay S. L., Schertzer J. D., Dyck J. R., van Denderen B. J., et al. (2013) Single phosphorylation sites in Acc1 and Acc2 regulate lipid homeostasis and the insulin-sensitizing effects of metformin. Nat. Med. 19, 1649–1654 [DOI] [PMC free article] [PubMed] [Google Scholar]
- 79. Abu-Elheiga L., Jayakumar A., Baldini A., Chirala S. S., and Wakil S. J. (1995) Human acetyl-CoA carboxylase: characterization, molecular cloning, and evidence for two isoforms. Proc. Natl. Acad. Sci. U.S.A. 92, 4011–4015 [DOI] [PMC free article] [PubMed] [Google Scholar]
- 80. Abu-Elheiga L., Matzuk M. M., Abo-Hashema K. A., and Wakil S. J. (2001) Continuous fatty acid oxidation and reduced fat storage in mice lacking acetyl-CoA carboxylase 2. Science 291, 2613–2616 [DOI] [PubMed] [Google Scholar]
- 81. Yang D., Xue B., Wang X., Yu X., Liu N., Gao Y., Liu C., and Zhu H. (2013) 2-Octynoic acid inhibits hepatitis C virus infection through activation of AMP-activated protein kinase. PLoS ONE 8, e64932. [DOI] [PMC free article] [PubMed] [Google Scholar]
- 82. Barber M. C., Price N. T., and Travers M. T. (2005) Structure and regulation of acetyl-CoA carboxylase genes of metazoa. Biochim. Biophys. Acta 1733, 1–28 [DOI] [PubMed] [Google Scholar]
- 83. Kasai D., Adachi T., Deng L., Nagano-Fujii M., Sada K., Ikeda M., Kato N., Ide Y. H., Shoji I., and Hotta H. (2009) HCV replication suppresses cellular glucose uptake through down-regulation of cell surface expression of glucose transporters. J. Hepatol. 50, 883–894 [DOI] [PubMed] [Google Scholar]
- 84. Kim K. H. (1997) Regulation of mammalian acetyl-coenzyme A carboxylase. Annu. Rev. Nutr. 17, 77–99 [DOI] [PubMed] [Google Scholar]
- 85. Ruderman N. B., Saha A. K., Vavvas D., and Witters L. A. (1999) Malonyl-CoA, fuel sensing, and insulin resistance. Am. J. Physiol. 276, E1–E18 [DOI] [PubMed] [Google Scholar]
- 86. Bennett M. J. (2007) Assays of fatty acid β-oxidation activity. Methods Cell Biol. 80, 179–197 [DOI] [PubMed] [Google Scholar]
- 87. Pyper S. R., Viswakarma N., Yu S., and Reddy J. K. (2010) PPARα: energy combustion, hypolipidemia, inflammation and cancer. Nucl. Recept. Signal. 8, e002. [DOI] [PMC free article] [PubMed] [Google Scholar]
- 88. Burns K. A., and Vanden Heuvel J. P. (2007) Modulation of PPAR activity via phosphorylation. Biochim. Biophys. Acta 1771, 952–960 [DOI] [PMC free article] [PubMed] [Google Scholar]
- 89. Douglas D. N., and Kneteman N. M. (2015) Generation of improved mouse models for the study of hepatitis C virus. Eur. J. Pharmacol. 759, 313–325 [DOI] [PubMed] [Google Scholar]
- 90. Bukh J. (2012) Animal models for the study of hepatitis C virus infection and related liver disease. Gastroenterology 142, 1279–1287 [DOI] [PubMed] [Google Scholar]
- 91. Tateno C., Kataoka M., Utoh R., Tachibana A., Itamoto T., Asahara T., Miya F., Tsunoda T., and Yoshizato K. (2011) Growth hormone-dependent pathogenesis of human hepatic steatosis in a novel mouse model bearing a human hepatocyte-repopulated liver. Endocrinology 152, 1479–1491 [DOI] [PubMed] [Google Scholar]
- 92. Gibbons G. F., Islam K., and Pease R. J. (2000) Mobilisation of triacylglycerol stores. Biochim. Biophys. Acta 1483, 37–57 [DOI] [PubMed] [Google Scholar]
- 93. Krawczynski K., Beach M. J., Bradley D. W., Kuo G., di Bisceglie A. M., Houghton M., Reyes G. R., Kim J. P., Choo Q. L., and Alter M. J. (1992) Hepatitis C virus antigen in hepatocytes: immunomorphologic detection and identification. Gastroenterology 103, 622–629 [DOI] [PubMed] [Google Scholar]
- 94. Lau D. T., Fish P. M., Sinha M., Owen D. M., Lemon S. M., and Gale M. Jr. (2008) Interferon regulatory factor-3 activation, hepatic interferon-stimulated gene expression, and immune cell infiltration in hepatitis C virus patients. Hepatology 47, 799–809 [DOI] [PubMed] [Google Scholar]
- 95. Liang Y., Shilagard T., Xiao S. Y., Snyder N., Lau D., Cicalese L., Weiss H., Vargas G., and Lemon S. M. (2009) Visualizing hepatitis C virus infections in human liver by two-photon microscopy. Gastroenterology 137, 1448–1458 [DOI] [PubMed] [Google Scholar]
- 96. Sansonno D., Lauletta G., and Dammacco F. (2004) Detection and quantitation of HCV core protein in single hepatocytes by means of laser capture microdissection and enzyme-linked immunosorbent assay. J. Viral. Hepat. 11, 27–32 [DOI] [PubMed] [Google Scholar]
- 97. Vance D. E., and Vance J. E. (eds) (1996) Biochemistry of Lipids, Lipoproteins and Membranes, Elsevier, Cambridge, UK [Google Scholar]
- 98. Oakhill J. S., Chen Z. P., Scott J. W., Steel R., Castelli L. A., Ling N., Macaulay S. L., and Kemp B. E. (2010) β-Subunit myristoylation is the gatekeeper for initiating metabolic stress sensing by AMP-activated protein kinase (AMPK). Proc. Natl. Acad. Sci. U.S.A. 107, 19237–19241 [DOI] [PMC free article] [PubMed] [Google Scholar]
- 99. Rodrigues E., Mariutti L. R., and Mercadante A. Z. (2012) Scavenging capacity of marine carotenoids against reactive oxygen and nitrogen species in a membrane-mimicking system. Mar. Drugs 10, 1784–1798 [DOI] [PMC free article] [PubMed] [Google Scholar]
- 100. Assifi M. M., Suchankova G., Constant S., Prentki M., Saha A. K., and Ruderman N. B. (2005) AMP-activated protein kinase and coordination of hepatic fatty acid metabolism of starved/carbohydrate-refed rats. Am. J. Physiol. Endocrinol. Metab. 289, E794–E800 [DOI] [PubMed] [Google Scholar]
- 101. Dharancy S., Lemoine M., Mathurin P., Serfaty L., and Dubuquoy L. (2009) Peroxisome proliferator-activated receptors in HCV-related infection. PPAR Res. 2009, 357204. [DOI] [PMC free article] [PubMed] [Google Scholar]
- 102. Cheng Y., Dharancy S., Malapel M., and Desreumaux P. (2005) Hepatitis C virus infection down-regulates the expression of peroxisome proliferator-activated receptor α and carnitine palmitoyl acyl-CoA transferase 1A. World J. Gastroenterol. 11, 7591–7596 [DOI] [PMC free article] [PubMed] [Google Scholar]
- 103. Wu C., Gilroy R., Taylor R., Olyaee M., Abdulkarim B., Forster J., O'Neil M., Damjanov I., and Wan Y. J. (2011) Alteration of hepatic nuclear receptor-mediated signaling pathways in hepatitis C virus patients with and without a history of alcohol drinking. Hepatology 54, 1966–1974 [DOI] [PMC free article] [PubMed] [Google Scholar]
- 104. Tanaka N., Moriya K., Kiyosawa K., Koike K., Gonzalez F. J., and Aoyama T. (2008) PPARα activation is essential for HCV core protein-induced hepatic steatosis and hepatocellular carcinoma in mice. J. Clin. Invest. 118, 683–694 [DOI] [PMC free article] [PubMed] [Google Scholar]
- 105. Tanaka N., Moriya K., Kiyosawa K., Koike K., and Aoyama T. (2008) Hepatitis C virus core protein induces spontaneous and persistent activation of peroxisome proliferator-activated receptor α in transgenic mice: implications for HCV-associated hepatocarcinogenesis. Int. J. Cancer 122, 124–131 [DOI] [PubMed] [Google Scholar]
- 106. Borowski P., Heiland M., Feucht H., and Laufs R. (1999) Characterisation of non-structural protein 3 of hepatitis C virus as modulator of protein phosphorylation mediated by PKA and PKC: evidences for action on the level of substrate and enzyme. Arch. Virol. 144, 687–701 [DOI] [PubMed] [Google Scholar]
- 107. Farquhar M. J., Harris H. J., Diskar M., Jones S., Mee C. J., Nielsen S. U., Brimacombe C. L., Molina S., Toms G. L., Maurel P., Howl J., Herberg F. W., van Ijzendoorn S. C., Balfe P., and McKeating J. A. (2008) Protein kinase A-dependent step (s) in hepatitis C virus entry and infectivity. J. Virol. 82, 8797–8811 [DOI] [PMC free article] [PubMed] [Google Scholar]
- 108. Hsieh M. J., Lan K. P., Liu H. Y., Zhang X. Z., Lin Y. F., Chen T. Y., and Chiou H. L. (2012) Hepatitis C virus E2 protein involve in insulin resistance through an impairment of Akt/PKB and GSK3β signaling in hepatocytes. BMC Gastroenterol. 12, 74. [DOI] [PMC free article] [PubMed] [Google Scholar]
- 109. Zhao L. J., Wang L., Ren H., Cao J., Li L., Ke J. S., and Qi Z. T. (2005) Hepatitis C virus E2 protein promotes human hepatoma cell proliferation through the MAPK/ERK signaling pathway via cellular receptors. Exp. Cell Res. 305, 23–32 [DOI] [PubMed] [Google Scholar]
- 110. Chitraju C., Trötzmüller M., Hartler J., Wolinski H., Thallinger G. G., Lass A., Zechner R., Zimmermann R., Köfeler H. C., and Spener F. (2012) Lipidomic analysis of lipid droplets from murine hepatocytes reveals distinct signatures for nutritional stress. J. Lipid Res. 53, 2141–2152 [DOI] [PMC free article] [PubMed] [Google Scholar]
- 111. Mankouri J., Tedbury P. R., Gretton S., Hughes M. E., Griffin S. D., Dallas M. L., Green K. A., Hardie D. G., Peers C., and Harris M. (2010) Enhanced hepatitis C virus genome replication and lipid accumulation mediated by inhibition of AMP-activated protein kinase. Proc. Natl. Acad. Sci. U.S.A. 107, 11549–11554 [DOI] [PMC free article] [PubMed] [Google Scholar]
- 112. Sena L. A., and Chandel N. S. (2012) Physiological roles of mitochondrial reactive oxygen species. Mol. Cell 48, 158–167 [DOI] [PMC free article] [PubMed] [Google Scholar]
- 113. Tardif K. D., Waris G., and Siddiqui A. (2005) Hepatitis C virus, ER stress, and oxidative stress. Trends Microbiol. 13, 159–163 [DOI] [PubMed] [Google Scholar]
- 114. Horman S., Vertommen D., Heath R., Neumann D., Mouton V., Woods A., Schlattner U., Wallimann T., Carling D., Hue L., and Rider M. H. (2006) Insulin antagonizes ischemia-induced Thr-172 phosphorylation of AMP-activated protein kinase α-subunits in heart via hierarchical phosphorylation of Ser485/491. J. Biol. Chem. 281, 5335–5340 [DOI] [PubMed] [Google Scholar]
- 115. Huang H., Kang R., Wang J., Luo G., Yang W., and Zhao Z. (2013) Hepatitis C virus inhibits AKT-tuberous sclerosis complex (TSC), the mechanistic target of rapamycin (MTOR) pathway, through endoplasmic reticulum stress to induce autophagy. Autophagy 9, 175–195 [DOI] [PMC free article] [PubMed] [Google Scholar]
- 116. Deeb D., Gao X., Jiang H., Janic B., Arbab A. S., Rojanasakul Y., Dulchavsky S. A., and Gautam S. C. (2010) Oleanane triterpenoid CDDO-Me inhibits growth and induces apoptosis in prostate cancer cells through a ROS-dependent mechanism. Biochem. Pharmacol. 79, 350–360 [DOI] [PMC free article] [PubMed] [Google Scholar]
- 117. Qin L., Wang Z., Tao L., and Wang Y. (2010) ER stress negatively regulates AKT/TSC/mTOR pathway to enhance autophagy. Autophagy 6, 239–247 [DOI] [PubMed] [Google Scholar]
- 118. Høyer-Hansen M., Bastholm L., Szyniarowski P., Campanella M., Szabadkai G., Farkas T., Bianchi K., Fehrenbacher N., Elling F., Rizzuto R., Mathiasen I. S., and Jäättelä M. (2007) Control of macroautophagy by calcium, calmodulin-dependent kinase kinase-β, and Bcl-2. Mol. Cell 25, 193–205 [DOI] [PubMed] [Google Scholar]
- 119. Kouroku Y., Fujita E., Tanida I., Ueno T., Isoai A., Kumagai H., Ogawa S., Kaufman R. J., Kominami E., and Momoi T. (2007) ER stress (PERK/eIF2α phosphorylation) mediates the polyglutamine-induced LC3 conversion, an essential step for autophagy formation. Cell Death Differ. 14, 230–239 [DOI] [PubMed] [Google Scholar]
- 120. Fujita E., Kouroku Y., Isoai A., Kumagai H., Misutani A., Matsuda C., Hayashi Y. K., and Momoi T. (2007) Two endoplasmic reticulum-associated degradation (ERAD) systems for the novel variant of the mutant dysferlin: ubiquitin/proteasome ERAD(I) and autophagy/lysosome ERAD(II). Hum. Mol. Genet. 16, 618–629 [DOI] [PubMed] [Google Scholar]
- 121. Waris G., Felmlee D. J., Negro F., and Siddiqui A. (2007) Hepatitis C virus induces proteolytic cleavage of sterol regulatory element binding proteins and stimulates their phosphorylation via oxidative stress. J. Virol. 81, 8122–8130 [DOI] [PMC free article] [PubMed] [Google Scholar] [Retracted]
- 122. Yang W., Hood B. L., Chadwick S. L., Liu S., Watkins S. C., Luo G., Conrads T. P., and Wang T. (2008) Fatty acid synthase is up-regulated during hepatitis C virus infection and regulates hepatitis C virus entry and production. Hepatology 48, 1396–1403 [DOI] [PMC free article] [PubMed] [Google Scholar]
- 123. Boulant S., Targett-Adams P., and McLauchlan J. (2007) Disrupting the association of hepatitis C virus core protein with lipid droplets correlates with a loss in production of infectious virus. J. Gen. Virol. 88, 2204–2213 [DOI] [PubMed] [Google Scholar]
- 124. Kim S. J., Syed G. H., and Siddiqui A. (2013) Hepatitis C virus induces the mitochondrial translocation of Parkin and subsequent mitophagy. PLoS Pathog. 9, e1003285. [DOI] [PMC free article] [PubMed] [Google Scholar]
- 125. Vescovo T., Romagnoli A., Perdomo A. B., Corazzari M., Ciccosanti F., Alonzi T., Nardacci R., Ippolito G., Tripodi M., Garcia-Monzon C., Lo Iacono O., Piacentini M., and Fimia G. M. (2012) Autophagy protects cells from HCV-induced defects in lipid metabolism. Gastroenterology 142, 644–653 [DOI] [PubMed] [Google Scholar]
- 126. Knævelsrud H., and Simonsen A. (2012) Lipids in autophagy: constituents, signaling molecules and cargo with relevance to disease. Biochim. Biophys. Acta 1821, 1133–1145 [DOI] [PubMed] [Google Scholar]
- 127. Reznick R. M., and Shulman G. I. (2006) The role of AMP-activated protein kinase in mitochondrial biogenesis. J. Physiol. 574, 33–39 [DOI] [PMC free article] [PubMed] [Google Scholar]
- 128. Bergeron R., Ren J. M., Cadman K. S., Moore I. K., Perret P., Pypaert M., Young L. H., Semenkovich C. F., and Shulman G. I. (2001) Chronic activation of AMP kinase results in NRF-1 activation and mitochondrial biogenesis. Am. J. Physiol. Endocrinol. Metab. 281, E1340–E1346 [DOI] [PubMed] [Google Scholar]
- 129. Lee C. F., Liu C. Y., Hsieh R. H., and Wei Y. H. (2005) Oxidative stress-induced depolymerization of microtubules and alteration of mitochondrial mass in human cells. Ann. N.Y. Acad. Sci. 1042, 246–254 [DOI] [PubMed] [Google Scholar]
- 130. Shin S. M., Cho I. J., and Kim S. G. (2009) Resveratrol protects mitochondria against oxidative stress through AMP-activated protein kinase-mediated glycogen synthase kinase-3β inhibition downstream of poly (ADP-ribose)polymerase-LKB1 pathway. Mol. Pharmacol. 76, 884–895 [DOI] [PubMed] [Google Scholar]
- 131. Cai Y., Martens G. A., Hinke S. A., Heimberg H., Pipeleers D., and Van de Casteele M. (2007) Increased oxygen radical formation and mitochondrial dysfunction mediate β cell apoptosis under conditions of AMP-activated protein kinase stimulation. Free Radic. Biol. Med. 42, 64–78 [DOI] [PubMed] [Google Scholar]
- 132. Concannon C. G., Tuffy L. P., Weisová P., Bonner H. P., Dávila D., Bonner C., Devocelle M. C., Strasser A., Ward M. W., and Prehn J. H. (2010) AMP kinase-mediated activation of the BH3-only protein Bim couples energy depletion to stress-induced apoptosis. J. Cell Biol. 189, 83–94 [DOI] [PMC free article] [PubMed] [Google Scholar]
- 133. Brusselmans K., De Schrijver E., Verhoeven G., and Swinnen J. V. (2005) RNA interference-mediated silencing of the acetyl-CoA-carboxylase-α gene induces growth inhibition and apoptosis of prostate cancer cells. Cancer Res. 65, 6719–6725 [DOI] [PubMed] [Google Scholar]
- 134. Chajès V., Cambot M., Moreau K., Lenoir G. M., and Joulin V. (2006) Acetyl-CoA carboxylase α is essential to breast cancer cell survival. Cancer Res. 66, 5287–5294 [DOI] [PubMed] [Google Scholar]